R E S E A R C H A R T I C L E
Open Access
Pregnancy complications and birth
outcomes among women experiencing
nausea only or nausea and vomiting during
pregnancy in the Norwegian Mother and
Child Cohort Study
Arthur Chortatos
1,2*, Margaretha Haugen
3, Per Ole Iversen
2,4, Åse Vikanes
5, Malin Eberhard-Gran
6,7,
Elisabeth Krefting Bjelland
7,6, Per Magnus
5and Marit B. Veierød
1,2Abstract
Background:To compare pregnancy complications and birth outcomes for women experiencing nausea and vomiting in pregnancy, or nausea only, with symptom-free women.
Methods:Pregnancies from the Norwegian Mother and Child Cohort Study (n= 51 675), a population-based prospective cohort study, were examined. Data on nausea and/or vomiting during gestation and birth outcomes were collected from three questionnaires answered between gestation weeks 15 and 30, and linked with data from the Medical Birth Registry of Norway. Chi-squared tests, one way analysis of variance, multiple linear and logistic regression analyses were used.
Results:Women with nausea and vomiting (NVP) totalled 17 070 (33 %), while 20 371 (39 %) experienced nausea only (NP), and 14 234 (28 %) were symptom-free (SF). When compared to SF women, NVP and NP women had significantly increased odds for pelvic girdle pain (adjusted odds ratio, aOR, 2.26, 95 % confidence interval, 95 % CI, 2.09–2.43, and aOR 1.90, 95 % CI, 1.76–2.05, respectively) and proteinuria (aOR 1.50, 95 % CI 1.38–1.63, and 1.20, 95 % CI 1.10–1.31, respectively). Women with NVP also had significantly increased odds for high blood pressure (aOR 1.40, 95 % CI 1.17–1.67) and preeclampsia (aOR 1.13, 95 % CI 1.01–1.27). Conversely, the NVP and NP groups had significantly reduced odds for unfavourable birth outcomes such as low birth weight infants (aOR 0.72, 95 % CI 0.60–0.88, and aOR 0.73, 95 % CI 0.60–0.88, respectively) and small for gestational age infants (aOR 0.78, 95 % CI 0.73–0.84, and aOR 0.87, 95 % CI 0.81–0.93, respectively).
Conclusions:We found that women with NVP and NP are more likely to develop pregnancy complications, yet they display mostly favourable delivery and birth outcomes.
Keywords:Nausea and vomiting in pregnancy, Pregnancy hormones, Pelvic girdle pain, Pregnancy outcomes, Birth outcomes, MoBa
* Correspondence:athanasc@medisin.uio.no 1
Oslo Centre for Biostatistics and Epidemiology, Institute of Basic Medical Sciences, University of Oslo, PO Box 1122, Blindern N-0317 Oslo, Norway 2
Department of Nutrition, Institute of Basic Medical Sciences, University of Oslo, PO Box 1046, Blindern N-0317 Oslo, Norway
Full list of author information is available at the end of the article
Background
Nausea and vomiting in pregnancy (NVP) or nausea only (NP) have been conditions reportedly accompanying ges-tation for over 4000 years. Global prevalence varies from approximately 50 to 80 % of all pregnancies [1–5]. The wide variation may be attributable to a lack of universally accepted definitions of these two conditions, which span from slight dizziness and dry retching to continuous vomiting. Hyperemesis gravidarum (HG) is an extreme form of NVP, whereby the extent of vomiting may be so profound that weight loss, electrolyte imbalance, and de-hydration requiring hospitalisation result [6]. The NVP condition appears to be so ubiquitous that it has been sug-gested as being the norm rather than the exception during pregnancy [7]. The aetiology of NVP remains unknown, although it is currently believed to be related to early pregnancy hormones [3, 4].
Lately there has been a resurgence of interest in topics related to NVP, such as diet, gestational conditions and birth outcomes [8–10]. In studies addressing pregnancy complications and birth outcomes for NVP women, re-sults have often been contradictory. Although previous studies found no correlation between NVP and compli-cations such as preeclampsia, diabetes, hypertension, or proteinuria [1, 5, 11], others reported an increased risk of gestational diabetes, hypertension, and preeclampsia for NVP women [8, 12]. Women with NVP were found more likely to have a longer gestation and a consequent lower risk of delivering preterm (< week 37) compared to symptom-free women [5, 13–15], but no association and an increased risk have also been reported [6, 8, 16, 17]. Birth weight reports have also varied in studies of differing design and size, with some observing heavier birth weights from NVP mothers [13, 18, 19], some ob-serving lighter birth weights [9, 20, 21], and some reporting no difference [5, 7, 11, 14–17, 22].
Studies exploring birth anomalies have found no sig-nificant differences in the occurrence of these outcomes for women with NVP [7, 16, 23, 24], although a few stud-ies have found a significantly higher number of births with anomalies or malformations for women with HG [20, 25, 26]. Additionally, NVP has been associated with increased numbers of female gender births [6, 8, 15, 17, 25, 27], al-though some studies found no association between NVP and gender [9, 22, 24], and one study found that NVP was associated with male gender [28].
The Norwegian Mother and Child Cohort study (MoBa) includes a large sample of pregnancies, together with information regarding nausea and vomiting during pregnancy, providing an ideal opportunity to study some of the contradictory results in the literature. In addition, the cohort has been linked with the Medical Birth Registry of Norway (MBRN), allowing access to key birth outcomes.
The aim of this paper was to use the MoBa study to compare pregnancy complications and birth outcomes in full term pregnancies for the women that experience NVP or NP, compared with symptom-free (SF) women.
Methods
The Norwegian Mother and Child Cohort Study (MoBa)
MoBa is a prospective population-based pregnancy co-hort study conducted by the Norwegian Institute of Pub-lic Health [29]. Participants were recruited from all over Norway from 1999 to 2008 and the women consented to participation in 40.6 % of the pregnancies. The women were asked to answer three questionnaires during preg-nancy, and follow-up questionnaires were delivered post-partum at regular intervals. Pregnancy and birth records from the MBRN were linked to the MoBa cohort [30]. The present study used the quality-assured data files en-titled‘version 4’which consisted of 108 842 children.
Questionnaires and variables
The MoBa data in this study were primarily drawn from the three self-administered questionnaires answered in gestational weeks 15 (Q1), 18–22 (Q2), and 30 (Q3), respectively. Q1 was a general questionnaire covering details regarding maternal health, lifestyle, demograph-ics, previous pregnancies, as well as early reports of nau-sea and/or vomiting. From Q1 we used maternal height (cm), weight at the start of pregnancy (kg), number of previous pregnancies, previous experiences of NVP (yes or no), previous experiences of pelvic girdle pain (PGP; yes or no), previous preeclampsia (yes or no), diabetic his-tory pre-pregnancy (yes or no), education (seven categor-ies collapsed into:≤12 years, 13–16 years, or≥17 years), previous stillbirths or spontaneous miscarriages (yes or no), and smoking during pregnancy (no, sometimes, or daily). Maternal body mass index (BMI, kg/m2) was cal-culated at the start of pregnancy. Parity data from the MBRN and questions detailing previously occurring pregnancies from Q1 were combined in order to minim-ise missing values [31]. Q2 included a semi-quantitative and validated food frequency questionnaire designed to capture dietary habits during the first 4–5 months of pregnancy, enabling assessment of energy intake (kJ) [32]. Version two of Q2 included detailed questions re-garding nausea and vomiting, in addition to the food frequency questionnaire, thus only the women answer-ing version two were included in this study. The nausea and vomiting questions probed experiences of nausea or vomiting during pregnancy (yes or no), the gestational week of onset and cessation, and whether women were still experiencing nausea and/or vomiting at the time of answering the questionnaire.
nausea and vomiting during pregnancy requiring hospi-talisation before week 25 of gestation. Q3 also provided data regarding history of high blood pressure prior to pregnancy (yes or no), PGP (defined as self-reported mild or severe pain in the anterior and bilateral poster-ior pelvis, experiences of ≥3 weeks; yes or no), severe PGP (defined as PGP in addition to the pubic bone region with severe pain reported in all three pelvic lo-cations), high blood pressure in pregnancy (≥3 weeks; yes or no), and proteinuria (≥3 weeks with protein in urine; yes or no). Women answering Q3 also had an option to report their highest recorded systolic and dia-stolic pressure readings. We included one question, an-swered 6 months postpartum in questionnaire four (Q4), regarding reasons for caesarean delivery (breech, previous caesarean delivery, pregnancy complication/ill mother, poor growth/fetus complication, own prefer-ence, or other).
Data regarding maternal age (year), parity (para 0, para 1, or para ≥2), gestational length (weeks), preeclampsia (defined as eclampsia during birth, during pregnancy and/or post-partum, light or serious preeclampsia, or HELLP syndrome; eleven categories collapsed into yes or no), gestational diabetes (five categories collapsed into yes or no), birth type (five categories collapsed into nor-mal cephalic or other presentations than nornor-mal ceph-alic), caesarean delivery type (no, planned, emergency, or unspecified), placental- and birth weights (g), gender of infant (male or female), body length and head circumfer-ence of infant (cm), Apgar scores after 5 min (0–10 score categorised into 0–6 or 7–10), birth defects (yes or no), and infant mortality (eight categories collapsed into born alive (lived >1 y) or born alive then died≤1 y post-delivery) were obtained from the MBRN. Further details of the diagnostic criteria used in the MBRN for pre-eclampsia and gestational diabetes can be found else-where [33, 34]. Birth defects were defined as any birth defect or malformation registered in the MBRN using the International Classification of Diseases chapter 17 definition [35, 36]. Gestational length calculations were based on ultrasound estimates. The small for gestational age (SGA) variable was created calculating the 10th birth weight percentile of each gestational week from MoBa and MBRN data, based on parity (para 0 vs. para ≥1). Owing to some extreme outlier values for placental- and birth weights, as well as for body length of infant and head circumference in the data set of the MBRN, only values within three standard deviations from the mean for these variables were included in the analyses: pla-centa weight 99–1258 g, birth weight 1937–5242 g, length 43.1–57.6 cm, and head circumference 30.3– 40.3 cm. Outcome questions from either MoBa or the MBRN allowing only for an answer of ‘yes’ had non-answers recoded to‘no’or‘none’.
Study sample
The present study included 108 842 children, and exclu-sions were made for multiple births (n= 3805), and for women not answering Q1 or only version one of Q2 (n = 14 190). We also excluded women not answering ver-sion 2 of Q2 (n= 5390), or questions relating to episodes of nausea and/or vomiting, or reporting a duration of nausea or vomiting longer than 26 weeks (n= 3040). Women recalling NVP symptoms in Q2 contradicting their previous answers reported weeks earlier in Q1 were excluded (n= 15 791). Women reporting only vomiting, or hospitalisation due to HG, and women with an energy intake outside the range of 4500–20 000 kJ were also ex-cluded (n= 2358). Women with multiple participation in MoBa due to additional pregnancies had all but their first participation excluded (n= 9699). Finally, women with a gestational length outside weeks 28–42, women without a full term pregnancy (i.e. non-living births), and those with missing weight and height at the start of pregnancy were excluded (n= 2894).
In total, 51 675 women were included in the final study sample: 17 070 (33 %) reporting NVP, 20 371 (39 %) reporting NP, and 14 234 (28 %) SF. This is the same sample used in our previous analysis of NVP in relation to maternal diet and lifestyle, and a detailed de-scription and flow diagram presenting exclusion criteria can be found there [10]. Moreover, severity of symptoms was reported, and the NVP group had a significantly longer mean duration of nausea than the NP group (9.6 weeks versus 7.4 weeks,p< 0.001) [10].
Further to these exclusions, women reporting diabetes pre-pregnancy from Q1 (n= 251) were excluded from analyses of gestational diabetes, creating a sub-group called‘gestational diabetes-no prior history’(n= 51 424). Women reporting high blood pressure prior to preg-nancy from Q3 (n= 1491) were excluded from analyses of high blood pressure, creating a sub-group called‘high blood pressure-no prior history’(n= 43 089).
Statistical analyses
linear regression. Logistic regression models (except low birth weight and gender of infant) included maternal age (continuous), BMI (continuous), smoking during preg-nancy, parity, education, and gender of infant. Gender of infant analysis included the same covariates minus gender of infant. Logistic regression of low birth weight and linear regression analysis of birth weight, body length, and head circumference additionally included adjustments for gestational length (continuous) and energy intake (con-tinuous). Gestational diabetes, preeclampsia and high blood pressure-no prior history were also included in the model analysing birth weight and low birth weight outcomes, however their addition gave similar results and were therefore omitted from the presentation of re-sult. Results are presented as crude odds ratios (cOR) and adjusted odds ratios (aOR) or mean differences with 95 % confidence intervals (95 % CIs). Statistical inter-action effects were studied and these results are pre-sented in supplementary tables. A significance level of 0.05 was used. All analyses were performed using SPSS 20.0 (IBM Corp, Armonk, NY, USA). We have followed the standard criteria in the Strengthening the Reporting of Observational Studies in Epidemiology (STROBE) statement (http://www.strobe-statement.org).
Details of ethics approval
The present study was conducted according to the guidelines laid down in the Declaration of Helsinki and all procedures involving human subjects were approved by the Regional Committee for Medical and Health Research Ethics in South-Eastern Norway Committee A (REC South East A, reference numbers 97045 and S-95113) and the Norwegian Data Protection Authority.
Written informed consent was obtained from all MoBa participants.
Results
Maternal and gestational history
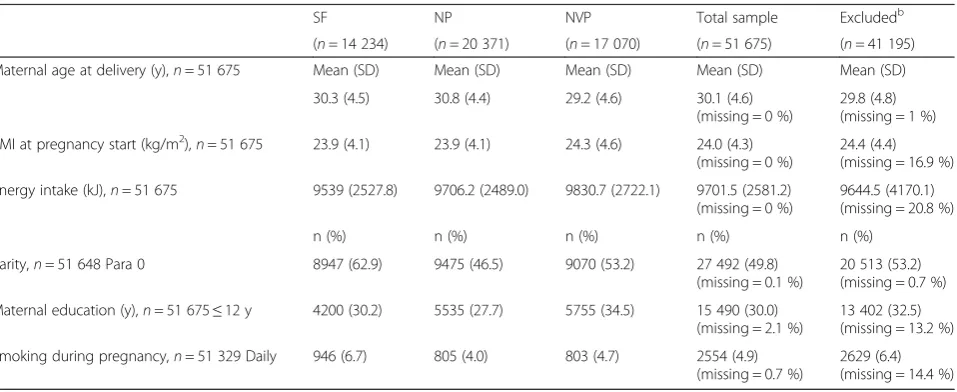
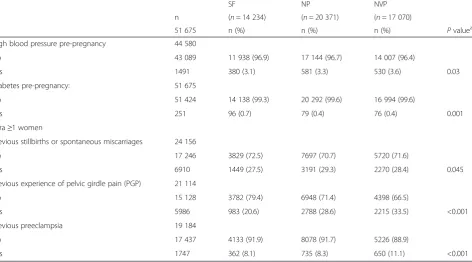
Maternal demographics and characteristics for the NVP (33 %), NP (39 %), and SF (28 %) groups relevant for the multivariable analyses are shown in Table 1. The total study sample compared with those women excluded from the sample display similar values in regards mater-nal age, BMI and energy intake. The proportions of para 0 women, women with ≤12 years education and daily smokers during pregnancy are slightly lower in the study sample. However, among the excluded women, 13.2 % (n= 5438/41 195) had missing values on education and 14.4 % (n= 5922/41 195) had missing values on smoking. The SF group had the lowest proportion of those with high blood pressure pre-pregnancy and the highest pro-portion of those with diabetes pre-pregnancy (Table 2). Moreover, amongst the para ≥1 women, the SF group had the lowest proportion of reported previous stillbirths or spontaneous miscarriages, lowest proportion of previ-ous experiences of PGP, and the lowest proportion of previous preeclampsia.
Pregnancy complications
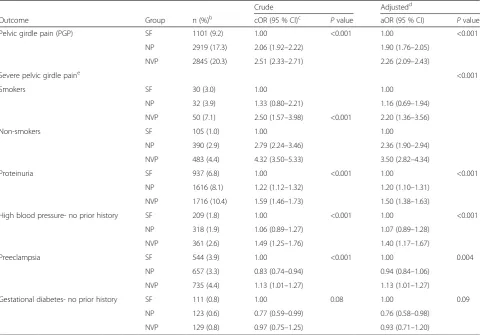
When the NVP and NP groups were compared with the SF group, we found significantly increased odds for PGP (aOR 2.26, 95 % CI 2.09–2.43, and aOR 1.90, 95 % CI 1.76–2.05, respectively) and proteinuria (aOR 1.50, 95 % CI 1.38–1.63, and aOR 1.20, 95 % CI 1.10–1.31, respect-ively, Table 3). In the analysis of severe PGP, we found a significant interaction between group and maternal
Table 1Selected characteristics in relation to group (symptom-free (SF), nausea only (NP), and nausea and vomiting (NVP)), including total sample used and those excludeda
SF NP NVP Total sample Excludedb
(n= 14 234) (n= 20 371) (n= 17 070) (n= 51 675) (n= 41 195)
Maternal age at delivery (y),n= 51 675 Mean (SD) Mean (SD) Mean (SD) Mean (SD) Mean (SD)
30.3 (4.5) 30.8 (4.4) 29.2 (4.6) 30.1 (4.6)
Energy intake (kJ),n= 51 675 9539 (2527.8) 9706.2 (2489.0) 9830.7 (2722.1) 9701.5 (2581.2) (missing = 0 %)
Smoking during pregnancy,n= 51 329 Daily 946 (6.7) 805 (4.0) 803 (4.7) 2554 (4.9) (missing = 0.7 %)
2629 (6.4) (missing = 14.4 %)
a
Excerpt of sample characteristics from Chortatos et al. [10]
b
Total MoBa samplen= 108 842 children, minus 1906 2nd
or 3rd
smoking during pregnancy (P= 0.04), whereby the asso-ciation between group and severe PGP was strongest among non-smokers (aOR 2.36, 95 % CI 1.90–2.94 for NP, and aOR 3.50, 95 % CI 2.82–4.34 for NVP, Table 3). The NVP women also had significantly increased odds for high blood pressure-no prior history (aOR 1.40, 95 % CI 1.17–1.67) and preeclampsia (aOR 1.13, 95 % CI 1.01–1.27), when compared to the SF group. Conversely, the NP group had significantly reduced odds of develop-ing gestational diabetes-no prior history (aOR 0.76, 95 % CI 0.58–0.98), compared to the SF group. Of the 888 women with high blood pressure-no prior history, n= 747 recorded a pressure reading. Of these, the mean was 142/88 mmHg in the NVP group (n= 299), 142/ 87 mmHg in the NP group (n= 266), and 144/88 mmHg in the SF group (n= 182). Of those answering ‘yes’ to high blood pressure prior to pregnancy,n= 550 recorded a pressure reading (mean 149/97 mmHg).
Delivery and birth outcomes
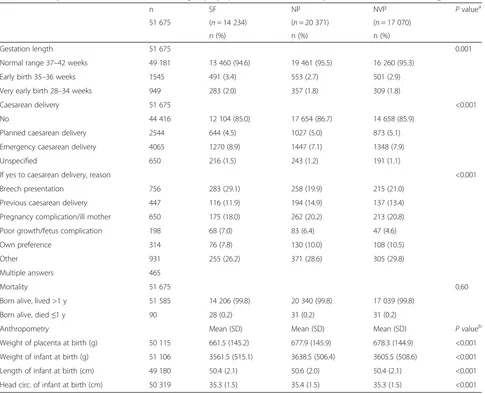
The SF group had the highest proportions delivering preterm or with emergency caesarean delivery, in addition to the highest proportion with a caesarean delivery due to breech presentation or poor growth/fetus complications (Table 4). The SF group had infants born with the lowest mean placental- and birth weights.
The NP group had significantly lower odds of experi-encing birth outcomes such as an emergency caesarean delivery (aOR 0.91, 95 % CI 0.84–0.99) or having a
preterm birth (aOR 0.86, 95 % CI 0.78–0.96, Table 5) when compared to the SF group. Likewise, the NVP group had significantly lower odds of delivering an in-fant with a birth type other than normal cephalic. When analysing Apgar score after 5 min, we found a significant interaction between group and infant gender (P= 0.001); both the NVP and NP group had significantly lower odds of an Apgar score <7 than the SF group if the in-fant was male. Both NVP and NP groups had signifi-cantly lower odds of delivering low birth weight infants or SGA infants than the SF group (aOR 0.72, 95 % CI 0.60–0.88 and aOR 0.73, 95 % CI 0.60–0.88 for low birth weight, and aOR 0.78, 95 % CI 0.73–0.84 and aOR 0.87, 95 % CI 0.81–0.93 for SGA, respectively, Table 5). No significant association was found between group and birth defects (p= 0.15), though an indication of increased odds ratio was found when comparing the NP group with the SF group (aOR 1.10, 95 % CI 1.00–1.22). Both NVP and NP groups had significantly increased odds of having an infant of female gender compared to SF women.
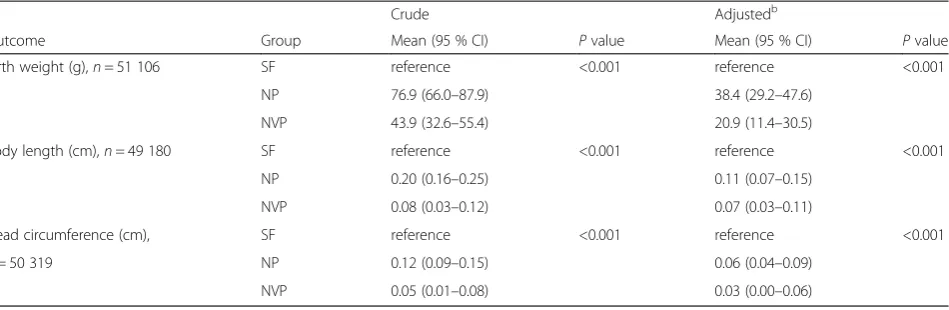
In linear regression analyses of birth weight we found that NVP and NP women gave birth to significantly heavier infants than the SF women (p< 0.001, Table 6). Likewise, the NP women had significantly longer infants, with significantly larger head circumferences than the infants of the SF group (p< 0.001). Several interaction effects were revealed in the analysis of birth weight and head circumference (interaction results can be found in Additional file 1: Table S1).
Table 2Maternal and gestational history in relation to group (symptom-free (SF), nausea only (NP), and nausea and vomiting (NVP))
SF NP NVP
n (n= 14 234) (n= 20 371) (n= 17 070)
51 675 n (%) n (%) n (%) Pvaluea
High blood pressure pre-pregnancy 44 580
No 43 089 11 938 (96.9) 17 144 (96.7) 14 007 (96.4)
Yes 1491 380 (3.1) 581 (3.3) 530 (3.6) 0.03
Diabetes pre-pregnancy: 51 675
No 51 424 14 138 (99.3) 20 292 (99.6) 16 994 (99.6)
Yes 251 96 (0.7) 79 (0.4) 76 (0.4) 0.001
Para≥1 women
Previous stillbirths or spontaneous miscarriages 24 156
No 17 246 3829 (72.5) 7697 (70.7) 5720 (71.6)
Yes 6910 1449 (27.5) 3191 (29.3) 2270 (28.4) 0.045
Previous experience of pelvic girdle pain (PGP) 21 114
No 15 128 3782 (79.4) 6948 (71.4) 4398 (66.5)
Yes 5986 983 (20.6) 2788 (28.6) 2215 (33.5) <0.001
Previous preeclampsia 19 184
No 17 437 4133 (91.9) 8078 (91.7) 5226 (88.9)
Yes 1747 362 (8.1) 735 (8.3) 650 (11.1) <0.001
a
Discussion
In this large cohort we found that women experiencing NVP and NP collectively reported significantly higher odds of developing pregnancy complications such as PGP, severe PGP, high blood pressure, proteinuria, and preeclampsia, than the SF women did. Conversely, the NVP and NP women collectively reported significantly lower odds of unfavourable delivery and birth outcomes, such as an emergency caesarean delivery, a birth presen-tation other than normal cephalic, preterm births, low Apgar scores after 5 min, low birth weight and SGA in-fants, compared to SF women. The infants of the NVP and NP women were born heavier, longer, and with a larger head circumference. In addition, the NVP and NP women displayed significantly higher odds of giving birth to female infants.
Owing to our strict delineation between NVP and NP, caution must be exercised when comparing our results with previous studies where women with only vomiting,
HG, or with NP and NVP combined have been studied. Unspecific classifications may contribute to the conflict-ing results from different studies.
That the NVP women had the highest odds of devel-oping high blood pressure and proteinuria in pregnancy supports that they also have the highest odds of develop-ing preeclampsia, since the pathophysiology and diagno-sis of preeclampsia includes both maladies [37], and is a finding supported elsewhere [8]. The mean systolic and diastolic pressure reported by the three groups promotes this condition to borderline hypertension by definition (i.e.≥140/90 mmHg) [37].
A large retrospective study observing birth outcomes for women with hypertension in pregnancy found that these women had increased odds for preterm delivery, low birth weight infants, and infants with a low Apgar score [38]. Although this present study focused on dif-ferent endpoints, the borderline hypertension present in our NVP and NP groups suggest that NVP may have an
Table 3Odds ratiosaof pregnancy complications in relation to group (symptom-free (SF), nausea only (NP), and nausea and vomiting (NVP))
Crude Adjustedd
Outcome Group n (%)b cOR (95 % CI)c Pvalue aOR (95 % CI) Pvalue
Pelvic girdle pain (PGP) SF 1101 (9.2) 1.00 <0.001 1.00 <0.001
NP 2919 (17.3) 2.06 (1.92–2.22) 1.90 (1.76–2.05)
NVP 2845 (20.3) 2.51 (2.33–2.71) 2.26 (2.09–2.43)
Severe pelvic girdle paine <0.001
Smokers SF 30 (3.0) 1.00 1.00
NP 32 (3.9) 1.33 (0.80–2.21) 1.16 (0.69–1.94)
NVP 50 (7.1) 2.50 (1.57–3.98) <0.001 2.20 (1.36–3.56)
Non-smokers SF 105 (1.0) 1.00 1.00
NP 390 (2.9) 2.79 (2.24–3.46) 2.36 (1.90–2.94)
NVP 483 (4.4) 4.32 (3.50–5.33) 3.50 (2.82–4.34)
Proteinuria SF 937 (6.8) 1.00 <0.001 1.00 <0.001
NP 1616 (8.1) 1.22 (1.12–1.32) 1.20 (1.10–1.31)
NVP 1716 (10.4) 1.59 (1.46–1.73) 1.50 (1.38–1.63)
High blood pressure- no prior history SF 209 (1.8) 1.00 <0.001 1.00 <0.001
NP 318 (1.9) 1.06 (0.89–1.27) 1.07 (0.89–1.28)
NVP 361 (2.6) 1.49 (1.25–1.76) 1.40 (1.17–1.67)
Preeclampsia SF 544 (3.9) 1.00 <0.001 1.00 0.004
NP 657 (3.3) 0.83 (0.74–0.94) 0.94 (0.84–1.06)
NVP 735 (4.4) 1.13 (1.01–1.27) 1.13 (1.01–1.27)
Gestational diabetes- no prior history SF 111 (0.8) 1.00 0.08 1.00 0.09
NP 123 (0.6) 0.77 (0.59–0.99) 0.76 (0.58–0.98)
NVP 129 (0.8) 0.97 (0.75–1.25) 0.93 (0.71–1.20)
a
OR, odds ratio, logistic regression analysis
b
Number (%) of women with outcome
c
CI, confidence interval
d
Adjusted for age, body mass index, smoking during pregnancy, parity, education, and gender
e
alternate impact upon these birth outcomes in regards to the contrasting results for these outcomes found here. The association between NVP and preeclampsia remains enigmatic, although severe vomiting has previously been associated with preeclampsia [12, 39]. Correlations have been reported for preeclampsia with abnormal levels of the hormone human chorionic gonadotropin (hCG), as well as the hormone relaxin in first trimester pregnant women [37, 40–42]. Both hormones feature prominently during the first weeks of pregnancy and act in tandem, appropriately raising suspicion as to their contribution to NVP [42]. Currently, hCG is primarily suspected of be-ing responsible for NVP, as the timbe-ing of release correlates with the onset of symptoms [3, 43, 44], although relaxin’s timing is near identical [42]. It is noteworthy that low relaxin levels have been implicated in hypertension and preeclampsia by affecting endothelial vasodilation, and
relaxin as a treatment for preeclampsia is currently under research [37, 42, 45].
Relaxin has previously been implicated with PGP, how-ever, its role in PGP is currently inconclusive [46, 47]. Although high levels of relaxin have been suggested as contributing in the underlying mechanisms of PGP [47], when examining the other outcomes in our study, low levels of relaxin seem more plausible for the NVP group here. In addition to the examples mentioned, relaxin is also found to be involved in resetting the osmotic threshold for thirst and antidiuretic hormone release during early pregnancy [48]. A low level of relaxin would thus cause a delay in resetting, accompanied by aberrant water intake patterns, elements that have been suggested in previous studies [10, 49]. By virtue of the higher placental- and birth weights observed, the NVP and NP women have most likely experienced a higher plasma
Table 4Delivery and birth outcomes in relation to group (symptom-free (SF), nausea only (NP), and nausea and vomiting (NVP))
n SF NP NVP Pvaluea
51 675 (n= 14 234) (n= 20 371) (n= 17 070)
n (%) n (%) n (%)
Gestation length 51 675 0.001
Normal range 37–42 weeks 49 181 13 460 (94.6) 19 461 (95.5) 16 260 (95.3)
Early birth 35–36 weeks 1545 491 (3.4) 553 (2.7) 501 (2.9)
Very early birth 28–34 weeks 949 283 (2.0) 357 (1.8) 309 (1.8)
Caesarean delivery 51 675 <0.001
No 44 416 12 104 (85.0) 17 654 (86.7) 14 658 (85.9)
Planned caesarean delivery 2544 644 (4.5) 1027 (5.0) 873 (5.1)
Emergency caesarean delivery 4065 1270 (8.9) 1447 (7.1) 1348 (7.9)
Unspecified 650 216 (1.5) 243 (1.2) 191 (1.1)
If yes to caesarean delivery, reason <0.001
Breech presentation 756 283 (29.1) 258 (19.9) 215 (21.0)
Previous caesarean delivery 447 116 (11.9) 194 (14.9) 137 (13.4)
Pregnancy complication/ill mother 650 175 (18.0) 262 (20.2) 213 (20.8)
Poor growth/fetus complication 198 68 (7.0) 83 (6.4) 47 (4.6)
Own preference 314 76 (7.8) 130 (10.0) 108 (10.5)
Other 931 255 (26.2) 371 (28.6) 305 (29.8)
Multiple answers 465
Mortality 51 675 0.60
Born alive, lived >1 y 51 585 14 206 (99.8) 20 340 (99.8) 17 039 (99.8)
Born alive, died≤1 y 90 28 (0.2) 31 (0.2) 31 (0.2)
Anthropometry Mean (SD) Mean (SD) Mean (SD) Pvalueb
Weight of placenta at birth (g) 50 115 661.5 (145.2) 677.9 (145.9) 678.3 (144.9) <0.001
Weight of infant at birth (g) 51 106 3561.5 (515.1) 3638.5 (506.4) 3605.5 (508.6) <0.001
Length of infant at birth (cm) 49 180 50.4 (2.1) 50.6 (2.0) 50.4 (2.1) <0.001
Head circ. of infant at birth (cm) 50 319 35.3 (1.5) 35.4 (1.5) 35.3 (1.5) <0.001
a
Chi squared test
b
volume expansion than the SF group [50], increasing their susceptibility to a delayed reset. Furthermore, abnormal levels of both relaxin and hCG have been im-plicated with gastrointestinal motility and gastric dys-rhythmias, which are factors suggested to contribute to NVP [1, 4, 13, 44, 51], although with an absence of bio-marker data in this study these associations are specula-tive. The hCG-relaxin dialogue hints at the complex role these hormones have in early pregnancy and future NVP research should consider both hormones when designing studies. We have been unable to find comparable studies
identifying a relationship between NVP or NP women and PGP and severe PGP as found here, hence our study raises new questions regarding this relationship, particu-larly concerning the possible link in aetiologies for the two conditions.
The outcomes in this study where NVP and NP vary in significance suggest that these conditions may have differing physiological effects upon the body during ges-tation. Vomiting in itself may affect maternal and fetal physiology by modulating stress-related and other hor-monal activity, nutrient intake, and dehydration, much
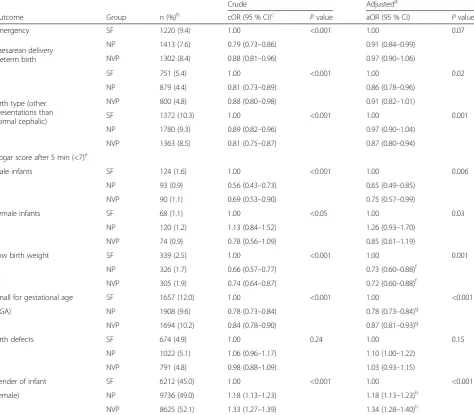
Table 5Odds ratiosaof birth outcomes in relation to group (symptom-free (SF), nausea only (NP), and nausea and vomiting (NVP))
Crude Adjustedd
Outcome Group n (%)b cOR (95 % CI)c Pvalue aOR (95 % CI) Pvalue
Emergency SF 1220 (9.4) 1.00 <0.001 1.00 0.07
Caesarean delivery Preterm birth
NP 1413 (7.6) 0.79 (0.73–0.86) 0.91 (0.84–0.99)
NVP 1302 (8.4) 0.88 (0.81–0.96) 0.97 (0.90–1.06)
SF 751 (5.4) 1.00 <0.001 1.00 0.02
NP 879 (4.4) 0.81 (0.73–0.89) 0.86 (0.78–0.96)
NVP 800 (4.8) 0.88 (0.80–0.98) 0.91 (0.82–1.01) Birth type (other
presentations than
normal cephalic) SF 1372 (10.3) 1.00 <0.001 1.00 0.001
NP 1780 (9.3) 0.89 (0.82–0.96) 0.97 (0.90–1.04)
NVP 1363 (8.5) 0.81 (0.75–0.87) 0.87 (0.80–0.94)
Apgar score after 5 min (<7)e
Male infants SF 124 (1.6) 1.00 <0.001 1.00 0.006
NP 93 (0.9) 0.56 (0.43–0.73) 0.65 (0.49–0.85)
NVP 90 (1.1) 0.69 (0.53–0.90) 0.75 (0.57–0.99)
Female infants SF 68 (1.1) 1.00 <0.05 1.00 0.03
NP 120 (1.2) 1.13 (0.84–1.52) 1.26 (0.93–1.70)
NVP 74 (0.9) 0.78 (0.56–1.09) 0.85 (0.61–1.19)
Low birth weight SF 339 (2.5) 1.00 <0.001 1.00 0.001
NP 326 (1.7) 0.66 (0.57–0.77) 0.73 (0.60–0.88)f
NVP 305 (1.9) 0.74 (0.64–0.87) 0.72 (0.60–0.88)f
Small for gestational age SF 1657 (12.0) 1.00 <0.001 1.00 <0.001
(SGA) NP 1908 (9.6) 0.78 (0.73–0.84) 0.78 (0.73–0.84)g
NVP 1694 (10.2) 0.84 (0.78–0.90) 0.87 (0.81–0.93)g
Birth defects SF 674 (4.9) 1.00 0.24 1.00 0.15
NP 1022 (5.1) 1.06 (0.96–1.17) 1.10 (1.00–1.22)
NVP 791 (4.8) 0.98 (0.88–1.09) 1.03 (0.93–1.15)
Gender of infant SF 6212 (45.0) 1.00 <0.001 1.00 <0.001
(female) NP 9736 (49.0) 1.18 (1.13–1.23) 1.18 (1.13–1.23)h
NVP 8625 (52.1) 1.33 (1.27–1.39) 1.34 (1.28–1.40)h a
OR, odds ratio, logistic regression analysis
b
Number (%) of women with outcome
c
CI, confidence interval
d
Adjusted for age, body mass index (BMI), smoking during pregnancy, parity, education, and gender
e
Significant interaction between Apgar score after 5 min (<7) and gender of infant (P= 0.001)
f
Adjusted for age, BMI, smoking during pregnancy, parity, education, gender, gestational length, and energy intake
g
Adjusted for age, BMI, smoking during pregnancy, education, and gender
h
as HG does [3, 21, 22, 49]. We found that only the NP group had significantly lower odds of developing gesta-tional diabetes. This finding is in contrast to another study [8], however, this may be due to the unspecific definitions for NP/NVP already mentioned, as well as the validity of the diagnosis from the MBRN records [34]. Although not significant, we observed a trend to-wards higher odds for birth defects in the NP group, a finding similar to that of other studies observing NP women and those only vomiting [24, 52].
All anthropometric measurements of infants were larger for the NVP or NP group than the SF group, supporting previous studies [13, 18, 19]. The lower pro-portion of SGA infants and higher propro-portion of term births for the NVP and NP groups undoubtedly contrib-utes to these outcomes and has been shown elsewhere [15, 18], yet there may well be other pathways contribut-ing to this result [3, 53].
We found the NVP and NP women had higher odds of having a female infant. This finding is supported by the numerous other studies of HG and NVP [6, 8, 17, 25, 27]. The average Norwegian male-female proportion of live births between 1999 and 2008 was 51 % male: 49 % female [54], whereas the NVP group in our study had almost the opposite. It has been suggested that gen-der of the infant may be affected by such elements as the timing of intercourse, coital rate, or the hormonal milieu at the time of conception [55]. Higher levels of estrogen, estradiol, prolactin and hCG have previously been reported in NVP and HG pregnancies, suggesting causal inference regarding gender and NVP [6, 9, 17, 26, 56], although the issue remains speculative.
Strengths and limitations
The strengths of this study are the large population-based cohort and the linkage to the MBRN, providing thorough and detailed access to pregnancy and birth
outcomes. While exploring areas related to gestation, the cohort has specifically addressed NVP-related issues, thus providing an opportunity to differentiate between NP and NVP combined. Since we have proceeded to in-vestigate the same sample featured in our previous study regarding dietary intakes and NVP [10], this study adds a comprehensive wealth of information regarding many outcomes related to the women with NVP and NP. With such a large cohort size, many significant associations tend to appear, yet the merit of these in the clinical set-ting are not always relevant. Weaknesses also include the reliance on self-reported data from MoBa question-naires, particularly for nausea and vomiting. Retrospect-ive evaluation of NVP symptoms has been reported as a possible source of bias [57]. We attempted to address this by excluding cases with inconsistencies in NVP symptoms reported between questionnaires (n= 15 791) to have as much confidence as possible in the remaining study sample. When we performed sensitivity analyses with the excluded cases included in the sample, the re-sults were mostly unaffected. Women excluded from the present study tended to have similar ages at delivery, BMI and energy intake, although there appeared to be more women with a lower education as well as a higher parity, findings consistent with non-compliance present in other studies [58–60]. The higher number of daily smokers in the excluded group is most likely a product of the high number of missing values for this variable. Furthermore, it has been presented elsewhere that al-though prevalence estimates such as smoking are under-estimated in the MoBa cohort when compared with the general Norwegian population, the exposure-outcome associations are valid [61].
Defining and categorising the difference between retching and actual vomiting (defining NP and NVP) may also have affected the results. Endocrine and other diseases may provide a differential diagnoses for hypertension,
Table 6Mean difference in birth weight, length, and head circumference for the nausea only (NP) and nausea and vomiting (NVP) groups compared to the symptom-free (SF) groupa
Crude Adjustedb
Outcome Group Mean (95 % CI) Pvalue Mean (95 % CI) Pvalue
Birth weight (g),n= 51 106 SF reference <0.001 reference <0.001
NP 76.9 (66.0–87.9) 38.4 (29.2–47.6)
NVP 43.9 (32.6–55.4) 20.9 (11.4–30.5)
Body length (cm),n= 49 180 SF reference <0.001 reference <0.001
NP 0.20 (0.16–0.25) 0.11 (0.07–0.15)
NVP 0.08 (0.03–0.12) 0.07 (0.03–0.11)
Head circumference (cm), SF reference <0.001 reference <0.001
n= 50 319 NP 0.12 (0.09–0.15) 0.06 (0.04–0.09)
NVP 0.05 (0.01–0.08) 0.03 (0.00–0.06)
a
Linear regression analysis
b
proteinuria, preeclampsia, gestational diabetes and even nausea and vomiting during pregnancy, however, their oc-currence in such a large sample would have negligible ef-fects on the results owing to their low prevalence [4, 62].
Conclusions
We found that women with NVP and NP collectively had higher odds for pelvic girdle pain, severe pelvic gir-dle pain, high blood pressure before and during preg-nancy, proteinuria, and preeclampsia than the SF group. The NP group had reduced odds of gestational diabetes with no prior history. The NVP and NP groups collect-ively had a higher proportion of term births, and lower odds for an emergency caesarean delivery, birth type other than normal cephalic, preterm birth, low Apgar score after 5 min, low birth weight and SGA infants than the SF group. The NVP and NP groups also had higher odds of giving birth to a female infant.
To our knowledge, this is the first study finding a rela-tionship between NVP or NP and PGP or severe PGP. Importantly, the higher odds for pregnancy complica-tions during gestation for the NVP and NP women are counterbalanced by reduced odds for unfavourable deliv-ery and birth outcomes.
Additional file
Additional file 1: Table S1.Interaction effects observed in the linear regression analyses of birth outcomes for the nausea only (NP) and nausea and vomiting (NVP) groups compared to the symptom-free (SF) group.
Abbreviations
aOR:Adjusted odds ratio; BMI: Body mass index; CI: Confidence interval; cOR: Crude odds ratio; hCG: Human chorionic gonadotropin; HG: Hyperemesis gravidarum; MBRN: Medical birth registry of Norway; mmHG: Millimetre of mercury; MoBa: The Norwegian Mother and Child Cohort Study; NP: Nausea only; NVP: Nausea and vomiting in pregnancy; PGP: Pelvic girdle pain; Q1-4: Questionnaire number; SD: Standard deviations; SF: Symptom-free; SGA: Small for gestational age.
Competing interests
The authors declare that they have no competing interests.
Authors’contributions
AC, MH, POI, PM, and MBV designed the project; AC performed statistical analyses, drafted the manuscript and was responsible for the manuscript revisions; MH and MBV contributed to the statistical analyses; MH, POI, ÅV, MEG, EKB, PM, and MBV contributed to the interpretation of the data, results, and writing of the manuscript. All authors critically revised the manuscript and approved the final version.
Acknowledgements
We are grateful to all of the women and their families for participating in this on-going cohort study.
Author details 1
Oslo Centre for Biostatistics and Epidemiology, Institute of Basic Medical Sciences, University of Oslo, PO Box 1122, Blindern N-0317 Oslo, Norway. 2
Department of Nutrition, Institute of Basic Medical Sciences, University of Oslo, PO Box 1046, Blindern N-0317 Oslo, Norway.3Division of Environmental Medicine, Norwegian Institute of Public Health, PO Box 4404, Nydalen N-0403 Oslo, Norway.4Department of Hematology, Oslo University Hospital,
PO Box 4950, Nydalen N-0424 Oslo, Norway.5Division of Epidemiology, Norwegian Institute of Public Health, PO Box 4404, Nydalen N-0403 Oslo, Norway.6Department of Psychosomatics and Health Behaviour, Norwegian Institute of Public Health, PO Box 4404, Nydalen N-0403 Oslo, Norway. 7Health Services Research Unit, Akershus University Hospital, PO Box 1000N-1478 Lørenskog, Norway.
Received: 19 January 2015 Accepted: 17 June 2015
References
1. Järnfelt-Samsioe A, Samsioe G, Velinder GM. Nausea and vomiting in pregnancy–a contribution to its epidemiology. Gynecol Obstet Invest. 1983;16:221–9.
2. Gadsby R, Barnie-Adshead AM, Jagger C. A prospective study of nausea and vomiting during pregnancy. Br J Gen Pract. 1993;43:245–8.
3. Huxley RR. Nausea and vomiting in early pregnancy: its role in placental development. Obstet Gynecol. 2000;95:779–82.
4. Koch KL, Frissora CL. Nausea and vomiting during pregnancy. Gastroenterol Clin North Am. 2003;32:201–34.
5. Klebanoff MA, Koslowe PA, Kaslow R, Rhoads GG. Epidemiology of vomiting in early pregnancy. Obstet Gynecol. 1985;66:612–6.
6. Veenendaal MV, van Abeelen AF, Painter RC, van der Post JA, Roseboom TJ. Consequences of hyperemesis gravidarum for offspring: a systematic review and metaanalysis. BJOG. 2011;118:1302–13.
7. Weigel MM, Reyes M, Caiza ME, Tello N, Castro NP, Cespedes S, Duchicela S, Betancourt M. Is the nausea and vomiting of early pregnancy really feto-protective? J Perinat Med. 2006;34:115–22.
8. Temming L, Franco A, Istwan N, Rhea D, Desch C, Stanziano G, Joy S. Adverse pregnancy outcomes in women with nausea and vomiting of pregnancy. J Matern Fetal Neonatal Med. 2014;27:84–8.
9. Zhou Q, O’brien B, Relyea J. Severity of nausea and vomiting during pregnancy: what does it predict? Birth. 1999;26:108–14.
10. Chortatos A, Haugen M, Iversen P, Vikanes Å, Magnus P, Veierød MB. Nausea and vomiting in pregnancy: associations with maternal gestational diet and lifestyle factors in the Norwegian Mother and Child Cohort Study. BJOG. 2013;120:1642–53.
11. Chin R. Antenatal complications and perinatal outcome in patients with nausea and vomiting-complicated pregnancy. Eur J Obstet Gynecol Reprod Biol. 1989;33:215–9.
12. Zhang J, Cai WW. Severe vomiting during pregnancy: antenatal correlates and fetal outcomes. Epidemiology. 1991;2:454–7.
13. Brandes JM. First-trimester nausea and vomiting as related to outcome of pregnancy. Obstet Gynecol. 1967;30:427–31.
14. Ananth CV, Rao PS. Epidemiology of nausea and vomiting of pregnancy and its relation to fetal outcome in a rural area. J Trop Pediatr. 1993;39:313. 15. Czeizel AE, Puhó E. Association between severe nausea and vomiting in
pregnancy and lower rate of preterm births. Paediatr Perinat Epidemiol. 2004;18:253–9.
16. Weigel M, Weigel RM. Nausea and vomiting of early pregnancy and pregnancy outcome. An epidemiological study. BJOG. 1989;96:1304–11. 17. Naumann CR, Zelig C, Napolitano PG, Ko CW. Nausea, vomiting, and
heartburn in pregnancy: a prospective look at risk, treatment, and outcome. J Matern Fetal Neonatal Med. 2012;25:1488–93.
18. Tierson FD, Olsen CL, Hook EB. Nausea and vomiting of pregnancy and association with pregnancy outcome. Am J Obstet Gynecol. 1986;155:1017–22. 19. Little RE. Maternal alcohol and tobacco use and nausea and vomiting
during pregnancy: relation to infant birthweight. Acta Obstet Gynecol Scand. 1980;59:495–7.
20. Bailit JL. Hyperemesis gravidarium: epidemiologic findings from a large cohort. Am J Obstet Gynecol. 2005;193:811–4.
21. Lee JI, Lee JA, Lim HS. Morning sickness reduces dietary diversity, nutrient intakes, and infant outcome of pregnant women. Nutr Res. 2004;24:531–40. 22. Järnfelt-Samsioe A, Eriksson B, Waldenström J, Samsioe G. Some new
aspects on emesis gravidarum. Gynecol Obstet Invest. 1985;19:174–86. 23. Boskovic R, Rudic N, Danieliewska-Nikiel B, Navioz Y, Koren G. Is lack of
morning sickness teratogenic? A prospective controlled study. Birth Defects Res A Clin Mol Teratol. 2004;70:528–30.
24. Petitti DB. Nausea and pregnancy outcome. Birth. 1986;13:223–6. 25. Källén B. Hyperemesis during pregnancy and delivery outcome: a registry
26. Depue RH, Bernstein L, Ross RK, Judd HL, Henderson BE. Hyperemesis gravidarum in relation to estradiol levels, pregnancy outcome, and other maternal factors: a seroepidemiologic study. Am J Obstet Gynecol. 1987;156:1137–41.
27. Askling J, Erlandsson G, Kaijser M, Akre O, Ekbom A. Sickness in pregnancy and sex of child. Lancet. 1999;354:2053.
28. Tezerjani FZ, Sekhavat L. Relationship between fetal sex and nausea and vomiting of pregnancy. World Appl Sci J. 2013;28:1024–6.
29. Magnus P, Irgens LM, Haug K, Nystad W, Skjærven R, Stoltenberg C. Cohort profile: the Norwegian mother and child cohort study (MoBa). Int J Epidemiol. 2006;35:1146–50.
30. Irgens LM. The Medical Birth Registry of Norway. Epidemiological research and surveillance throughout 30 years. Acta Obstet Gynecol Scand. 2000;79:435–9.
31. Brandhagen M, Lissner L, Brantsaeter AL, Meltzer HM, Häggkvist AP, Haugen M, Winkvist A. Breast-feeding in relation to weight retention up to 36 months postpartum in the Norwegian Mother and Child Cohort Study: modification by socio-economic status? Public Health Nutr. 2014;17:1514–23.
32. Norwegian Institute of Public Health. The Norwegian Mother and Child cohort study (MoBa). Questionnaire 2 current 1 May 2012
[www.fhi.no/dokumenter/011fbd699d.pdf]. Accessed 23 Jan 2014. 33. Engeland A, Bjorge T, Daltveit AK, Skurtveit S, Vangen S, Vollset SE, Furu K.
Risk of diabetes after gestational diabetes and preeclampsia. A registry-based study of 230,000 women in Norway. Eur J Epidemiol. 2011;26:157–63. 34. Stene LC, Eidem I, Vangen S, Joner G, Irgens LM, Moe N. The validity of the
diabetes mellitus diagnosis in the Medical Birth Registry of Norway. Nor Epidemiol. 2007;17:165–74.
35. Norwegian Institue of Public Health: Definisjonsrapporter for variabler i Medisinsk fødselsregister (in Norwegian). English: Definition report for variables in the Medical Birth Registry of Norway [http://www.fhi.no/ dokumenter/8105c63e8e.pdf]. Accessed 16 Jan 2014.
36. World Health Organization: International statistical classification of disease and related health problems, 10th revision. [http://www.who.int/ classifications/icd10/browse/2010/en#/XVII]. Accessed 16 Jan 2014. 37. Mustafa R, Ahmed S, Gupta A, Venuto RC. A comprehensive review of
hypertension in pregnancy. J Pregnancy. 2012;2012:1–19.
38. Luo ZC, Simonet F, An N, Bao FY, Audibert F, Fraser WD. Effect on neonatal outcomes in gestational hypertension in twin compared with singleton pregnancies. Obstet Gynecol. 2006;108:1138–44.
39. Bolin M, Akerud H, Cnattingius S, Stephansson O, Wikstrom AK. Hyperemesis gravidarum and risks of placental dysfunction disorders: a population-based cohort study. BJOG. 2013;120:541–7.
40. Muller F, Savey L, Le Fiblec B, Bussières L, Ndayizamba G, Colau JC, Giraudet P. Maternal serum human chorionic gonadotropin level at fifteen weeks is a predictor for preeclampsia. Am J Obstet Gynecol. 1996;175:37–40. 41. Canini S, Prefumo F, Pastorino D, Crocetti L, Afflitto CG, Venturini PL, De
Biasio P. Association between birth weight and first-trimester freeβ–human chorionic gonadotropin and pregnancy-associated plasma protein A. Fertil Steril. 2008;89:174–8.
42. Bathgate RA, Halls ML, van der Westhuizen ET, Callander GE, Kocan M, Summers RJ. Relaxin family peptides and their receptors. Physiol Rev. 2013;93:405–80.
43. Goodwin TM, Hershman JM, Cole L. Increased concentration of the free β-subunit of human chorionic gonadotropin in hyperemesis gravidarum. Acta Obstet Gynecol Scand. 1994;73:770–2.
44. Seow KM, Lee JL, Doong ML, Huang SW, Hwang JL, Huang WJ, Chang FY, Ho LT, Juan CC. Human chorionic gonadotropin regulates gastric emptying in ovariectomized rats. J Endocrinol. 2013;216:307–14.
45. Sasser JM, Molnar M, Baylis C. Relaxin ameliorates hypertension and increases nitric oxide metabolite excretion in angiotensin II but not Nω-nitro-L-arginine methyl ester hypertensive rats. Hypertension. 2011;58:197–204.
46. Aldabe D, Ribeiro DC, Milosavljevic S, Bussey MD. Pregnancy-related pelvic girdle pain and its relationship with relaxin levels during pregnancy: a systematic review. Eur Spine J. 2012;21:1769–76.
47. Kristiansson P, Svärdsudd K, von Schoultz B. Serum relaxin, symphyseal pain, and back pain during pregnancy. Am J Obstet Gynecol. 1996;175:1342–7. 48. McKinley M, Cairns M, Denton D, Egan G, Mathai M, Uschakov A, Wade JD,
Weisinger RS, Oldfield BJ. Physiological and pathophysiological influences on thirst. Physiol Behav. 2004;81:795–803.
49. Haugen M, Vikanes Å, Brantsæter AL, Meltzer HM, Grjibovski AM, Magnus P. Diet before pregnancy and the risk of hyperemesis gravidarum. B J Nutr. 2011;106:596–602.
50. Theunissen IM, Parer JT. Fluid and electrolytes in pregnancy. Clin Obstet Gynecol. 1994;37:3–15.
51. Baccari MC, Squecco R, Garella R. Relaxin and gastrointestinal motility. Ital J Anat Embryol. 2013;118:80–1.
52. Klebanoff MA, Mills JL. Is vomiting during pregnancy teratogenic? Br Med J (Clin Res Ed). 1986;292:724–6.
53. Lunney L. Compensatory placental growth after restricted maternal nutrition in early pregnancy. Placenta. 1998;19:105–11.
54. My Page StatBank Norway, Statistics Norway 2014. [http://www.ssb.no/en/ table/09745]. Accessed 12 Feb 2014.
55. James WH. Further evidence that mammalian sex ratios at birth are partially controlled by parental hormone levels around the time of conception. Human Reprod. 2004;19:1250–6.
56. Lagiou P. Nausea and vomiting in pregnancy in relation to prolactin, estrogens, and progesterone: a prospective study. Obstet Gynecol. 2003;101:639–44.
57. Koren G, Maltepe C, Navioz Y, Wolpin J. Recall bias of the symptoms of nausea and vomiting of pregnancy. Am J Obstet Gynecol. 2004;190:485–8. 58. Stacey T, Thompson JM, Mitchell EA, Ekeroma AJ, Zuccollo JM, McCowan
LM. The Auckland Stillbirth study, a case–control study exploring modifiable risk factors for third trimester stillbirth: methods and rationale. Aust N Z J Obstet Gynaecol. 2011;51:3–8.
59. Tough SC, Siever JE, Benzies K, Leew S, Johnston DW. Maternal well-being and its association to risk of developmental problems in children at school entry. BMC Pediatr. 2010;10:19.
60. Galea S, Tracy M. Participation rates in epidemiologic studies. Ann Epidemiol. 2007;17:643–53.
61. Nilsen RM, Vollset SE, Gjessing HK, Skjaerven R, Melve KK, Schreuder P, Alsaker ER, Haug K, Daltveit AK, Magnus P. Self-selection and bias in a large prospective pregnancy cohort in Norway. Paediatr Perinat Epidemiol. 2009;23:597–608.
62. Frise CJ, Williamson C. Endocrine disease in pregnancy. Clin Med. 2013;13:176–81.
Submit your next manuscript to BioMed Central and take full advantage of:
• Convenient online submission
• Thorough peer review
• No space constraints or color figure charges
• Immediate publication on acceptance
• Inclusion in PubMed, CAS, Scopus and Google Scholar
• Research which is freely available for redistribution