R E S E A R C H
Open Access
ProfileGrids: a sequence alignment visualization
paradigm that avoids the limitations of Sequence
Logos
Alberto I Roca
From
3rd IEEE Symposium on Biological Data Visualization
Atlanta, GA, USA. 13-14 October 2013
Abstract
Background:The 2013 BioVis Contest provided an opportunity to evaluate different paradigms for visualizing protein multiple sequence alignments. Such data sets are becoming extremely large and thus taxing current visualization paradigms. Sequence Logos represent consensus sequences but have limitations for protein alignments. As an alternative, ProfileGrids are a new protein sequence alignment visualization paradigm that represents an alignment as a color-coded matrix of the residue frequency occurring at every homologous position in the aligned protein family.
Results:The JProfileGrid software program was used to analyze the BioVis contest data sets to generate figures for comparison with the Sequence Logo reference images.
Conclusions:The ProfileGrid representation allows for the clear and effective analysis of protein multiple sequence alignments. This includes both a general overview of the conservation and diversity sequence patterns as well as the interactive ability to query the details of the protein residue distributions in the alignment. The JProfileGrid software is free and available from www.ProfileGrid.org.
Background
Molecular biologists can learn about a protein’s struc-ture and function by studying the natural sequence var-iation resulting from a protein family’s evolution [1]. A multiple sequence alignment (MSA) is crucial for such bioinformatic analysis to relate homologous residues to one another as pioneered by early molecular evolution studies (for example [2]). Software tools are now avail-able to align very large data sets consisting of 100,000+ sequences [3]. However, there is a lack of programs that allow users to visualize and to interact with very large MSAs [4]. Existing MSA visualization tools [5] continue to use a simple stacked sequence alignment visualization paradigm representing all individual sequences as rows in a table and homologous residue positions as columns. This “row-column”paradigm was sufficient decades ago when alignments were small; but, the stacked sequence
representation is now inadequate for the amount of data being used today.
Sequence Logos were introduced in 1990 as a new visua-lization paradigm to represent the MSA consensus residues enabling easy observation of conservation patterns in MSAs [6]. A hallmark of this paradigm is that a residue’s frequency in the MSA column is depicted visually by the height of the residue single-letter symbol with all residues from the same column then stacked upon each other. These features are shared by subsequent derivatives of the Sequence Logo paradigm (Table 1). Modifications to the paradigm include different algorithms for determining symbol height [7-16], visualizing conservation within MSA subpopulations [17,18], replacing the symbols with one-dimensional [19] or three-one-dimensional [20] bars, comparing differences between two MSAs [11], identifying infrequent residues [15,21], handling specialized contexts (such as for RNA [7,22,23], structural elements [24], or codons [25]), and implementing online web servers [26].
Correspondence: [email protected]
ProfileGrid.org, P.O. Box 6414, Irvine, California 92616, USA
Despite their widespread use, though, Sequence Logos have their limitations. While Logos are suitable for nucleic acids with only four residue symbols legible at even small sizes, there are problems when representing 20 residues of protein sequences. Variable regions of a protein alignment and positions with rare residues are not legible in Logos since the symbol size is small when scaled relative to the conserved positions. This has been described as a“totally incomprehensible jumble of letters.”[14] However, even for conserved residues, the stacking of the symbols can lead to confusion. For example, Schneider pointed out that an“F”on top of an“L”could be mistaken for a long
“E.”[6] Logos do not display any information about resi-dues missing from alignment columns and also lack a representation for gap symbols. Notably, Logos suffer from aesthetic challenges when two visualization channel types [27] are combined: symbol/stack height versus sym-bol color. Interpreting the tall/short stacked letter columns can be complicated by the color schemes used to distin-guish different amino acid residue classes (such as the pro-minent red coloring of acidic protein residues). Finally, a recent user study evaluated the effectiveness of Sequence Logos for comparing motifs [28]. The authors identified these problems: difficulty in judging the height of stacked symbols, no standardization for symbol color schemes, and a lack of interactivity for most current software tools.
The challenge in the visualization of large sequence alignments is in identifying a paradigm that summarizes
the overall conservation trends while still providing easy navigation to detailed views of the underlying data [4]. ProfileGrids as a MSA visualization paradigm were invented in 2005 for the analysis of the bacterial RecA protein family. MSA analysis had become impractical using the standard stacked sequence representation since a curated alignment had grown to several hundred homologs [29]. A ProfileGrid reduces an alignment to a matrix, color-shaded according to the residue frequency in the MSA [30]. The JProfileGrid Java program was upgraded to version 2.0 [31] with new software features as well as improvements to the aesthetics in the visuali-zation paradigm after receiving feedback from the VIZBI.org community [27]. The ProfileGrid paradigm has two simple but significant differences that avoid Sequence Logos limitations: 1) all residue symbols are the same height since the matrix row sizes are fixed; 2) color shading of the cells is used to represent the fre-quency distribution of the residues in the sequence data. Thus, the overall conservation trends can be seen from the “heat map.” The JProfileGrid software tool is an interactive MSA viewer taking advantage of the matrix representation of alignments.
The 2013 BioVis conference Redesign Contest pro-vided an opportunity to demonstrate the usefulness of the ProfileGrid paradigm by visualizing the adenylate kinase lid (AKL) protein family alignments [32]. Here, I report the final figures generated by the JProfileGrid software and the unique observations made possible by ProfileGrid analysis.
Methods
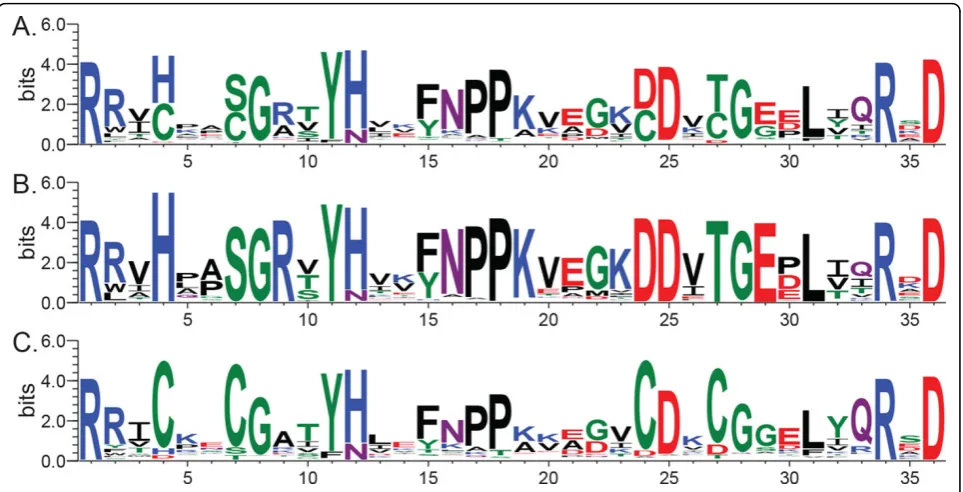
The protein sequence alignment data sets were provided by the 2013 BioVis Redesign Contest organizers. The Sequence Logos (Figure 1) were generated using the WebLogo server [26] and replicate the original BioVis contest figure to be “redesigned.” Two versions of the JProfileGrid software, 1.22 [30] and 2.0.5 [31], have been described in previous publications. The latter version was used for this study and is available under a GNU General Public License at www.ProfileGrid.org.
Results
ProfileGrids clearly visualize protein residue distributions The 2013 BioVis Redesign Contest description“ recog-nizes the importance of effective encodings and clear visual communication in display of complex quantitative information”and“gives participants the opportunity to develop a practical replacement to the long-standing convention of sequence logos” [32] as exemplified by the AKL domain Sequence Logos (Figure 1). Profile-Grids are a practical and effective replacement for Sequence Logos when analyzing protein alignments. Furthermore, the mature JProfileGrid MSA software
Table 1 Sequence Logo Derivatives
Name Year Reference
viewer has a rich graphical user interface allowing a molecular biologist to analyze their protein family of interest [30].
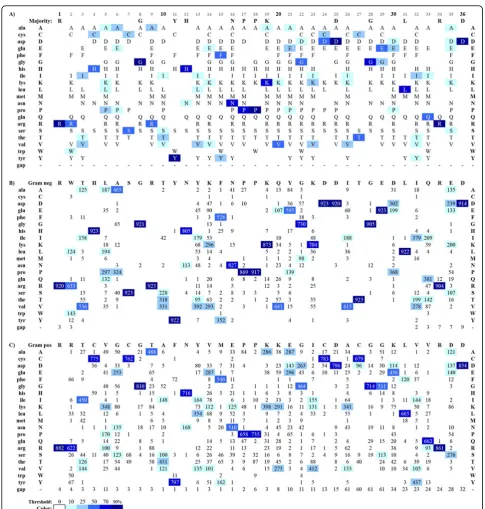
The AKL domain sequence alignments were imported into JProfileGrid for visualization and analysis to deter-mine the user settings for the final figures. Two visuali-zations were designed to demonstrate the ProfileGrid paradigm’s capabilities as well as to represent observa-tions from the AKL domain MSAs. The entire align-ment of 1,809 sequences is shown in Figure 2A with the default JProfileGrid settings where the 20 protein resi-due rows are sorted alphabetically (with one additional gap symbol row). The frequency of the residues in each alignment is represented by color shades according to a blue ramp from low (white) to high (dark blue) conser-vation across the 36 residue width (columns) of the AKL sequences. The lower panels show the subpopula-tions for the 923 sequences from Gram negative bacteria (Figure 2B) and the 886 sequences from Gram positive bacteria (Figure 2C). The latter two panels show a single representative reference sequence at the top of the Pro-fileGrid for each respective subpopulation.
Overall trends of sequence conservation and variability are quite clear from the ProfileGrids and the user can choose whether to show the details of the residue frequen-cies (values in panel Figures 2B and 2C) or to show just the residues observed (Figure 2A) at that MSA position,i.
e. each column. Note that the ProfileGrid in Figure 2A can be directly related to the Sequence Logo (Figure 1A)
where the residues shown are stacked upon one another in each column; and, the symbol height reflects the con-servation of each residue. The ProfileGrid, however, allows each symbol to be legible which is critical for interpreting a variable column such as position 14. The ProfileGrid allows the entire protein mutation distribution to be assessed. Similarly, rare residues are obvious such as at position 8 (Figure 2B) where the Redesign Contest instruc-tions incorrectly stated that“glycine is absolutely con-served in the Gram-negatives.”[33] In fact, 2 sequences have asparagine at that position (Theileria parvastrain Muguga [GenBank:XP_766154.1 http://www.ncbi.nlm.nih. gov/protein/71033025] andTheileria annulata[Genbank: XP_954152.1 http://www.ncbi.nlm.nih.gov/protein/ XP_954152.1]). Such rare observations would be impossi-ble to identify from the Sequence Logo paradigm (Figure 1B) or its derivatives (the exception being InverseLogos depending upon user settings [21]). An AKL protein expert can now interpret whether the Gram negative homologs containing 8-asn are interesting natural sequence variation exceptions sharing a residue with 18 Gram positive homologs (Figure 2C) or are just sequence errors resulting from experimental problems during data collection [30]). The interactive JProfileGrid user interface made it trivial to identify the two asparagine-containing sequences since the user can select any cell in the Profile-Grid window and then perform a query of the MSA. Thus, the ProfileGrid paradigm enables the MSA to be treated as a searchable database of sequence records.
ProfileGrids can effectively visualize alignment differences The 2013 BioVis Redesign Contest challenged applicants to help the AKL biologists understand the differences between the Gram negative (Figure 1B) and Gram positive
(Figure 1C) sequences by creating alternatives to the Sequence Logo representation. Visualizing the protein sequence differences between the two subpopulations would presumably allow the biologists to propose structure
and function hypotheses about the AKL protein activities. The original figure designed by the AKL biologists is of three stacked Sequence Logos (Figure 1). Drawing compari-sons between protein Sequence Logos is very difficult espe-cially since there is no visual encoding for differences (although attempts have been made to introduce such a fea-ture [11,17,18]). In particular, a user will be frustrated per-forming mental comparisons on adjacent Sequence Logos such as when comparing the Gram negative (Figure 1B) and Gram positive (Figure 1C) sequences. Such challenges were documented in a recent Sequence Logo user study [28]. By contrast, the interactive JProfileGrid software is especially suited for comparing sequences populations to one another.
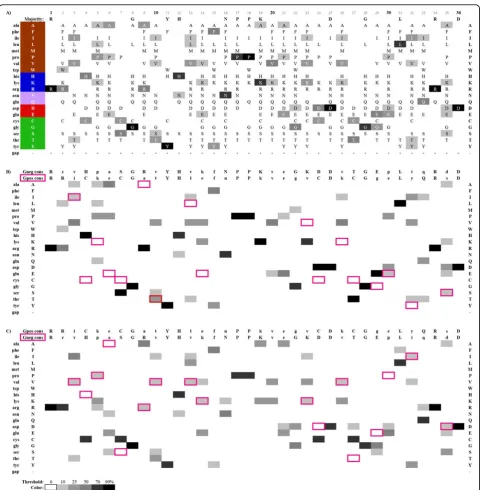
ProfileGrids can effectively highlight differences between the AKL data sets (Figure 3). For this purpose, we calcu-lated a consensus sequence for each subpopulation and list them both at the top of each subpopulation ProfileGrid (Figure 3B & 3C) where the first row is the“reference”and the second row is the“highlight”sequence to be com-pared. For each column, if the highlight sequence differs from the reference, then the residue cell is marked with a pink border automatically generated by the JProfileGrid software [30]. Viewing the“highlight boxes”within the context of the entire reference subpopulation alignment clearly shows the differences between the Gram negatives (Figure 3B) and Gram positives (Figure 3C) since the high-light consensus acts as a proxy for its entire alignment. For the sake of visual clarity, the residue frequency shading is grayscale (instead of the default blue ramp) and the values are not shown in the cells.
The ProfileGrid paradigm can allow color coding to visually represent amino acid classes as used in Sequence Logos. However, in this case the coloring is minimized to provide just enough information rather than dominate the figure and confuse the user. Figure 3A shows a color scheme to represent hydrophobic (brown), basic (blue), nitrogen-containing (lavender), acidic (red), and other (green) residues. Note that brown is used instead of black (as in the default AKL Sequence Logo coloring of Figure 1) to avoid visually clashing with the frequency grayscale encoding. Thus, as a reader scans across the ProfileGrid, the row position will encode the amino acid class in a man-ner complementary to the frequency information.
The ProfileGrid highlight (pink cell border) feature takes advantage of“visual popout”[27] to allow the user to make observations. AKL alignment position 9 is a good case study to examine differences between the Gram nega-tive and Gram posinega-tive subpopulations. In Figure 3B argi-nine (positively charged coded“blue,”middle rows as per Figure 3A) is very well conserved (black cell; row 13, col-umn labelled“9”) in Gram negatives. However, an alanine (Figure 3B; pink borders; row 3, column labelled“9”) is found in Gram positives and this residue is small and
hydrophobic (brown, top rows). Intriguingly, examination of the Gram positive sequences (Figure 3C) shows that there are at least two predominant subpopulations observed (see Figure 2C for the complete residue distribu-tion at posidistribu-tion 9): the aforemendistribu-tioned alanine (gray box; row 3, column 9) but also the arginine (gray box with pink borders; row 13, column 9) shared with the Gram nega-tives. Perhaps the AKL experts can determine if there is any biological significance to these qualitative observa-tions; but, this shows that the ProfileGrid paradigm allows these observations to be made at all.
JProfileGrid program features
The interactive JProfileGrid program viewer has features designed for the biologist user [30,31]. In software version 2.0, a new“overview”mode allows the visualization of the entire MSA within one window as either a ProfileGrid or as stacked sequences. Individual ProfileGrid cells can be selected to extract sequence subsets of interest during a visualization dissection. Sorting the residue rows by physi-cal/chemical properties such as flexibility, helix propensity, hydropathy, and volume allow qualitative structural analyses to be performed. The detailed ProfileGrid window with the symbol counts, has a new second pane to view different parts of the MSA at the same time. The“highlight”feature can identify residues that occur greater or less than a user-defined threshold of residue frequency. Large alignments can be separated into subsets of interest by using metadata filtering once JProfileGrid imports simple sequence annota-tions from flat file spreadsheet databases. The interactive features of the JProfileGrid program can be more easily appreciated by a live walk-through as demonstrated by my 2013 BioVis Data Contest movie submission [34].
in most consensus paradigms. The interactive JProfile-Grid viewer allows the user to retain access to the sequence data for a robust protein family analysis.
Finally, we comment on the Redesign Contest appli-cants. Most of the submissions were derivatives of Sequence Logos and so would have the same aforemen-tioned limitations. Interestingly, the two entries that received Honorable Mentions [35,36] have replaced the Sequence Logo representation with a different visualiza-tion paradigm that one entrant named“Sequence Bun-dles.”We note that by representing the MSA as a matrix with residue symbols as rows and the alignment positions as columns, they are handling the underlying data as a profile for bioinformatic sequence similarity searches [37] using command-line programs with no graphical user interfaces. The 2008 ProfileGrid publication, to the best of my knowledge, is the first demonstration of profiles as a visual paradigm for analyzing MSAs. How Sequence Bundles differ significantly from ProfileGrids is in the former’s use of lines to connect matrix cells along the path of an individual protein sequence. More sequences occurring in an alignment result in lines stacking on the matrix visualization allowing consensus sequences to emerge as a thick bundle.
While the Sequence Bundle connecting lines are aesthe-tically interesting, they are also a liability since as the MSAs get very large, the visualization will become more cluttered. In my opinion, what is relevant to the biologist user within the context of an MSA is the frequency of the residues in the visualization. After an observation has been made, then the user will dig deeper to identify the particu-lar sequences of interest. The interactive JProfileGrid pro-gram was designed for such a task. Individual sequences are shown alongside the top row of the ProfileGrid by choosing the desired reference and highlight sequences from JProfileGrid menus. Selecting individual ProfileGrid cells allow a separate JProfileGrid window to display the subset of the sequences containing that residue in the MSA. There is no need for connecting lines to be layered on top of the matrix as in Sequence Bundles.
Conclusions
While Sequence Logos have their merits for visualizing short conserved motifs especially in nucleic acid sequences, this paradigm has limitations when repre-senting protein alignments. The ProfileGrid paradigm replaces Sequence Logos and solves the challenge of visualizing large protein alignments. Thus, ProfileGrids allow a molecular biologist to clearly and effectively ana-lyze protein structure and function.
List of abbreviations used
AKL: adenylate kinase lid MSA: multiple sequence alignment
Competing interests
The author declares that they have no competing interests.
Authors’contributions
AIR conceived of the study, conducted the analyses, and authored the manuscript.
Acknowledgements
This study was self-financed by AIR. I gratefully acknowledge the dataset provided by Drs. Magliery and Sullivan at The Ohio State University for the purposes of the BioVis 2013 Contest. I also thank the 2013 BioVis contest organizers especially William Ray, Ph.D., of The Ohio State University.
Declarations
Publication of this work was self-financed by AIR.
This article has been published as part ofBMC ProceedingsVolume 8 Supplement 2, 2014: Proceedings of the 3rd Annual Symposium on Biological Data Visualization: Data Analysis and Redesign Contests. The full contents of the supplement are available online at http://www. biomedcentral.com/bmcproc/supplements/8/S2
Published: 28 August 2014
References
1. Higgins RF:Of URFs and ORFs: A Primer on How to Analyze Derived Amino Acid SequencesUniversity Science Books; 1986.
2. Fitch WM:An improved method of testing for evolutionary homology.
J Mol Biol.1966,16:9-16.
3. Sievers F, Wilm A, Dineen D, Gibson TJ, Karplus K, Li W, Lopez R, McWilliam H, Remmert M, Soding J, Thompson JD, Higgins DG:Fast, scalable generation of high-quality protein multiple sequence alignments using Clustal Omega.Molecular Systems Biology2011,7:539. 4. Procter JB, Thompson J, Letunic I, Creevey C, Jossinet F, Barton GJ:
Visualization of multiple alignments, phylogenies and gene family evolution.Nature Methods2010,7:S16-25.
5. List of alignment visualization software.[http://en.wikipedia.org/wiki/ List_of_alignment_visualization_software].
6. Schneider TD, Stephens RM:Sequence logos: a new way to display consensus sequences.Nucleic Acids Research1990,18:6097-6100. 7. Gorodkin J, Heyer LJ, Brunak S, Stormo GD:Displaying the information
contents of structural RNA alignments: the structure logos.Comput Appl Biosci1997,13:583-6.
8. Schuster-Böckler B, Schultz J, Rahmann S:HMM Logos for visualization of protein families.BMC Bioinformatics2004,5:7.
9. Fujii K, Zhu G, Liu Y, Hallam J, Chen L, Herrero J, Shaw S:Kinase peptide specificity: improved determination and relevance to protein phosphorylation.Proc Natl Acad Sci USA2004,101:13744-13749. 10. Workman CT, Yin Y, Corcoran DL, Ideker T, Stormo GD, Benos PV:
enoLOGOS: a versatile web tool for energy normalized sequence logos.
Nucleic Acids Res2005,33:W389-92.
11. Vacic V, Iakoucheva LM, Radivojac P:Two Sample Logo: a graphical representation of the differences between two sets of sequence alignments.Bioinformatics2006,22:1536-7.
12. Li W, Yang B, Liang S, Wang Y, Whiteley C, Cao Y, Wang X:BLogo: a tool for visualization of bias in biological sequences.Bioinformatics2008,24:2254-5. 13. Colaert N, Helsens K, Martens L, Vandekerckhove J, Gevaert K:Improved
visualization of protein consensus sequences by iceLogo.Nat Methods2009, 6:786-7.
14. Leipzig J:Making a better sequence logo.[http://chopcbmi.org/2011/11/ 10/making-a-better-sequence-logo/].
15. Thomsen MC, Nielsen M:Seq2Logo: a method for construction and visualization of amino acid binding motifs and sequence profiles including sequence weighting, pseudo counts and two-sided
representation of amino acid enrichment and depletion.Nucleic Acids Res
2012,40:W281-7.
16. O’Shea JP, Chou MF, Quader SA, Ryan JK, Church GM, Schwartz D:pLogo: a probabilistic approach to visualizing sequence motifs.Nat Methods2013, 10:1211-2.
17. Beitz E:Subfamily logos: visualization of sequence deviations at alignment positions with high information content.BMC Bioinformatics
18. Shih AC, Lee DT, Peng CL, Wu YW:Phylo-mLogo: an interactive and hierarchical multiple-logo visualization tool for alignment of many sequences.BMC Bioinformatics2007,8:63.
19. Pérez-Bercoff A, Koch J, Bürglin TR:LogoBar: bar graph visualization of protein logos with gaps.Bioinformatics2006,22:112-4.
20. Bindewald E, Schneider TD, Shapiro BA:CorreLogo: an online server for 3D sequence logos of RNA and DNA alignments.Nucleic Acids Res2006, 34:W405-11.
21. Freyhult E, Moulton V, Ardell DH:Visualizing bacterial tRNA identity determinants and antideterminants using function logos and inverse function logos.Nucleic Acids Res2006,34:905-16.
22. Chang TH, Horng JT, Huang HD:RNALogo: a new approach to display structural RNA alignment.Nucleic Acids Res2008, ,36:W91-6. 23. Menzel P, Seemann SE, Gorodkin J:RILogo: visualizing RNA-RNA
interactions.Bioinformatics2012,28:2523-6.
24. Karwath A, Kersting K:Relational Sequence Alignments and Logos.In
Inductive Logic Programming.Springer; Muggleton S, Otero R, Tamaddoni-Nezhad A 2007:290-304, [Hutchison D (Series Editor) Lecture Notes in Computer Science, vol 4455.].
25. Sharma V, Murphy DP, Provan G, Baranov PV:CodonLogo: a sequence logo-based viewer for codon patterns.Bioinformatics2012,28:1935-6. 26. Crooks GE, Hon G, Chandonia JM, Brenner SE:WebLogo: a sequence logo
generator.Genome Res2004, ,14:1188-90.
27. Munzner T:Visualization.InFundamentals of Computer Graphics.AK Peters; Peter Shirley and Steve Marschner 2009:675-707.
28. Lee NK, Oon Y:Potential perils of biological sequence visualization using Sequence Logo.InComputer Graphics, Imaging and Visualization (CGIV) International Conference 6-8 August 2013.IEEE; Macau. Banissi E, Sarfraz M 2013:106-111.
29. Roca AI, Cox MM:RecA protein: structure, function, and role in recombinational DNA repair.Progress in Nucleic Acid Research and Molecular Biology1997,56:129-223 [http://www.sciencedirect.com/science/ article/pii/S0079660308610053].
30. Roca AI, Almada AE, Abajian AC:ProfileGrids as a new visual representation of large multiple sequence alignments: a case study of the RecA protein family.BMC Bioinformatics2008,9:554.
31. Roca AI, Abajian AC, and Vigerust DJ:ProfileGrids solve the large alignment visualization problem: influenza hemagglutinin example [v1].
F1000Research2013,2:2 [http://f1000research.com/articles/2-2/]. 32. BioVis 2013 Redesign Contest: Protein Mutation Profiles.[http://www.
biovis.net/year/2013/info/redesign-contest].
33. BioVis 2013 Redesign Contest“instructions.pdf”.[http://www.biovis.net/ sites/default/files/biovis2013.redesign.tgz].
34. JProfileGrid Facilitates Visual Exploration of dTIM Mutations within the Context of a Family Alignment.[http://dx.doi.org/10.6084/m9. figshare.902160].
35. Sakai R, Aerts J:Sequence diversity diagram for comparative analysis of multiple sequence alignments.BMC Proceedings2014,8(Suppl 2):S9. 36. Kultys M, Nicholas L, Schwarz R, Goldman N, King J:Sequence Bundles: a
novel method for visualising, discovering and exploring sequence motifs.BMC Proceedings2014,8(Suppl 2):S8.
37. Gribskov M, McLachlan AD, Eisenberg D:Profile analysis: detection of distantly related proteins.Proc Natl Acad Sci USA1987,84:4355-8.
doi:10.1186/1753-6561-8-S2-S6
Cite this article as:Roca:ProfileGrids: a sequence alignment visualization paradigm that avoids the limitations of Sequence Logos. BMC Proceedings20148(Suppl 2):S6.
Submit your next manuscript to BioMed Central and take full advantage of:
• Convenient online submission
• Thorough peer review
• No space constraints or color figure charges
• Immediate publication on acceptance
• Inclusion in PubMed, CAS, Scopus and Google Scholar
• Research which is freely available for redistribution