LETTER Earth Planets Space,57, 557–561, 2005
Imaging of
S
-wave reflectors in and around the hypocentral area of the 2004
mid Niigata Prefecture Earthquake (M6.8)
Satoshi Matsumoto1, Yoshihisa Iio2, Takeshi Matsushima1, Kenji Uehira1, and Takuo Shibutani2
1Institute of Seismology and Volcanology, Faculty of Sciences, Kyushu University, Shin’yama, Shimabara, Nagasaki 855-0843, Japan 2Research Center for Earthquake Prediction, Disaster Prevention Research Institute, Kyoto University, Gokasho, Uji, Kyoto 611-0011, Japan
(Received February 14, 2005; Revised April 23, 2005; Accepted May 16, 2005)
An S-wave reflector is considered to relate to the existence of liquid in the seismogenic zone of the crust, which plays an important role in understanding the mechanism of earthquakes. We studied a distribution of S-wave reflectors in and around the hypocentral zone of the 2004 mid Niigata Prefecture Earthquake (M6.8). The earthquake was followed by several aftershocks that were greater than M6. Moreover, the aftershocks were not only located on the fault plane of the main shock but also on conjugate fault planes and on a parallel plane to that of the main shock. In order to discuss the relationship between this complex activity and the crustal heterogeneities, we analyzed the seismograms observed at the seismic stations in this region. Normal moveout processing (NMO) was applied to the data of the aftershock. SeveralS-wave reflectors could be identified from the NMO sections for every station. In particular, relatively strongS-wave reflectors exist in the lower crust at a depth of approximately 20–25 km in the middle part of the aftershock region. Additionally, reflectors were found beneath the fault planes of the main shock and the largest aftershock. This suggests a possibility of the correlation of the crustal heterogeneities to the occurrence of an earthquake.
Key words:Inhomogeneity, reflector, mid Niigata, crustal structure.
1.
Introduction
The 2004 mid Niigata Prefecture Earthquake (M6.8) (re-ferred to as the Niigata EQ. in this paper) occurred on 23 Oct., 2004 in the central part of the Niigata Prefecture, Hon-shu, Japan. The earthquake mechanism observed here is of the reverse fault type. Large aftershocks, the magnitude of which was greater than M6, occurred within 4 days of the main shock. Shibutaniet al.(2005) studied the aftershock distribution in detail and detected the plural fault planes of the aftershocks except that of the main shock. Major fault planes are located parallel and perpendicular to the main fault plane. The perpendicular one can be interpreted as a conjugate fault plane of the main shock. The complex earth-quake fault distribution could be attributed to medium hav-ing a critical condition of stress to shear strength in this re-gion as suggested by Miyazawaet al.(2005). This is a vital point in the discussion of the occurrence of an earthquake how the hypocenter distribution relates to the heterogeneous structure of the crust because of the effect of the structure of the crust on the stress concentration. Matsumotoet al. (1999, 2000) showed that strong inhomogeneities exist just below the initiation points of the 1995 Kobe and the 2000 Tottori earthquakes. Therefore, in this study, we endeavor to ascertain strong heterogeneities in the form of S-wave reflectors in and around the hypocentral area of the Niigata EQ.
Copy right cThe Society of Geomagnetism and Earth, Planetary and Space Sci-ences (SGEPSS); The Seismological Society of Japan; The Volcanological Society of Japan; The Geodetic Society of Japan; The Japanese Society for Planetary Sci-ences; TERRAPUB.
2.
Data Analysis and Results
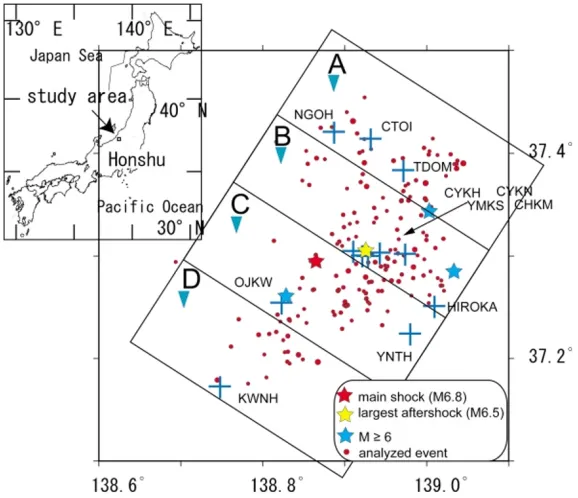
Several seismic stations were set up in this region by the National Research Institute for Earth Science and Disaster Prevention (NIED) and the Japan Meteorological Agency (JMA). The purpose of these seismic stations is to facili-tate continuously the recording of seismic signals. In or-der to determine the precise aftershock location, we de-ployed online and offline temporal seismic stations above the hypocentral region of the earthquake. Figure 1 shows the station distribution. The seismic signals at three stations (TDOM, OJKW, and YMKS) are continuously teleme-tered via satellite with sampling frequency of 100 Hz to the Kyushu and Kyoto Universities. The CTOI, CYKN, CYKH, and CHKM are offline stations at which data are recorded by data loggers. The data at these stations are dig-itized with a sampling frequency of 200 Hz. The other sta-tions indicated in Fig. 1 are those of NIED and JMA.
In order to detect reflected phases, we selected 175 earth-quakes with M≥2 during Oct. 23–Nov. 10 that were iso-lated in time. The purpose of this selection was to avoid contamination in the coda part of a seismogram by other earthquakes. The hypocenters used in this study are also plotted in Fig. 1. In this study, the aftershock distribution is divided into 4 regions to observe the relationship between the activity along the dip direction of the earthquake and the reflectors, as shown in Fig. 1. The seismograms for every station are analyzed and processed by a band-pass filter and an auto gain control (AGC) with a gate length of 4 seconds. AGC is an amplitude recover processing. The amplitude for a waveform at a lapse time (t) is normalized by root mean square amplitude betweent −2 to t +2 sec for the gate
Fig. 1. Map showing the stations and the epicenter distribution used in this study. Cross and solid circle denote the station and the epicenter, respectively. Star indicates the location of the main shock and large aftershocks with M≥6. In the analysis, the rectangles A, B, C, and D are studied region divided considering with epicenter distribution.
length of 4 seconds by the AGC. The pass band frequency of the filter is from 4 to 20 Hz. The output signals from this procedure are applied with normal moveout processing (NMO), which are frequently used in studies of seismic ex-ploration. For an NMO, it is assumed that the seismic signal in horizontal component is composed of manySwaves re-flected by a horizontal reflector (Sx Sphases). TheSwave velocity structure for the NMO follows a depth dependent model expressed asV(z)=3.17+0.0424z, whereV and zare the velocity in km/sec and depth in km, respectively; the velocity structure is a smoothed structure that is used for determining the hypocenter in this area (Wadaet al., 1979). The section for each horizontal component is individually processed. In Fig. 2, examples of the NMO sections are shown at stations in every region. We sort the traces and rearrange them in the order of its distance from a standard point (e.g., location of the triangle with the region code in Fig. 1). The trace is plotted from the directS-wave arrival toward the latter part of the seismogram. The time sequence of the trace is converted into depth by using the S-wave velocity structure and lapse time from the direct S-wave arrival through NMO. The locations of reflectors can be determined well relatively for the locations of hypocenters by means of the relative lapse time, even if the strong ve-locity inhomogeneity exists above the hypocenter. The ini-tial depth of the trace is identical to that of the hypocenter. We can recognize many phases in the sections. Arrows in the figure indicate relatively strong reflected phases. Gen-erally, the reflectors can be found in the range from 12 to 37 km. However, the depth varies from region to region. Clear phases can be observed in the section of region B where the aftershock activity is the highest. These phases could be still imaged for various time window lengths for the AGC. Especially, strong reflected phases are found in the section
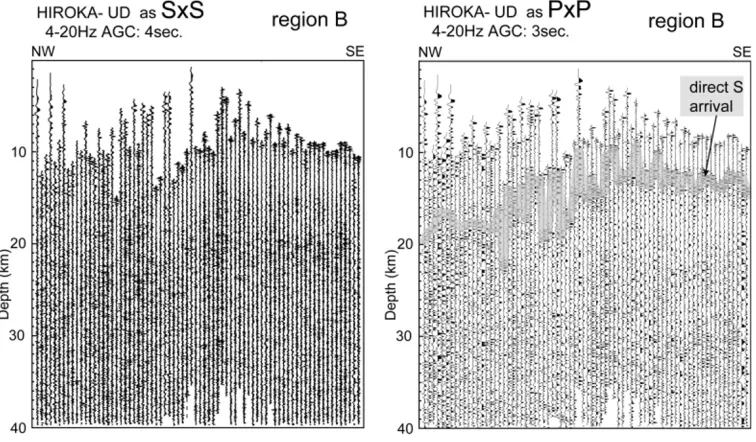
at HIROKA in the region B. These phases also can be rec-ognized at other stations in the region B. To check the as-sumption for the reflected phases to beSx Swaves, a NMO section of the vertical component for the event in region B at HIROKA is plotted in left side of Fig. 3. In this figure, we can see similar reflected phases in the section of HI-ROKA in Fig. 2. However, the phases are not so clear. This shows the reflected phases dominant in the horizontal com-ponents. For other stations, we can see similar feature to that for HIROKA. Therefore, most of the reflected phases appearing in the Fig. 2 are Sx Swaves. An NMO section converted to depth asP x P waves for same data as the left in Fig. 3 is shown in right side of Fig. 3 sincePtoPwave reflected by the reflectors for Sx Swaves should be found in the section. The velocity structure for P wave is also quoted from Wadaet al.(1979). In this figure, some phases possible correspond to the reflector seen in the NMO sec-tion forSx S waves. This suggests that the reflectors also generateP x Pphases. However, it is not always able to im-age those clearly because of the large amplitude of direct S wave arrival in the section and of small P wave energy radiated from the source.
S. MATSUMOTOet al.: S-WAVE REFLECTOR BENEATH THE 2004 MID NIIGATA EQ 559
Fig. 2. Examples of NMO sections. The section is indicated at one of the stations for each region. Arrows indicate the reflected phases that are significant.
Fig. 4. Reflector distribution in region B. NMO sections at CYKH, YMKS, CYKN, CHKM, and HIROKA are merged together. Solid circles indicate the aftershocks in region B. Stars show the locations of the event M≥6.
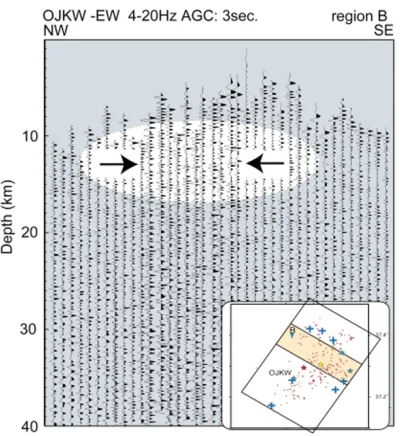
Fig. 5. NMO section at OJKW for the events in region B. Arrows shows reflected phases that the reflection points could be plotted around the hypocenter of the main shock.
The plotted stations and hypocenters of the aftershock are located in region B. To compare the spatial location of the reflectors with those of the large events, the events (M≥6) are plotted together. The section for each horizontal com-ponent is individually processed and plotted on the same figure. We project the horizontal locations of the reflector
Fig. 6. An interpretation of the reflector distribution. The fault planes for the main shock, aftershocks, large events (M≥6), and the general feature of the velocity structure are plotted together.
on the cross section along N120E, which is perpendicular to the fault plane of the main shock (Shibutaniet al., 2005). In Fig. 4, strong reflectors can be seen at a depth of imately 20 to 25 km. The reflectors at a depth of approx-imately 20 km are distributed in the southeast edge of the section. However, they are deeper toward the northwest di-rection of the section. A depth gap is found at 6 km from the right edge of the section. Strong reflectors are also detected beneath the fault plane of the main shock and that of the largest aftershock. Moreover, reflective zones at depths of 32–37 km can be found. The bottom of the reflective zone could possibly correspond to the Moho discontinuity.
3.
Discussions and Summary
S. MATSUMOTOet al.: S-WAVE REFLECTOR BENEATH THE 2004 MID NIIGATA EQ 561
As can be seen in Figs. 2 and 4, it is difficult to read the on-set times of the reflected phases due to their unclear arrival. Essentially, the reflectors imaged in this study do not have a strong dipping angle. Therefore, it is reasonable to interpret that many horizontal reflectors are distributed in the lower crust.
In Fig. 4, the hypocenters of the large event (M≥6) are plotted with the obtained reflectors. The location of the main shock is about 2 km off the region B. Strictly speak-ing, the existence of the reflector beneath the main shock cannot be confirmed from Fig. 4. We show a NMO section of OJKW for the event in region B in order to find the re-flector existing beneath the hypocenter of the main shock. Reflected phases can be found in the part pointed by arrows in Fig. 5. Horizontal locations of the reflectors identified in Fig. 5 are located around the hypocenter. From this figure, the reflector also exists just beneath the hypocenter of the main shock.
Figure 6 shows our results and other information ob-tained in this region. The hypocenter distribution dips to-ward the northwest as described above. Katoet al.(2005), Korenagaet al.(2005), and Okadaet al.(2005) show that both P andS wave velocities decrease from the southeast to the northwest and a low velocity zone exists deeper to-ward the northwest. These suggest that a dipping structure to NW exists in this region. The reflector in the lower crust is also detected deeper in the dipping direction. This im-plies that the dipping structure extends throughout the crust of this region. The reflector appears just around and be-neath the initiation point of the main shock and the largest aftershock. This suggests the possibility that a strong het-erogeneity forSwaves around the hypocenter might relate to the nucleation of the earthquake rupture since the exis-tence of liquid is one of the probable reasons of the origin of theS-wave reflector.
Acknowledgments. We are indebted to the participants for their cooperation in the joint observation between the Kyoto and Kyushu Universities. The helpful comments and suggestions of
Dr. Nishigami and an anonymous reviewer, and Prof. Hirata on preliminary version of the article are gratefully acknowledged. We use seismic data observed by NIED and JMA. This work was sup-ported by the Grant-in-Aid for Special Purposes (16800054).
References
Kato, A., E. Kurashimo, N. Hirata, T. Iwasaki, and T. Kanazawa, Imaging the source region of the 2004 Mid-Niigata prefecture earthquake and the evolution of a seismogenic thrust-related fold,Geophys. Res. Lett., 2005 (in press).
Korenaga, M., S. Matsumoto, Y. Iio, T. Matsushima, K. Uehira, and T. Shibutani, Three dimensional velocity structure around aftershock area of the 2004 mid Niigata prefecture earthquake (M6.8) by the Double-Difference tomography,Earth Planets Space,57, 429–433, 2005. Matsumoto, S., K. Obara, and A. Hasegawa, Imaging P-wave scatterer
distribution in the focal area of 1995 M7.2 Hyogo-ken Nanbu (Kobe) Earthquake,Geophys. Res. Lett.,25, 9, 1439–1442, 1998.
Matsumoto, S., K. Obara, N. Kimura, and M. Nakamura, Imaging P-wave scatterer distribution around the focal area of the 2000 Western Tottori Earthquake (Mw6.6),Zisin,2, 55, 229–232, 2002 (in Japanese). Miyazawa, M., J. Mori, Y. Iio, T. Shibutani, S. Matsumoto, H. Katao, S.
Ohmi, and K. Nishigami, Triggering Sequence by Static Stress Changes of Large aftershocks of the Niigata-Chuetsu, Japan Earthquake,Earth Planets Space, 2005 (submitted).
Okada, T., N. Umino, T. Matsuzawa, J. Nakajima, N. Uchida, T. Nakayama, S. Hirahara, T. Sato, S. Hori, T. Kono, Y. Yabe, K. Ariyoshi, S. Gamage, J. Shimizu, J. Suganomata, S. Kita, S. Yui, M. Arao, S. Hondo, T. Mizukami, H. Tsushima, T. Yaginuma, A. Hasegawa, Y. Asano, H. Zhang, and C. Thurber, Aftershock distribution and 3D seis-mic velocity structure in and around the focal area of the 2004 mid Niigata prefecture earthquake obtained by applying double-difference tomography to dense temporary seismic network data,Earth Planets Space,57, 435–440, 2005.
Shibutani, T., Y. Iio, S. Matsumoto, H. Katao, T. Matsushima, S. Ohmi, F. Takeuchi, K. Uehira, K. Nishigami, B. Enescu, I. Hirose, Y. Kano, Y. Kohno, M. Korenaga, Y. Mamada, M. Miyazawa, K. Tatsumi, T. Ueno, H. Wada, and Y. Yukutake, Aftershock distribution of the 2004 Mid Niigata Prefecture Earthquake derived from a combined analysis of temporary online observations and permanent observations,Earth Planets Space,57, this issue, 545–549, 2005.
Wada, H., T. Mikumo, and M. Koizumi, Seismicity and focal mechanism of local earthquakes along the Atotsugawafault and in the northern Hida region,Zisin,2, 32, 3, 281–296, 1979.