Estimation of the source model for the foreshock of the 2004 off the Kii
peninsula earthquakes and strong ground motion simulation of the
hypothetical Tonankai earthquake using the empirical
Green’s function method
Wataru Suzuki, Tomotaka Iwata, Kimiyuki Asano, and Nobuyuki Yamada∗
Disaster Prevention Research Institute, Kyoto University, Gokasho, Uji, Kyoto 611-0011, Japan
(Received December 3, 2004; Revised March 15, 2005; Accepted April 7, 2005)
We estimated the source model for the foreshock of the 2004 off the Kii peninsula earthquakes by empirical Green’s function modeling. The size and the rise time of the strong motion generation area (SMGA) were estimated to be 30×15 km, and 0.9 sec, respectively. The stress drop of the SMGA was calculated to be 8.3 MPa. This model could reproduce long-period ground motions following the directS-wave observed in the Osaka basin well. Using the derived source parameters, we simulated strong motions of the hypothetical Tonankai earthquake. Distribution of the seismic intensity derived here is similar to that obtained by the previous report. We could predict long-period ground motions which last for a long duration at the basin sites.
Key words:Empirical Green’s function method, foreshock of the 2004 off the Kii peninsula earthquakes, source model, stress drop, strong ground-motion simulation, hypothetical Tonankai earthquake.
1.
Introduction
At 19:07 on 5 September 2004, an MJMA7.1
(magni-tude determined by Japan Meteorological Agency, JMA) earthquake occurred in the south east off the Kii peninsula, Japan. About five hours later, a larger MJMA7.4 earthquake
took place about 30 km away from the first one. We call the latter large event the mainshock of the 2004 off the Kii peninsula earthquakes and take the 19:07 one as its fore-shock. These earthquakes and their aftershocks are thought to be intraplate earthquakes, which occurred in the subduct-ing Philippine Sea Plate (The Headquarters for Earthquake Research Promotion, hereafter HERP, 2004). In order to examine the source characteristics of these earthquakes, we estimated the source model for the foreshock comparing the observed and synthetic strong-motion waveforms. The rea-son why we would like to model not the mainshock but the foreshock, is that the latter rupture seems to be simpler than the former (e.g. Yagi, 2004; Yamanaka, 2004).
Because the wave observed on land passed through the long propagation path and was affected by the complex un-derground structure, it might be difficult for a theoretical ap-proach to reproduce the strong motion records. So we used the empirical Green’s function (EGF) method, which origi-nated with Hartzell (1978) to calculate a record of an earth-quake by summing up that of a smaller event located near the larger one. Using the EGF method developed by Irikura
∗Present address: Chuo Kaihatsu Corporation, 3-4-2, Nishi-Aoki,
Kawaguchi, Saitama 332-0035, Japan.
Copy right cThe Society of Geomagnetism and Earth, Planetary and Space Sci-ences (SGEPSS); The Seismological Society of Japan; The Volcanological Society of Japan; The Geodetic Society of Japan; The Japanese Society for Planetary Sci-ences; TERRAPUB.
(1986), the observed broadband strong-motion records can be simulated well on the assumption of a characterized sim-ple fault model, which is a rectangle in shape with a con-stant slip and stress drop (e.g. Kamae and Irikura, 1998; Kamae and Kawabe, 2004; Miyakeet al., 2003). Miyakeet al.(2003) called this area the strong motion generation area (SMGA). They showed that in most cases, the SMGA cor-responds to the asperity area which is observed in the slip distribution inverted using relatively low frequency (<1 Hz) strong motion records. We took the same approach as the studies above to model the seismic source.
Near the epicenters of the 2004 off the Kii peninsula earthquakes, a large subduction zone earthquake called the Tonankai earthquake has repeated itself throughout history. The next Tonankai earthquake is expected to occur with a high probability in the near future (HERP, 2001a). The 2004 off the Kii peninsula earthquakes would provide valu-able information to grasp the gross characteristics of the strong motion of the Tonankai earthquake, especially its propagation effect, although their source regions were not exactly the same. Using the estimated source parameters for the foreshock analysis, we also carried out an EGF sim-ulation of the ground motion caused by the hypothetical Tonankai earthquake which showed some characteristics of the simulated strong ground motions.
2.
Estimation of the Source Model of the
Fore-shock
2.1 Data and analysis
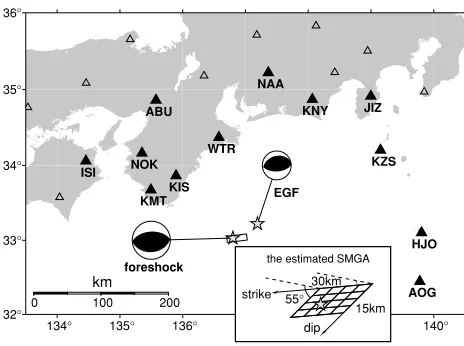
We used strong-motion records obtained by F-net. Their stations can be supposed as rock sites. Because the records are less contaminated by site effects, they are thought to be better for observing the source characteristics. Figure 1
134° 135° 136° 137∞ 138∞ 139∞ 140°
foreshock the estimated SMGA
Fig. 1. Distribution of the F-net stations used for the estimation of the source model of the foreshock (closed triangle). Geometry of the estimated SMGA of the foreshock is also shown.
shows the stations we used for this study.
We used the records of the MJMA5.5 aftershock at 3:36
on 8 September as the EGF. Source parameters of the fore-shock and the EGF afterfore-shock are listed in Table 1. We calculated the synthetic waveforms according to the EGF method proposed by Irikura (1986). Irikura’s method is based on theω−2source scaling relation between the large
and small earthquakes. To obey this scaling, the number to divide the SMGA into subfaults (N ×N) and the ratio of the stress drop of the large earthquake to the small one (C) are determined from the spectral ratio of the two events (Miyakeet al., 2003). Reading the flat levels of the high and low frequencies, N andC were determined as 4 and 2.5, respectively. The focal mechanism of the EGF event resembled that of the foreshock as seen in Fig. 1. A plane dipping to the north was chosen as the fault plane from a pair of nodal planes of the moment tensor solution deter-mined by the F-net, referring to Yagi (2004) and Satakeet al.(2005). Rupture was assumed to propagate radially from the hypocenter determined by JMA, which was located in the SMGA.
We searched the size of the SMGA, the rupture propaga-tion direcpropaga-tion, and the rise time, using the genetic algorithm (GA). The searching ranges of the length of the SMGA and the rise time were 0.4–60.0 km and 0.04–5.0 sec and the width was assumed to be half of the length. The rupture velocity was fixed in each GA search. We tried four cases where the rupture velocity was 1.8, 2.2, 2.6, and 3.0 km/s. As the evaluation function for the GA search, we used the sum of the residual value of horizontal velocity waveforms and acceleration envelopes for 30 sec from 2 sec before the
S-wave’s arrivals. The frequency band for velocity was set to be 0.05–2.0 Hz, while that for acceleration was 0.05– 20.0 Hz. We did the GA search with 100 initial models and obtained an improved model after 100 generations. We per-formed this procedure five times, changing the sets of initial models each time.
2.2 Result
When the rupture velocity was 3.0 km/s, the five searches gave similar results listed in Table 2 and smaller residual
value. From this result, we estimated the length and the width of the SMGA, and the rise time to be 30 km, 15 km, 0.9 sec, respectively. The rupture started at the sub-fault which was third along the strike and third along the dip direction (Fig. 1). This means that the rupture directiv-ity effect was not very strong. Figure 2 shows an example of the comparison between the observed and synthetic wave-forms. The fitting of acceleration and velocity waveforms is fairly good. As the stress drop of the EGF event was 3.3 MPa from the formula of Eshelby (1957) with the area 28.1 km2 and the seismic moment 2.06×10¹⁷ Nm, the stress drop on the SMGA of the foreshock was calculated to be 8.3 MPa.
2.3 Discussion
The sequence of the 2004 off the Kii peninsula earth-quakes is thought to have taken place in the subducting plate. Asano et al. (2003) indicated that intraslab earth-quakes have larger stress drops on the SMGA than crustal earthquakes. They also observed the larger stress drop on the SMGA for the deeper events. The stress drop we esti-mated here is similar to that of crustal earthquakes. We used the hypocenters determined by JMA. Aftershock depths obtained using ocean bottom seismometer data were re-ported to be much shallower than those determined by JMA (HERP, 2004). Itoet al.(2005) also obtained a shallow cen-troid depth for these earthquakes. The relatively smaller stress drop for an intraslab earthquake obtained here may be due to the shallower focal depth. Since a change of the focal depth makes little difference of the hypocentral dis-tance, it scarcely affects our estimation of the SMGA size.
We simulated the records of the stations located in the Osaka basin maintained by the Committee of Earthquake Observation and Research in the Kansai Area (CEORKA) from the estimated source model. Our purpose is to exam-ine whether the long-period ground motion observed in the basin site can be reproduced from an EGF that might have smaller power over longer periods. A velocity-type strong-motion seismograph has been installed at the CEORKA stations, which provides higher quality data for long peri-ods. Figure 3 shows the comparison between the observed and synthetic velocity waveforms and those spectra. Later phases with long duration can be reproduced well. We can conclude that records of the EGF event have a large enough S/N ratio to reproduce the long-period ground motion in the Osaka basin.
3.
Strong Motion Simulation of the Hypothetical
Tonankai Earthquake
3.1 Data and analysis
por-Table 1. Information of the foreshock of the 2004 off the Kii peninsula earthquakes and the aftershock used as EGF. Superscript 1 denotes the parameter estimated by JMA and 2 that estimated by F-net.
Foreshock EGF
Date 2004/09/05 19:07 2004/09/08 03:36
Latitude1 33.03◦N 32.96◦N
Longitude1 136.80◦E 137.32◦E
Depth1 37.6 km 39.7 km
MJMA 7.1 5.5
Strike2 263◦; 92◦ 254◦; 92◦
Dip2 55◦; 36◦ 34◦; 57◦
Rake2 85◦; 97◦ 75◦; 100◦
Seismic moment2 7.73×10¹⁹Nm 2.06×10¹⁷Nm
Table 2. Source parameters of the foreshock obtained by the GA search for five trials.
Trial 1 Trial 2 Trial 3 Trial 4 Trial 5
Length of the SMGA 30.496 km 30.556 km 30.676 km 30.496 km 30.440 km
Width of the SMGA 15.248 km 15.278 km 15.338 km 15.248 km 15.220 km
Rise time 0.870 sec 0.888 sec 0.908 sec 0.880 sec 0.868 sec
Rupture starting subfault (3,3) (3,3) (3,3) (3,3) (3,3)
Table 3. Source parameters modeled for the hypothetical Tonankai earthquake. Location of the each asperity is seen in Fig. 2. Parenthetic values in the column of depth of the rupture starting point is the rupture starting time measured from the time when the first asperity starts to break.
Strike Dip Depth of the rupture starting point Size Seismic moment Stress drop
Asperity 1 210◦ 15◦ 23.1 km (0.0 sec) 702 km2 1.40×10²⁰Nm 21.9 MPa
Asperity 2 230◦ 15◦ 20.4 km (26.6 sec) 1376 km2 3.75×10²⁰Nm 20.1 MPa
Asperity 3 270◦ 15◦ 23.1 km (51.7 sec) 702 km2 1.40×10²⁰Nm 21.9 MPa
KIS
-28 0 28
cm/s/s
-1.2 0.0 1.2
cm/s
-16 0 16
-1.4 0.0 1.4
0 5 10 15 20 25 30 [sec]
NAA
-4 0 4
cm/s/s
-0.36 0.00 0.36
cm/s
0 5 10 15 20 25 30 -5.5
0.0 5.5
-0.48 0.00 0.48
0 5 10 15 20 25 30
AOG
-2.5 0.0 2.5
-0.8 0.0 0.8
0 5 10 15 20 25 30 -2.1
0.0 2.1
-0.74 0.00 0.74
KZS
-11 0 11
-2.1 0.0 2.1
-7.6 0.0 7.6
-1.2 0.0 1.2
EW comp. NS comp. EW comp. NS comp.
Fig. 2. Example of the fitting between observed (blue) and synthetic (red) waveforms at the four F-net stations. The upper pair for each station shows the acceleration waveforms, and the lower pair shows the velocity. Both waveforms are band-pass filtered for 0.05–20.0 Hz.
tion, and ignored the background off-asperity area. The source parameters for each asperity are listed in Table 3.
NandCof each asperity were determined in order to fit the size and the stress drop of the asperities with those used in
CE-0 30 60 90 120 150 180 210 240 [sec] AMA
-4.335 0.000 4.335
NS [cm/s]
-4.335 0.000 4.335
EW [cm/s]
0 30 60 90 120 150 180 210 240 [sec] FKS
-4.375 0.000 4.375
-4.375 0.000 4.375
0.01 0.1 1 10 100
Velocity spectrum [cm/s*s]
0.05 0.1 0.5 1 2 5 10 20
EW component NS component
Frequency [Hz]
EW component NS component
Frequency [Hz]
0.05 0.1 0.5 1 2 5 10 20 0.05 0.1 0.5 1 2 5 10 200.05 0.1 0.5 1 2 5 10 20 0.01
0.1 1 10 100
Fig. 3. Comparison between velocity waveforms observed at stations in the Osaka basin and that simulated assuming the obtained source model (upper) and comparison of the velocity spectra (lower). Blue lines are the observations and the red lines are the simulations.
135° 136° 137° 138°
33° 34° 35° 36°
100 km FKS
MIE003
AIC016 AMA
asperity 2
asperity 3
Rupture Propagation Direction
asperity 1
EGF event
Fig. 4. Source model of the hypothetical Tonankai earthquake used in this study. Each star indicates the rupture starting point of each asperity.
ORKA, where the records of the EGF event were available. The frequency band used for this simulation was 0.05–20.0 Hz. The rupture velocity was assumed to be 2.7 km/s, re-ferring to HERP (2001b).
3.2 Result
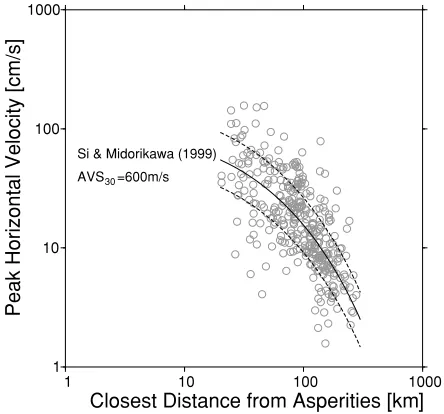
The peak horizontal velocity (PHV) of synthetic data is compared with the empirical attenuation relation proposed
1 10 100 1000
Peak Horizontal Velocity [cm/s]
1 10 100 1000
Closest Distance from Asperities [km]
Si & Midorikawa (1999)
AVS30=600m/s
Fig. 5. Relationship of peak horizontal velocity to the closest distance from the asperity. The solid line is the empirical attenuation curve for the site where Vs is 600 m/s derived by Si and Midorikawa (1999). Broken lines indicate its standard deviation.
by Si and Midorikawa (1999) in Fig. 5. Our simulation was performed by a linear summation. Although the empirical relation was derived from compiling the data corrected for site amplification, we did not make any correction to the predicted PHV. This may cause some scattering of the pre-dicted PHV from the empirical relation. Nevertheless, the predicted PHV follows the empirical attenuation relation to a large extent.
wave-more than 6 lower
5 lower - 5 upper, possibly 6 lower 5 lower - 5 upper
less than 4, possibly 5 lower less than 4
source region
133° 134° 135° 136° 137° 138° 139° 140° 141° 33°
34° 35° 36° 37°
6+ & 7 6-5+ 5-4 3
The Headquarters for Earthquake Research Promotion (2001)
Fig. 6. Distribution of the seismic intensity calculated by this study (up-per) and that calculated by the Headquarters for Earthquake Research Promotion (2001b, lower).
-156.5 0.0 156.5
cm/s
-156.5 0.0 156.5
cm/s
-94.42 0.00 94.42
cm/s
-94.42 0.00 94.42
cm/s
-39.9 0.0 39.9
cm/s
-39.9 0.0 39.9
cm/s
-47.85 0.00 47.85
cm/s
-47.85 0.00 47.85
cm/s
NS component EW component
AIC016
MIE003
AMA
FKS
0 30 60 90 120 150 180 210 240 [sec] 0 30 60 90 120 150 180 210 240 [sec]
Fig. 7. Example of horizontal velocity waveforms predicted for the stations in the Aichi and Mie prefectures (AIC016 and MIE003) and in the Osaka basin (AMA and FKS).
forms. This is generally consistent with that calculated by HERP (2001b), which used the stochastic Green’s function method. Large seismic intensities of more than 5+were predicted for the Aichi and Mie prefectures, which is lo-cated toward the rupture propagation.
Examples of the velocity waveforms for the stations in the Aichi and Mie prefectures (AIC016 and MIE003) and the Osaka basin (FKS and AMA) are shown in Fig. 7. At the stations in the Osaka basin, long-period ground motions last for more than 3 min. At MIE003, long-duration ground mo-tions are also observed after the directS-wave. On the other hand, the waveform predicted at AIC016 mainly contains a high frequency component with very large amplitude. Seis-mic intensity 7 was predicted for this station. The depth to the bedrock at MIE003 is deeper than that at AIC016, although both stations are located in the Nobi basin.
3.3 Discussion
The frequency band we mainly aimed at in this simula-tion was associated with the low frequency ground mosimula-tion observed in the basin site (around 0.2 Hz) and the seismic intensity (up to several Hz). Kamae and Kawabe (2004) succeeded in simulating the ground motion of the 2003 Tokachi-oki earthquake (MJMA8.0), whose frequency band
stations. This is probably because the asperity is a major contributor to the waves with the frequency band analyzed in this study. Since the EGF event had enough power, even for low frequency as mentioned in the discussion section of the foreshock analysis, low-frequency ground motion in the Osaka basin could be simulated. Our simulation pro-vides the main characteristics of the strong ground motions of the hypothetical Tonankai earthquake. Of course, the background area should be considered for a more thorough simulation. It would be necessary to examine how to set the source parameters for the background area and carry out a simulation using a source model that consist of both asper-ity and background region.
4.
Conclusion
We estimated the source model to explain the broadband waveform of the foreshock of the 2004 off the Kii penin-sula earthquakes by the empirical Green’s function method. After five trials of the GA search, we estimated that the size of the SMGA is 30×15 km, on the assumption that the aspect ratio is 2:1. The stress drop in the SMGA was calcu-lated to be 8.3 MPa, which is comparable to that of crustal earthquakes. Using the same EGF as the foreshock analy-sis, we made a strong motion simulation of the hypotheti-cal Tonankai earthquake. In both analyses, the long period ground motion in the Osaka basin could be produced, even when using a relatively small earthquake as the EGF.
Acknowledgments. We used the waveform data provided by the K-NET, KiK-net, and F-net of National Research Institute for Earth Science and Disaster Prevention (NIED), and CEORKA. And we also used the hypocentral information from JMA, and the moment tensor solution from the F-net. We are grateful to the staff in these institutes for their continuous efforts to main-tain the systems so as to obmain-tain high quality data. We thank Dr. Nobuyuki Morikawa and the anonymous reviewer for their help-ful comments. This study is supported by Grant-in-Aid for Scien-tific Research (B) 14350304 and the special project for earthquake disaster mitigation in urban areas of the Ministry of Education, Culture, Sports, Science, and Technology, Japan.
References
Asano, K., T. Iwata, and K. Irikura, Source characteristics of shallow intraslab earthquakes derived from strong-motion simulations,Earth
Planets Space,55, e5–e8, 2003.
Eshelby, J. D., The determination of the elastic field of an ellipsoidal inclusion, and related problems,Proc. Roy. Soc.,A241, 376–396, 1957. Hartzell, S. H., Earthquake aftershock as Green’s functions,Geophys. Res.
Lett.,5, 1–4, 1978.
Irikura, K., Prediction of strong acceleration motions using empirical Green’s function,Proc. 7th Japan Earthq. Eng. Symp., 151–156, 1986. Ito, Y., T. Matsumoto, H. Kimura, H. Matsubayashi, K. Obara, and S.
Sekiguchi, Spatial distribution of centroid moment tensor solutions for the 2004 off Kii peninsula earthquakes,Earth Planets Space,57, this issue, 351–356, 2005.
Japan Meteorological Agency, On Seismic Intensity, Gyosei, Tokyo, 238 pp., 1996 (in Japanese).
Kamae, K. and K. Irikura, Source model of the 1995 Hyogo-ken Nanbu earthquake and simulation of near-source ground motion,Bull. Seism. Soc. Am.,88, 400–412, 1998.
Kamae, K. and H. Kawabe, Source model composed of asperities for the 2003 Tokachi-oki, Japan, earthquake (MJ M A =8.0) estimated by the empirical Green’s function method,Earth Planets Space,56, 323–327, 2004.
Miyake, H., T. Iwata, and K. Irikura, Source characterization for broadband ground-motion simulation: kinematic heterogeneous source model and strong motion generation area,Bull. Seism. Soc. Am.,93, 2531–2545, 2003.
Satake, K., T. Baba, K. Hirata, S. Iwasaki, T. Kato, S. Koshimura, J. Takenaka, and Y. Terada, Tsunami source of the 2004 off the Kii Penin-sula earthquakes inferred from offshore tsunami and coastal tide gauges, Earth Planets Space,57, 173–178, 2005.
Si, H. and S. Midorikawa, New attenuation relationships for peak ground acceleration and velocity considering effects of fault type and site con-dition,J. Struct. Constr. Eng., AIJ.,523, 63–70, 1999 (in Japanese with English abstract).
The Headquarters for Earthquake Research Promotion, On the long-term evaluation of earthquakes in the Nankai trough, http://www.jishin.go.jp/ main/chousa/01sep nankai/index.htm, 2001a (in Japanese).
The Headquarters for Earthquake Research Promotion, The interim re-port on strong ground motion evaluation methods for projected earth-quakes in the Nankai trough, http://www.jishin.go.jp/main/kyoshindo/ 01b/index.htm, 2001b (in Japanese).
The Headquarters for Earthquake Research Promotion, Seismic activity off-shore southeast of the Kii Peninsula, The 132nd Evaluation of the Earthquake Research Committee, http://www.jishin.go.jp/main/chousa/ 04oct kiihantou/index-e.htm, 2004.
Yagi, Y., On September 5, 2004 Southeast off of Kii Peninsula Earthquake, http://iisee.kenken.go.jp/staff/yagi/eq/Japan20040905/Japan20040905 1-j.html, 2004 (in Japanese).
Yamanaka, Y., EIC seismological note,152, http://www.eri.u-tokyo.ac.jp/ sanchu/Seismo Note/2004/EIC152.html, 2004 (in Japanese).