Earth Planets Space,65, 17–23, 2013
Repeating deep tremors on the plate interface
beneath Kyushu, southwest Japan
Suguru Yabe and Satoshi Ide
Department of Earth and Planetary Science, the University of Tokyo, 7-3-1, Hongo, Bunkyo, Tokyo 113-0033, Japan
(Received March 2, 2012; Revised June 11, 2012; Accepted June 11, 2012; Online published February 19, 2013)
In the subduction zone south of Kyushu Island, at the western extension of the Nankai subduction zone, southwest Japan, the age of the oceanic crust increases toward the south across the subducting Kyushu-Palau ridge. While tremor activity is very high in Nankai, tectonic tremors have only recently been discovered in Kyushu. In this study, we examined tremors beneath Kyushu using an improved version of the envelope correlation method. In doing so, we distinguished tremors from normal earthquakes and background noise using the criteria of source duration and the spectrum ratio between low and high frequencies. Accurate measurement ofS-P times, using cross-correlation between vertical and horizontal seismograms, constrains the tremor depth precisely. Tremor activity is low and within a small region in southern Kyushu, where thick crust of the Kyushu-Palau ridge is being subducted, at depths between 35 and 45 km (i.e., shallower than intra-slab earthquakes by about 20 km), which is consistent with the location of the plate interface within uncertainties proposed in previous studies. Establishing precise depth estimates for tectonic tremors beneath Kyushu, which results from shear slip along the plate interface, is useful in defining the plate interface within the Nankai subduction zone.
Key words:Tectonic tremor, Kyushu, subduction,S-Ptimes, cross-correlation, plate interface.
1.
Introduction and Tectonic Setting
In the Nankai subduction zone, western Japan, the Philip-pine Sea (PHS) plate is subducting beneath the Eurasian (or Amurian) plate at a relative plate velocity of 6–7 cm/yr (Wei and Seno, 1998). At this location, the age of the subduct-ing PHS plate is 30–17 Ma. Farther to the west, the Nankai subduction zone continues off to the south of Kyushu Island (Fig. 1(a)), where the age of the subducting plate is 60–40 Ma. The subducting Kyushu-Palau ridge (KPR) (Park et al., 2009) (Fig. 1(a)) forms a tectonic boundary within the subducting plate that comprises a remnant arc, which is rel-atively buoyant and less dehydrating than the surrounding oceanic plate.
Tectonic tremors within the Nankai subduction zone were first documented by Obara (2002), and they are of-ten accompanied by slow slip events (SSEs) and consid-ered to represent shear slip within the transition zone be-tween stick-slip and stable slip along the plate interface, based on their locations and focal mechanisms (e.g., Shelly
et al., 2006, 2007; Ide et al., 2007). Fluids released by the dehydration of a subducting slab are thought to occur at high pore pressures in areas of tremor sources (Shellyet al., 2006), thereby reducing the effective normal stress and enhancing the sensitivity of tremor activity to tidal stresses and large surface waves. For recent reviews of tremor char-acteristics, see Rubinsteinet al.(2010), Obara (2011), and Beroza and Ide (2011).
Copyright cThe Society of Geomagnetism and Earth, Planetary and Space Sci-ences (SGEPSS); The Seismological Society of Japan; The Volcanological Society of Japan; The Geodetic Society of Japan; The Japanese Society for Planetary Sci-ences; TERRAPUB.
doi:10.5047/eps.2012.06.001
The distribution of tremor in the Nankai subduction zone terminates at the Bungo channel, across which several char-acteristics of the subduction zone change dramatically, in-cluding seismicity, volcanic activity, and the geometry and age of the subducting plate. The relatively young and warm PHS plate within the Nankai subduction zone must exist at the required conditions to enable tremor activity, because both slip transition and active dehydration in the subduct-ing slab occur at shallower regions of the plate interface. In contrast, the occurrence of tremor activity is not favored by the relatively old plate being subducting south of Kyushu. Nevertheless, the Japan Meteorological Agency (JMA) de-tected and located two low-frequency earthquakes (LFEs) at a forearc region in the southern Kyushu area (Fig. 1(b)) during a routine analysis, implying the existence of tectonic tremor activity in the area. Ide (2012) reported such tremor activity in this region. The main focus of the present study is to conduct a more detailed investigation of tremor activ-ity in the southern Kyushu area and to accurately constrain the depth of these seismic events.
2.
Detection and Hypocenter Determination of
Tremor Events
2.1 Detection and location of tremors by automated analysis
To detect and locate tremor sources, we used the enve-lope correlation method (Obara, 2002; Wech and Creager, 2008; Ide, 2010, 2012). The original datasets that we ac-quired comprise continuous velocity seismograms in two horizontal components recorded at 24 seismic stations of the Hi-net network of the National Research Institute for Earth Science and Disaster Prevention, Japan (Fig. 1(a));
18 S. YABE AND S. IDE: DEEP TREMOR ON THE PLATE INTERFACE BENEATH KYUSHU
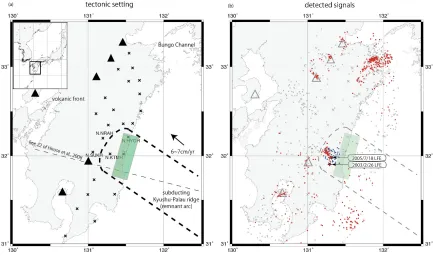
Fig. 1. Map views of Kyushu. (a) Tectonic setting of Kyushu. Triangles represent active volcanoes, and black crosses indicate the locations of Hi-net seismic stations used in this study. The thick dashed line demarcates the geographical extent of the KPR (Parket al., 2009). The thin dashed line represents the position of a cross-section presented by Hiroseet al.(2008), which is shown in Fig. 5(b). The black arrow indicates the velocity and movement direction of the subducting plate. The green rectangular area represents a horizontal projection of the source fault of SSEs, as proposed by Yarai and Ozawa (2010). (b) Distribution of detected seismic events (red dots) picked up by both the duration (>30 s) and the power spectrum ratio (>10). The two red stars are the LFEs detected by JMA. The blue dots are intra-slab earthquakes located by JMA and used in this study. Distribution of seismic events picked up based solely on duration are shown as a grey dot.
the data were recorded at 100 samples per second (sps). The data were bandpass filtered between 2 and 8 Hz, converted to envelope waveforms, low-pass filtered below 0.2 Hz, re-sampled at 2 sps, and then divided into half-overlapping 300 s time windows. For each time window, we calcu-lated cross-correlation coefficients between stations, and if the maximum value of the coefficients exceeds 0.6 for more than 40 station pairs, we would then try to locate the source using a horizontally-layered velocity structure constrained by the results of S-wave tomography (Saiga et al., 2010) (Table 1). If the standard deviation of misfits between the observed and calculated arrival time lags was larger than 1.0 s, we rejected the result. Otherwise, to distinguish tremor events from ordinary earthquakes or, alternatively, analytical artifacts due to background noise, we rejected all tremor events with a duration of less than 30 s, calculated as a half-value width of the stacked envelope aligned along the synthetic travel time. Additional details of the hypocen-ter detection and event rejection schemes can be found in Ide (2010, 2012). Throughout the data collection period, from April 2004 to September 2009, we detected and lo-cated 2097 tremor events (Fig. 1(b)).
As an extension of this method of tremor detection and location, we also compared the power spectrum ratios ob-served for each set of data—i.e., the ratio of the mean power at low frequencies (2–8 Hz) to the mean power at high fre-quencies (10–20 Hz) calculated from the original 100 sps data—based on the fact that tremors have a stronger power at low frequencies (Shellyet al., 2006). If the average of the spectrum ratios for all stations within 50 km of each
Table 1. The 1D velocity structure used in this study, following Saigaet al.(2010).
Depth (km) S-wave velocity (km/s) P-wave velocity (km/s)
0–5 3.2 5.5
5–10 3.4 5.8
10–20 3.7 6.3
20–30 4.1 6.9
30–35 4.3 7.6
35–50 4.5 7.9
50–75 4.6 7.9
75– 4.7 8.1
epicenter is higher than 10, the signal is ultimately con-sidered to be a tremor. As a result of employing this new criterion, most of the detected events were rejected as ei-ther earthquakes or artifacts of background noise. How-ever, 488 ‘genuine’ tremor events were successfully picked up (Fig. 1(b)). By comparing the red dots and grey dots in Fig. 1(b), the scattered events that are usually considered to represent either normal earthquakes occurring outside of the station distribution or analytical artifacts originating from background noise are removed, whereas clustering events, which usually represent genuine tremor events, are not re-moved by this method.
S. YABE AND S. IDE: DEEP TREMOR ON THE PLATE INTERFACE BENEATH KYUSHU 19
Fig. 2. (a) Examples of tremor waveforms. (b) Power spectrum of noise (blue), ordinary earthquakes (black), and tremors (red). (c) Event times (dots) of tremor and SSE times (pink arrows) (Yarai and Ozawa, 2010) for the whole period (top) and a period of 3 days (bottom). The timing of ordinary earthquakes (Mw>5) worldwide is compared in the lower layer.
Another notable tremor cluster, comprising 46 individual tremor events, exists in southeastern Kyushu, where two LFEs and the tremor activities were reported separately by JMA and Ide (2012), respectively. Figure 2 shows repre-sentative examples of waveforms, the power spectrum, and time sequences of tremor events. Although the amplitude of tremor signals (∼100 nm/s) in Kyushu is not as large as those in Nankai, which makes tremor detection and loca-tion more difficult, the shape of the power spectrum is re-markably different from that of typical earthquakes near the tremor source area. The number of detected tremor events, 46 events in 66 months, is much smaller than that detected in Nankai. Although the tremor activity recorded shows some regularity, with a noticeable recurrence at almost ev-ery 8 months, evidence of tidal modulation is not apparent. Notably, the active periods of tremor activity identified in this study are not coincident with teleseismic large earth-quakes (Mw>5) in the Harvard CMT catalog (Fig. 2(c)).
2.2 Accurate estimation of tremor depths
Although the automated detection method described above can be used to estimate the depth of tremor events, it uses onlyS-waves, and, ultimately, these absolute depth determinations are relatively imprecise. A better constraint on the absolute depth of tremor events is provided by the
S-P times for events occurring immediately beneath the
observation network, as demonstrated by La Roccaet al.
(2009) in the Cascadia subduction zone. At some sta-tions in Kyushu, P-waves are often visible in the verti-cal component, whileS-waves are dominant in all compo-nents. Therefore, we can measureS-P times from cross-correlation functions between vertical and horizontal seis-mograms. At one station, two 40 s velocity seismograms, in both vertical and horizontal directions, are bandpass filtered between 2 and 8 Hz, converted into envelope waveforms, and smoothed by using a running average over 15 samples. The direction of the horizontal waveform, which is N20◦W in this study, is chosen asP-Speaks, explained in the next paragraph, can be seen most clearly by testing some direc-tions. In addition, we calculated a cross-correlation func-tion for each dataset, changing the time lag between two envelope waveforms from−20 to 20 s.
20 S. YABE AND S. IDE: DEEP TREMOR ON THE PLATE INTERFACE BENEATH KYUSHU
Fig. 3. Examples of vertical and horizontal waveforms, and the cross-correlation functions between envelopes of them at station N.NRAH. The 600 s records are divided into half-overlapping time windows of 40 s. Tremors are active in the pink and blue rounded rectangular boxes in the vertical and horizontal panels, respectively. The right bottom panel shows the stacked function. Blue and pink dashed lines showS-SandP-Speaks, respectively.
clearly distinguishable peaks that are used to measure theS -Ptime, which in this example is precisely 4.8 s. The uncer-tainty of this measurement is considered in this study to be equal to the half-value width of stackedP-Speaks. TheS -Ptime lag is converted to the absolute depth using the epi-central distance and the travel timetable calculated using the 1D velocity structure in Table 1 (Fig. 4(c)). For the example shown in Fig. 3, the estimated tremor depth is 42±5 km. This method works especially well for one station in partic-ular (N.NRAH) among the several that we tested, probably because of the radiation pattern of the tremor. Therefore, in this study we discuss the depths of several tremor events using data from this one seismic station only.
Figure 4 summarizes the results of our depth estimations for tremor events. All of the S-P times estimated for a large number of tremor sequences are between 4.5 and 5.0 s (Fig. 4(a)), which suggests that the depths of all of these recorded tremor events are distributed over a narrow range. We also calculated S-P times for some intra-slab earth-quakes that occurred near the recorded tremor events, and obtained cross-correlation functions with two distinct peaks separated by about 6.3–7.4 s (Fig. 4(b)). Notably, these cal-culatedS-Ptimes are consistent with the visual readings of
S-Ptimes. The observed difference in correlation functions is a reflection of the difference in depths between the tremor events and the intra-slab earthquakes, which rules out the possibility that these peaks result from some local struc-ture around the station. The depths of the recorded tremor events and intra-slab earthquakes are estimated to be 35–45 km and 55–65 km, respectively (Fig. 4(c)), the latter being consistent with depth estimations for intra-slab earthquakes determined in previous studies (Hiroseet al., 2008; Tahara et al., 2008).
3.
Discussion
S. YABE AND S. IDE: DEEP TREMOR ON THE PLATE INTERFACE BENEATH KYUSHU 21
Fig. 4. (a) Stacked cross-correlation functions of different tremor events. (b) Cross-correlation coefficients of intra-slab earthquakes shown in Fig. 1(b). (c) Relations betweenS-Ptime and the source depth calculated using the 1D velocity structure (Table 1) for different epicentral distances. The distributions of tremor events and intra-slab earthquakes are shown by pink and blue crosses, respectively, with error bars calculated as the half-value width of cross-correlation functions for tremors, and visual reading errors for intra-slab earthquakes.
the depth of one of these LFEs (July 18, 2005) and our esti-mated locations of tremor sources were both derived using
our method which employs measuredS-Ptimes, which
col-lectively yield a precise depth of about 40 km—i.e., about 20 km above intra-slab earthquakes and consistent with the shallower plate boundary proposed by Yagi and Kikuchi (2003).
Here, it is important to highlight that the seismic
tomo-graphic image of Hiroseet al.(2008) shows a sharp
bound-ary between high- and low-Vp/Vsregions (thin dashed line
in Fig. 5(b)), located close to our estimated tremor sources and again about 20 km above intra-slab earthquakes. There-fore, we consider this boundary to represent the plate
inter-face beneath Kyushu Island, with all intra-slab earthquakes occurring on, or below, the oceanic Moho. The separation of up to 20 km between the plate interface and the oceanic Moho appears to be somewhat large, but this may reflect the subduction of the anomalously thick crust of the KPR. An-other relevant observation is that a region with a high Pois-son ratio occurs near the tremor sources identified in this study (see Fig. 5(a)), which is interpreted as evidence for the
existence of fluids. In addition, Yoshiokaet al.(2008)
esti-mated the thermal structure of the Kyushu subduction zone,
indicating that temperatures are about 350–400◦C near the
22 S. YABE AND S. IDE: DEEP TREMOR ON THE PLATE INTERFACE BENEATH KYUSHU
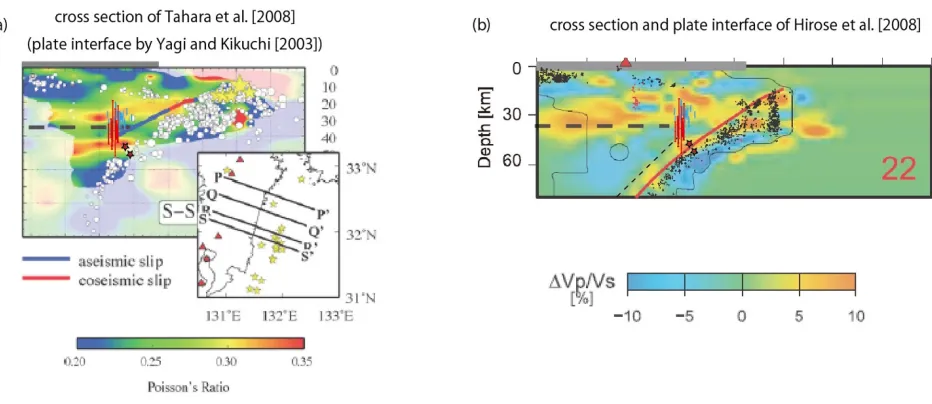
Fig. 5. (a) Cross-section of Poisson’s ratio structure near the tremor source area, after Taharaet al.(2008). The gray rectangle at the top of the cross-section represents land area. The black dashed line represents the Moho discontinuity. The red and blue lines demarcate the plate boundary estimated by Yagi and Kikuchi (2003), showing co-seismic, and aseismic, slip, respectively. The white dots indicate the distribution of ordinary earthquakes. Tremor distribution is superimposed. The red and blue bars are the estimated depth of tremors based onS-Ptimes, and based on the envelope correlation method, respectively. The two red stars indicate the hypocenters of LFEs relocated by Yoshiokaet al.(2008). (b) Cross-section ofVp/Vsdistribution near the tremor source area, after Hiroseet al.(2008). The gray rectangle at the top of the cross-section represents land area.
The red triangle indicates the location of an active volcano. The red line demarcates the plate interface estimated by Hiroseet al.(2008). Black dots indicate the distribution of ordinary earthquakes. Red dots are LFEs, including volcanic ones, detected by JMA and relocated by Hiroseet al.(2008). The thick dashed line represents the Moho discontinuity. The thin dashed line represents the boundary between low- and high-Vp/Vszones. Tremor
distribution is also superimposed as for (a). (Reprinted fromPhys. Earth Planet. Inter.,167, M. Taharaet al., Seismic velocity structure around the Hyuganada region, Southwest Japan, derived from seismic tomography using land and OBS data and its implications for interplate coupling and vertical crustal uplift, 19–33, Copyright (2008), with permission from Elsevier.)
In the Hyuga-nada region, offshore of the main location of Kyushu tremor activity, the afterslip of the 1996 (Yagi et al., 1999) Hyuga-nada earthquakes and faint SSEs have both been observed, and their source region is estimated to be at slightly shallower depths than the tremor events be-neath Kyushu (Figs. 1(a), 5(a)) (Yagi and Kikuchi, 2003; Yarai and Ozawa, 2010). The amplitude of these Hyuga-nada SSEs is smaller than the amplitude of the SSEs served in the Nankai region; i.e., it is similar to the ob-served differences in tremor activities between the two re-gions. However, the time constants of SSEs, and the ∼2 year recurrence interval and∼1 year duration of SSEs, are not consistent with comparable data on tremors detected in this study, which revealed an 8 month recurrence interval and a duration of only a few days. Nevertheless, based on all of these arguments and geophysical constraints, we con-clude that the plate boundary beneath Kyushu exists at a depth of 40 km, and the tremor activity recorded in this study is interpreted to represent shear slip along the plate interface.
Also of note is the fact that tremor activity detected in Kyushu is spatially localized. The narrowness of the tremor source along the dip direction could be related to the steep-ness of the subducting PHS plate, which results in a rapid increase in temperature and a corresponding rapid transition from stick-slip to stable slip along the plate interface. The distribution of tremors along strike seems to coincide with the location of the KPR, which is a remnant arc that is con-sidered to have undergone a comparatively small amount of dehydration during subduction compared with the sur-rounding oceanic plate. Within the Nankai subduction zone,
a relatively inactive tremor zone identified previously is in-terpreted as a result of ridge subduction (Matsubaraet al., 2009). Therefore, the coincidence between tremor activity and the KPR determined in this study appears to contra-dict some previous views and geophysical models of the region. However, additional studies are needed to examine the effects of ridge subduction on fluid distribution, thermal structure, and other important geological and geophysical factors linked with tremor generation.
4.
Conclusions
In southern Kyushu, we recorded tectonic tremor events that exhibit a recurrence interval of about 8 months, spaced closely along the down-dip direction of small SSEs and their associated source fault (Yarai and Ozawa, 2010), and laterally distributed across the region where the KPR is be-ing subducted (Parket al., 2009). The depth of this tremor activity is estimated to be 35–45 km, based on tremorS -P times, which is consistent with the location of the plate boundary estimated by Yagi and Kikuchi (2003) and is co-incident with a sharp boundary in theVp/Vs structure
S. YABE AND S. IDE: DEEP TREMOR ON THE PLATE INTERFACE BENEATH KYUSHU 23
to constrain the location and geometry of the plate inter-face in the Kyushu region. In future geophysical studies of the area, it will be important to consider the effects of sub-duction of the KPR (a remnant arc) on the mechanisms of tremor activity. In this regard, it seems clear that suitable conditions for tremor activity in southern Kyushu would lo-cally be realized due to ridge subduction, although the
in-fluence of subduction of the KPR on the process of tremor generation in the region has yet to be explored.
Acknowledgments. All of the data in this study were obtained from the NIED Hi-net data server. We thank H. Yarai for SSE data. This manuscript has been improved by helpful comments of two anonymous reviewers. This work was supported by JSPS KAKENHI (23244090) and MEXT KAKENHI (21107007).
References
Beroza, G. C. and S. Ide, Slow earthquakes and non-volcanic tremor,
Ann. Rev. Earth Planet. Sci.,39, 271–296, doi:10.1146/annurev-earth-040809-152531, 2011.
Hirose, F., J. Nakajima, and A. Hasegawa, Three-dimensional seismic ve-locity structure and configuration of the Philippine Sea slab in south-western Japan estimated by double-difference tomography,J. Geophys. Res.,113, B09315, doi:10.1029/2007JB005274, 2008.
Ide, S., Striations, duration, migration, and tidal response in deep tremor,
Nature,466, 356–359, 2010.
Ide, S., Variety and spatial heterogeneity of tectonic tremor worldwide,J. Geophys. Res., doi:10.1029/2011JB008840, 2012.
Ide, S., D. R. Shelly, and G. C. Beroza, The mechanism of deep low frequency earthquakes: Further evidence that deep non-volcanic tremor is generated by shear slip on the plate interface,Geophys. Res. Lett.,34, L03308, doi:10.1029/2006GL028890, 2007.
La Rocca, M., K. C. Creager, D. Galluzzo, S. D. Malone, J. E. Vidale, J. R. Sweet, and A. G. Wech, Cascadia tremor located near plate in-terface constrained by S minus P wave times,Science,323, 620–623, doi:10.1126/science.116711, 2009.
Matsubara, M., K. Obara, and K. Kasahara, Three-dimensional P- and S-wave velocity structures beneath the Japan Islands obtained by high-density seismic stations by seismic tomography,Tectonophysics,472, 6–17, 2009.
Obara, K., Nonvolcanic deep tremor associated with subduction in south-west Japan,Science,296, 1679–1681, 2002.
Obara, K., Characteristics and interactions between non-volcanic tremor and related slow earthquakes in the Nankai subduction zone, southwest
Japan,J. Geodyn.,52, 229–248, 2011.
Park, J.-O., T. Hori, and Y. Kaneda, Seismotectonic implications of the Kyushu-Palau ridge subducting beneath the westernmost Nankai fore-arc,Earth Planets Space,61, 1013–1018, 2009.
Rubinstein, J. L., D. R. Shelly, and W. L. Ellsworth, Non-volcanic tremor: a window into the roots of fault zones, inNew Frontiers in Integrated Solid Earth Sciences, edited by S. Cloetingh and J. Negendank, pp. 287–
314, Dordrecht, Springer, 2010.
Saiga, A., S. Matsumoto, K. Uehira, T. Matsushima, and H. Shimizu, Velocity structure in the crust beneath the Kyushu area,Earth Planets Space,62, 449-462, 2010.
Shelly, D. R., G. C. Beroza, S. Ide, and S. Nakamula, Low frequency earthquakes in Shikoku, Japan, and their relationship to episodic tremor and slip,Nature,442, 188–191, 2006.
Shelly, D. R., G. C. Beroza, and S. Ide, Non-volcanic tremor and low-frequency earthquakes swarms,Nature,446, 305–307, 2007.
Tahara, M., K. Uehira, H. Shimizu, M. Nakada, T. Yamada, K. Mochizuki, M. Shinohara, M. Nishino, R. Hino, H. Yakiwara, H. Miyamachi, K. Umakoshi, M. Goda, N. Matsuwo, and T. Kanazawa, Seismic velocity structure around the Hyuganada region, Southwest Japan, derived from seismic tomography using land and OBS data and its implications for interplate coupling and vertical crustal uplift,Phys. Earth Planet. Inter.,
167, 19–33, 2008.
Wech, A. G. and K. C. Creager, Automated detection and lo-cation of Cascadia tremor, Geophys. Res. Lett., 35, L20302, doi:10.1029/2008GL035458, 2008.
Wei, D. and T. Seno, Determination of the Amurian plate motion, inMantle Dynamics and Plate Interactions in East Asia, Geodyn. Ser., vol. 27, edited by M. F. J. Floweret al., pp. 337–346, AGU, Washington, D.C., 1998.
Yagi, Y. and M. Kikuchi, Partitioning between seismogenic and aseismic slip as highlighted from slow slip events in Hyuga-nada, Japan, Geo-phys. Res. Lett.,30(2), 1087, 2003.
Yagi, Y., M. Kikuchi, and S. Yoshida, Comparison of the co-seismic rup-ture with the aftershock distribution in the Hyuga-nada earthquake of 1996,Geophys. Res. Lett.,26, 3161–3164, 1999.
Yarai, H. and S. Ozawa, Repeating slow slip events in the Hyuga-nada, pre-sented at the seismological society of Japan fall meeting, 2010 (English title and Japanese abstract).
Yoshioka, S., M. Toda, and J. Nakajima, Regionality of deep low-frequency earthquakes associated with subduction of the Philippine Sea plate along the Nankai Trough, southwest Japan,Earth Planet. Sci. Lett.,
272, 189–198, 2008.