FULL PAPER
Coseismic and postseismic deformation
associated with the 2016 Mw 7.8 Kaikoura
earthquake, New Zealand: fault movement
investigation and seismic hazard analysis
Zhongshan Jiang, Dingfa Huang
*, Linguo Yuan, Abubakr Hassan, Lupeng Zhang and Zhongrong Yang
Abstract
The 2016 moment magnitude (Mw) 7.8 Kaikoura earthquake demonstrated that multiple fault segments can undergo rupture during a single seismic event. Here, we employ Global Positioning System (GPS) observations and geodetic modeling methods to create detailed images of coseismic slip and postseismic afterslip associated with the Kaik-oura earthquake. Our optimal geodetic coseismic model suggests that rupture not only occurred on shallow crustal faults but also to some extent at the Hikurangi subduction interface. The GPS-inverted moment release during the earthquake is equivalent to a Mw 7.9 event. The near-field postseismic deformation is mainly derived from right-lateral strike-slip motions on shallow crustal faults. The afterslip did not only significantly extend northeastward on the Needles fault but also appeared at the plate interface, slowly releasing energy over the past 6 months, equivalent to a Mw 7.3 earthquake. Coulomb stress changes induced by coseismic deformation exhibit complex patterns and diversity at different depths, undoubtedly reflecting multi-fault rupture complexity associated with the earthquake. The Coulomb stress can reach several MPa during coseismic deformation, which can explain the trigger mechanisms of afterslip in two high-slip regions and the majority of aftershocks. Based on the deformation characteristics of the Kaikoura earthquake, interseismic plate coverage, and historical earthquakes, we conclude that Wellington is under higher seismic threat after the earthquake and great attention should be paid to potential large earthquake disasters in the near future.
Keywords: Kaikoura earthquake, Multi-fault rupture, Coseismic deformation, Aseismic afterslip, Seismic hazard
© The Author(s) 2018. This article is distributed under the terms of the Creative Commons Attribution 4.0 International License (http://creativecommons.org/licenses/by/4.0/), which permits unrestricted use, distribution, and reproduction in any medium, provided you give appropriate credit to the original author(s) and the source, provide a link to the Creative Commons license, and indicate if changes were made.
Open Access
*Correspondence: dfhuang@swjtu.edu.cn
Faculty of Geosciences and Environmental Engineering, Southwest Jiaotong University, Chengdu 611756, China
Introduction
On November 13, 2016, a destructive earthquake with Mw 7.8 struck the Kaikoura region, South Island, New Zealand, which triggered large-scale crustal deformation
(Hamling et al. 2017), thousands of landslides (Gorum
and Yildirim 2017), and a widespread tsunami (Power
et al. 2017). The earthquake rupture was initiated in
North Canterbury and propagated more than 170 km northward along at least 12 separate faults (Bradley et al.
2017; Hamling et al. 2017; Kaiser et al. 2017).
Geologi-cal field investigations and seismologiGeologi-cal and geodetic
constraints show that the Kaikoura earthquake was an extraordinarily complex multi-fault rupture incident
(Duputel and Rivera 2017; Hamling et al. 2017;
Hollings-worth et al. 2017; Shi et al. 2017; Zhang et al. 2017).
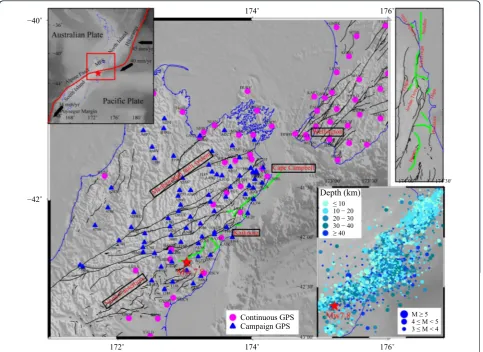
The complex tectonic setting of New Zealand contrib-uted to the occurrence of the 2016 Mw 7.8 multi-fault rupture event. Tectonically, New Zealand, consisting of the South and North islands, is dominated by oblique convergence of the Australian and Pacific plates at
rates of 39–48 mm/year (Fig. 1; Beavan et al. 2016). The
Hikurangi subduction zone on the North Island accom-modates most of the relative plate convergence (Nicol
and Beavan 2003), whereas oblique-dextral
(Norris and Cooper 2007). In addition, the tectonics of southwestern New Zealand are dominated by oblique convergence at the Puysegur subduction interface, where the Mw 7.8 Dusky Sound earthquake occurred on July
15, 2009 (Beavan et al. 2010). New Zealand’s tectonics
are incredibly active, and interseismic accumulated strain is released by various mechanisms such as
instantane-ous earthquake ruptures (Beavan et al. 2010; Elliott et al.
2012), volcanic explosions (Chardot et al. 2015; Kilgour
et al. 2016), ongoing postseismic mechanisms (Motagh
et al. 2014), and aseismic slow-slip events (SSEs;
McCaf-frey et al. 2008; Wallace and Beavan 2006).
The 2016 Kaikoura earthquake took place in an extremely complex and active tectonic environment, destroying two distinguishing seismotectonic domains
(Fig. 1) including the contractional North Canterbury
fault zone and dominantly strike-slip Marlborough
fault system (Hamling et al. 2017). Seismological
stud-ies indicate that the coseismic rupture included at least three distinct southwest–northeast-propagating phases
(Kaiser et al. 2017). Geodetic and geological evidence
reveals highly complex surface deformation character-istics associated with the 2016 Kaikoura earthquake, mainly showing right-lateral oblique-slip motion in the North Canterbury region and dominantly right-lateral strike-slip motion in the Marlborough fault zone
(Hamling et al. 2017). The earthquake caused
consider-able coseismic deformation, more than 10 m horizontal deformation along multiple faults, and ~ 8 m uplift of the
Papatea fault-bounded block (Hamling et al. 2017; Kääb
et al. 2017; Shi et al. 2017). The Kaikoura earthquake also
triggered highly variable coastal deformation, reflecting
172˚ 174˚
174˚
176˚ 176˚
−42˚ −40˚
Continuous GPS Campaign GPS
174˚00 174˚30'
Depth (km)
Μ ≥ 5 4 ≤ Μ < 5 3 ≤ Μ < 4 ≤ 10
10 − 20 20 − 30 30 − 40 ≥ 40
the rupture complexity along a transpressional plate
boundary (Clark et al. 2017). Seismological and geodetic
inversion models indicate that coseismic rupture not only occurred on shallow crustal faults but also at the Hikurangi subduction interface with small-scale
thrust-ing-dominated movements (Hamling et al. 2017; Holden
et al. 2017). Clustered aftershocks were mainly
concen-trated in mainshock rupture regions (Fig. 1), showing a
mixture of reverse and strike-slip faulting across three
dominant spatial clusters (Kaiser et al. 2017). Widespread
slow-slip movements in two known regions offshore the east coast of the North Island and beneath the Kapiti region and in a slow-slip region in the subduction zone beneath the upper South Island were immediately trig-gered by the Kaikoura earthquake and continued over a
period of weeks to months (Wallace et al. 2017).
Previous studies illuminated the complexity of the 2016 Mw 7.8 multi-fault rupture using geodetic, seismologi-cal, and geological observations. However, ongoing fault movements should be investigated to assess the poten-tial earthquake risk in New Zealand. In our study, we use Global Positioning System (GPS) observations to con-struct a coseismic model with six-segment geometry and preliminarily investigate the postseismic 6-month defor-mation. Coulomb stress changes due to coseismic and postseismic fault slip are also investigated. Our extensive analysis of complex fault interactions and the kinemat-ics of the multi-fault rupture contributes to clarifying the seismogenic patterns and occurrence mechanisms, assessing the seismic hazard, and estimating the earth-quake magnitude.
Data
Data collection
The GeoNet (https://www.geonet.org.nz/), based on a
collaboration between the Science and Earthquake Com-mission and the Institute of Geological and Nuclear Sci-ences (GNS) with funding from Land Information New
Zealand (Hamling et al. 2017), has been used to monitor
geological disasters in New Zealand such as earthquakes, volcanic activities, massive landslides, tsunamis, and slow-slip events (SSEs). In our study, we only consider GPS observations from GeoNet to construct seismic geo-detic inversion models and investigate fault movements during the coseismic and postseismic phases of the Kaik-oura earthquake.
The coseismic deformation is investigated using a superset of GPS-determined surface coseismic offsets
from previous studies (Hamling et al. 2017) including
191 continuous and 80 campaign stations. These obser-vations and that of more than 100 International Global Navigation Satellite System (GNSS) Service (IGS) refer-ence stations were processed using the GPS Analysis at
Massachusetts Institute of Technology/Global Kalman filter (GAMIT/GLOBK, version 10.60) software; final sta-tion coordinates were projected in the Internasta-tional Ter-restrial Reference Frame 2014 (ITRF14). The coseismic offsets at continuous GPS stations were estimated using observations made 5 days prior to and 12 h following the earthquake, whereas the campaign GPS observations (available since 1999) made days (near field) to weeks (far field) after the earthquake in the northern part of the
South Island were remeasured (Hamling et al. 2017).
Only available continuous GeoNet GPS stations were chosen to examine the postseismic deformation of the Kaikoura earthquake. Daily GeoNet GPS time series in the IGS08 reference frame including GPS data pro-cessed using the GNSS-Inferred Positioning System and Orbit Analysis Simulation Software (GIPSY-OASIS-II 6.1.1) are available from the Nevada Geodetic
Labora-tory, University of Nevada, Reno (NGL/UNR, http://
geodesy.unr.edu/, last accessed on May 20, 2017). The
data analysis (http://geodesy.unr.edu/gps/ngl.acn.txt) was
based on the final, non-fiducial daily products from the Jet Propulsion Laboratory (JPL) archive including satel-lite orbit and clock estimates, wide-lane and phase bias estimates, Earth orientation parameters, and an IGS antenna calibration file. The tropospheric refractivity was modeled using the global mapping function (GMF); the first-order ionospheric effects were removed by applying ionosphere-free combinations of both carrier phase and pseudo-range measurements, and the ocean tidal load-ing effects were corrected usload-ing the tidal model FES2004 (Finite element solutions, 2004).
Postseismic signal extraction
We only utilized GPS stations of a region with a longi-tude range of 170.2°E–176.5°E and latilongi-tude range of 40.0°S–44.0°S, considering insignificant contributions of postseismic fault movements to the deformation of GPS observations away from mainshock rupture regions. We used a general expression for the time-series function
[Eq. (1)] to parameterize multi-various signal
constitu-ents (such as tectonic motion mechanisms, hydrological loading effects, atmospheric refraction delays, and other factors) and applied the least squares fitting algorithm to
extract postseismic signals (Jiang et al. 2017):
where ti is the ith daily epoch (unit: year); y0 is the
nomi-nal position; v is the linear trend term; A and φ are the
(1)
y(ti)=y0+vti+
2
b=1
Absin(2bπti+ϕb)+ k
j=1
H(ti−toj)Oj
+
m
l=1
H(ti−tql)
cl+plln(1+(ti−tql)/τllog)
amplitude and initial phase of annual and semiannual
sinusoidal terms, respectively; O is the offset caused by
non-seismic sources; c, p, and τlog are the coseismic
off-set, postseismic amplitude, and relaxation time,
respec-tively; to and tq are the occurrence epochs related to
non-seismic and seismic sources, respectively; H is the
step function; and ε is the error term.
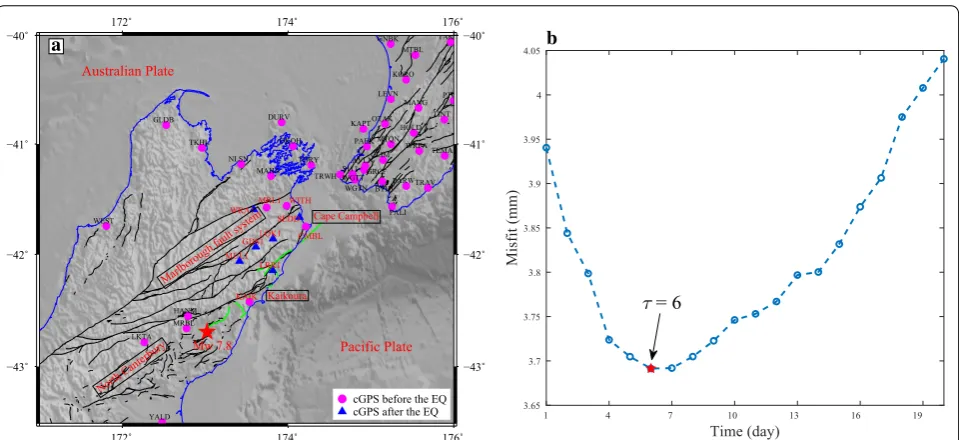
We performed four steps to gain the postseismic deformation field: (1) calculating the interseismic veloc-ity field of the 53 continuous GPS stations (Additional
file 1: Table S1) using least squares fitting. Most of these
stations witnessed interseismic, coseismic, and post-seismic deformation; (2) interpolating the interpost-seismic
3-D velocities of the six stations (Fig. 2a and Additional
file 1: Table S1) installed after the mainshock based on
the velocity interpolation for stain rate (VISR) software
(Shen et al. 2015); (3) identifying the optimal logarithmic
relaxation time based on ten stations (Fig. 2a) with good
signal-to-noise ratios. The optimal logarithmic relaxation
constant was inferred to be 6 days in our study (Fig. 2b);
(4) estimating the logarithmic amplitudes for the north, east, and up directions of all stations. Finally, we chose
57 stations (Additional file 1: Table S2) to investigate the
postseismic afterslip during the first 6-month period.
Coseismic and postseismic deformation fields
A superset of GPS coseismic observations from Hamling
et al. (2017) reliably captured abundant surface
deforma-tion characteristics in response to complex multi-fault ruptures. Campaign GPS stations made up the deficiency
in the spatial coverage of the measurements in the main-shock regions in which only few continuous GPS stations
are distributed in the near field (Fig. 1). Investigation of
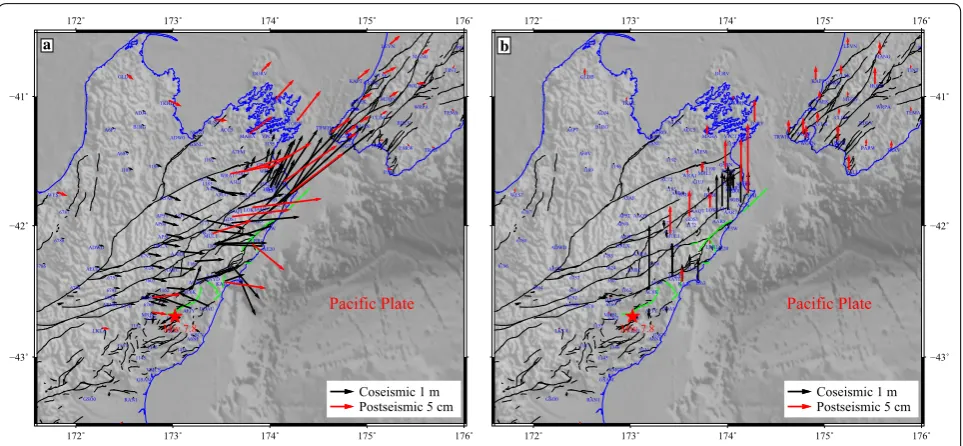
the static coseismic deformation suggests that the Kaik-oura earthquake mainly destroyed two distinct tectonic domains, showing right-lateral oblique-slip movements in the North Canterbury region and dominantly right-lateral strike-slip motions in the Marlborough fault
system (Fig. 4a). Continuous and campaign GPS
observa-tions indicate more than 6 m of lateral movement near Cape Campbell. Coseismic uplift occurred in the vicinity of Kaikoura and Cape Campbell. Regions of subsidence are observed in North Canterbury, near the epicenter and in the mid–far field of coseismic deformation in the Marlborough fault system. The GPS-derived coseismic deformation shows that horizontal northeastward peak motions can reach 6.1 m at the station AAR8, whereas the maximum vertical uplift reaches 2.7 m at the station AC6K.
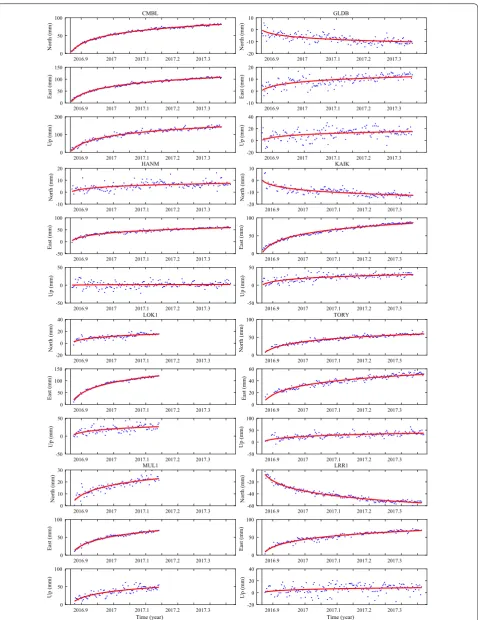
Postseismic afterslip started immediately after the earthquake and decayed rapidly during the first 6-month
postseismic period. Figure 3 shows the postseismic GPS
coordinate time series with long-term trends and sea-sonal signals corrected, which fit logarithmic decay function models well and are typically dominated by time-dependent, stress-driven afterslip following moder-ate or massive earthquakes. Regarding surface movement patterns, postseismic horizontal deformation exhibits
coseismic deformation patterns (Fig. 4) and shows much
greater spatial-scale wavelengths. In addition to larger
AVLN
BTH1 CLIM DURV
GLDB
GNBK
GRCF
HANM
HOLD KAPT
KORO
LEVN
LKTA
MAHA
MANG
MRBL
MTBL
MTQN
NLSN OKOH
OTAK
PAEK
PALI PARW
PTO
S111
TAK
TEMA TINT
TKHL
TORY
TRAV TRWH
WEST
WGTN WGTT
WRPA
YALD
WITH
CMBL
KAIK MRL1
GDS1LOK1
LRR1 MUL1
SEDD WRA1
Mw 7.8 Pacific Plate Australian Plate
Cape Campbell
Kaikoura Marlborough fault system
North Canterbury
cGPS before the EQ cGPS after the EQ a
1 4 7 10 13 16 19
Time (day) 3.65
3.7 3.75 3.8 3.85 3.9 3.95 4 4.05
Misfit (mm)
= 6
b
2016.9 2017 2017.1 2017.2 2017.3 0
50 100
North (mm)
CMBL
2016.9 2017 2017.1 2017.2 2017.3
0 50 100 150
East (mm)
2016.9 2017 2017.1 2017.2 2017.3
0 100 200
Up (mm)
2016.9 2017 2017.1 2017.2 2017.3
-20 -10 0 10
North (mm)
GLDB
2016.9 2017 2017.1 2017.2 2017.3
-10 0 10 20
East (mm)
2016.9 2017 2017.1 2017.2 2017.3
-20 0 20 40
Up (mm)
2016.9 2017 2017.1 2017.2 2017.3
-10 0 10 20
North (mm)
HANM
2016.9 2017 2017.1 2017.2 2017.3
-50 0 50 100
East (mm)
2016.9 2017 2017.1 2017.2 2017.3
-50 0 50
Up (mm)
2016.9 2017 2017.1 2017.2 2017.3 -20
-10 0 10
North (mm)
KAIK
2016.9 2017 2017.1 2017.2 2017.3 0
50 100
East (mm)
2016.9 2017 2017.1 2017.2 2017.3 -50
0 50
Up (mm)
2016.9 2017 2017.1 2017.2 2017.3 -60
-40 -20 0
North (mm)
LRR1
2016.9 2017 2017.1 2017.2 2017.3 0
50 100
East (mm)
2016.9 2017 2017.1 2017.2 2017.3 Time (year)
-20 0 20 40
Up (mm)
2016.9 2017 2017.1 2017.2 2017.3 0
50 100
North (mm)
TORY
2016.9 2017 2017.1 2017.2 2017.3 0
20 40 60
East (mm)
2016.9 2017 2017.1 2017.2 2017.3 -50
0 50 100
Up (mm)
2016.9 2017 2017.1 2017.2 2017.3 0
10 20 30
North (mm)
MUL1
2016.9 2017 2017.1 2017.2 2017.3 0
50 100
East (mm)
2016.9 2017 2017.1 2017.2 2017.3 Time (year)
0 50 100
Up (mm)
2016.9 2017 2017.1 2017.2 2017.3 -20
0 20 40
North (mm)
LOK1
2016.9 2017 2017.1 2017.2 2017.3 0
50 100 150
East (mm)
2016.9 2017 2017.1 2017.2 2017.3 -50
0 50
Up (mm)
deformation around the mainshock areas, visible defor-mation was also recorded in the uppermost South Island regions, suggesting that the afterslip continued to move northeastward. When compared with coseismic defor-mation in the vertical direction, postseismic defordefor-mation as a whole shows uplift in the northern South Island and southern North Island. The accumulated GPS-derived postseismic deformation shows a maximum horizontal movement of ~ 14.5 cm at the station LOK1 and a maxi-mum vertical uplift of ~ 14.5 cm at the station CMBL, both of which are located next to Cape Campbell.
Geodetic slip models
Coseismic slip model
Relevant information about the active faults is available from the New Zealand Active Faults Database, which is widely used for geological research, hazard
mode-ling, and infrastructure planning (Langridge et al. 2016;
Litchfield et al. 2013). A multi-fault rupture model was
reported by Hamling et al. (2017). This well-established
model consists of 19 shallow crustal faults and the south-ern Hikurangi subduction interface. We simplified the fault model using six separated rectangular faults to investigate the first-order patterns of coseismic slip, con-sidering the limited spatial coverage of GPS observations to constrain more detailed slip models. We properly sim-plified the fault geometry and adopted fault parameters
(Additional file 1: Table S3) from Hamling et al. (2017),
which can be used to constrain the major deformation characteristics of the earthquake. Shallow crustal faults
were discretized into a series of rectangular patches with
a spatial scale of 4 km × 4 km, whereas a larger spatial
scale of 6 km × 6 km was used for the deep subduction
interface.
Based on the elastic half-space dislocation theory
(Okada 1985), we inverted the GPS coseismic offsets
from Hamling et al. (2017) to investigate the coseismic
slip of multiple seismogenic faults. The smoothing coseis-mic slip model was achieved using the steepest descent
method (SDM; https://www.gfz-potsdam.de/sektion/
erdbeben-und-vulkanphysik/daten-produkte-dienste/ downloads-software/) iterative algorithm (Wang et al.
2013), a constrained least squares optimization problem
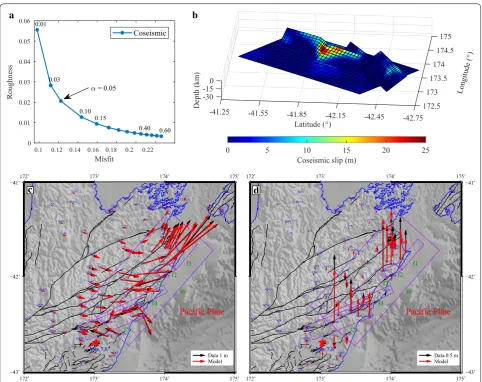
for estimating the dip-slip and strike-slip components of all discretized subpatches. The optimal smoothing model was achieved through adjusting the normalized smoothing factor, which is usually determined by using a trade-off value between model roughness and data misfit
(Fig. 5a).
The detailed spatial distribution of the coseismic slip
is shown in our best-fitting geodetic model (Fig. 5b and
Additional file 1: Figure S1). The smoothing geodetic
coseismic model suggests that the mainshock rupture not only propagated along shallow crustal multiple faults, but also involved a small contribution of the deep subduction
interface (Fig. 5b). The coseismic slip shows dominantly
right-lateral strike-slip motions in the Marlborough fault system, dextral oblique-slip motions in North Can-terbury, and more thrusting motions at the Hikurangi subduction interface. Our coseismic model shows that
172˚
Coseismic 1 m Postseismic 5 cm a
Coseismic 1 m Postseismic 5 cm b
the strike-slip movement reaches up to 23.9 m and dip-slip movement reaches up to 13.8 m, assuming absolute dextral strike-slip and thrusting movements that agree with the focal mechanism and surface deformation. Our results demonstrate that the maximum slip of ~ 24.2 m occurs at a depth of ~ 10 km, in a transition region
between the Needles and Kekerengu faults (Fig. 5b).
The predicted coseismic deformation is highly
consist-ent with the observed GPS deformation (Fig. 5c, d), and
the correlation between the GPS observations and model
predictions reaches up to ~ 99% (Table 1). The total
moment released by the earthquake is ~ 8.28 × 10²⁰ Nm,
equivalent to a magnitude of Mw 7.9 with a uniform crustal shear modulus of 30 GPa, which is consistent with previous studies based on GPS and Interferometric
Synthetic Aperture Radar (InSAR) observations
(Ham-ling et al. 2017).
Postseismic afterslip model
Afterslip describes postseismic ongoing aseismic fault motions occurring on or beneath mainshock rupture regions over several months to several years (Huang et al.
2014). In our study, postseismic deformation derived
from continuous GPS observations was inverted for opti-mal smoothed afterslip based on a homogeneous elastic half-space crust model. Compared with the coseismic model, the shallow crustal faults are extended along the strike and the Hikurangi subduction interface is extended
along the strike and downdip (Additional file 1: Table
S4) to investigate the more widely distributed afterslip.
0.1 0.12 0.14 0.16 0.18 0.2 0.22
-41.25 -41.55 -41.85 -42.15 -42.45 -42.75
-30
Depth (km
)
-150
0 5 10 15 20 25
Coseismic slip (m) = 0.05
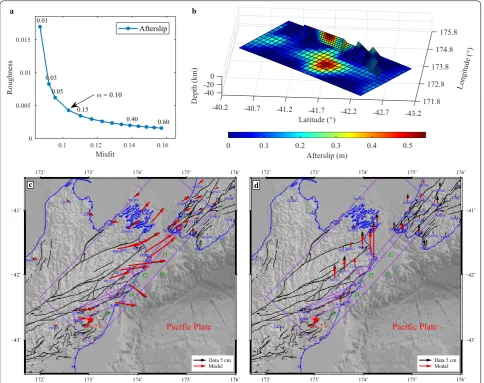
Considering more time-consuming computation, we dis-cretized the shallow faults and deep subduction interface
into 5 km × 4 km and 10 km × 10 km rectangular
sub-patches, respectively, in the postseismic inversion model.
Based on our best fits (Fig. 6b and Additional file 1:
Figure S2), the first-order patterns of the afterslip show more dextral strike-slip movements on the five crus-tal faults and visible thrusting motion at the Hikurangi
subduction interface. The near-field postseismic defor-mation is mainly derived from the significant right-lateral strike-slip motions on the shallow crustal faults, whereas the deep-seated afterslip at the Hikurangi subduction interface mostly contributes to mid- and far-field sur-face deformation. During the postseismic phase, appar-ent postseismic fault movemappar-ents not only continue along the northeastern Needles fault but also occur at
Table 1 Coseismic and postseismic inversion results
Model Mw Data-model Slip peak Slip range
Correlation Value (cm) Depth (km) Strike (cm) Dip (cm)
Coseismic 7.9 0.99 2416.0 9.4 [0.0, 2390.5] [0.0, 1379.0]
Postseismic 7.3 0.99 56.1 1.9 [0.0, 35.5] [0.0, 47.6]
0.1 0.12 0.14 0.16 -40.2 -40.7 -41.2 -41.7 -42.2 -42.7 -43.2 -40
the Hikurangi subduction interface (Fig. 6b). The maxi-mum afterslip was associated with the shallow Needles
fault with a magnitude of 56 cm at ~ 2 km depth (Fig. 6b),
revealing that fault rupture continues to move north-eastwards but much smaller than the mainshock rupture reaching up to 24 m. In addition, one high-slip concen-tration area with a peak of 53 cm was identified at the
deep (~ 35 km) Hikurangi subduction interface (Fig. 6b),
which is partially recovered by our model according to
the resolution test (Additional file 1: Figure S4), mainly
resulting from the poor spatial coverage of observations in the postseismic phase.
The model predictions agree well with GPS
obser-vations (Fig. 6c, d); the data-model correlation of our
postseismic model reaches up to 99% (Table 1). The
6-month afterslip has a cumulative geodetic moment of
1.19 × 10²⁰ Nm, corresponding to 14% of the coseismic
moment release and Mw 7.3, assuming a uniform crustal shear modulus of 30 GPa.
Discussion
Coseismic Coulomb stress changes in mainshock rupture regions
Calculation of static Coulomb stress changes
Coulomb stress change analysis contributes to illumi-nating stress transmissions, understanding earthquake interactions, and assessing seismic hazard associated with large earthquakes. The Coulomb failure criterion describes the fracture behavior of rock considering both shear and normal stress changes on a predefined surface
(King et al. 1994; Liu et al. 2017; Shan et al. 2013a; Stein
2000):
where ΔCFS is the Coulomb failure stress (CFS) change;
Δτs and Δσn are the shear stress and normal stress
changes on the receiver fault, respectively; and µ′
is the equivalent friction coefficient. Based on the seismic stress triggering theory, positive (increased) CFS change causes regional faults to be closer to failure and leads to seismic activity, whereas faults in stress shadow areas are further away from failure, reducing the possibility of seismicity
(Freed 2005; Shan et al. 2015).
We employed the PSGRN/PSCMP code (Wang et al.
2006) to calculate ΔCFS induced by the 2016 Kaikoura
mainshock slip and afterslip, which determines forward solutions of surface and subsurface deformation resulting from common geophysical sources in a layered gravita-tional half-space. The simplified finite fault models and corresponding slip distribution results were regarded to be dislocation sources when examining coseismic Cou-lomb stress changes. The differential Green’s functions
(2)
�CFS=�τs+µ′
�σn
were generated using a homogeneous elastic half-space model with a uniform crustal shear modulus of 30 GPa.
We calculated the Coulomb stress changes around the mainshock regions induced by coseismic slip at differ-ent depths (1, 9, 17, and 35 km). Based on the mainshock rupture patterns, the shallow (< 25 km depth) receiver faults were assigned average parameters (230° strike, 70° dip, and 150° rake), whereas a 221° strike, 12° dip, and 125° rake were considered for the deep interface fault.
Multiple friction coefficients (µ′
) were tested to verify the stability of the results. The numerical results indicate that the amplitudes of ΔCFS vary depending on the dif-ferent friction coefficients, but the spatial distribution patterns of Coulomb stress changes are highly consistent
(Additional file 1: Figure S5). Therefore, we considered an
empirical and moderate effective coefficient of friction of
0.4 (Shan et al. 2013a, b; Xiong et al. 2010, 2017) for our
ΔCFS calculation and discussion.
Static Coulomb stress changes
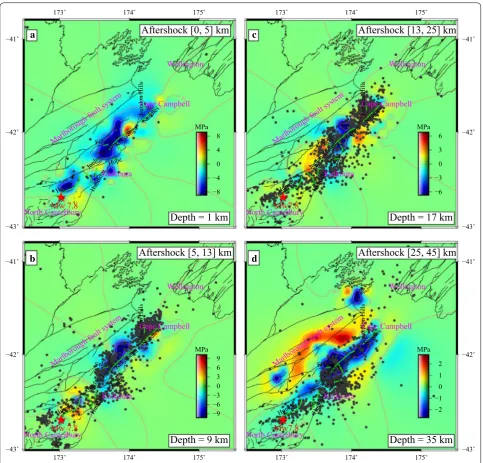
The coseismic stress perturbation results suggest that the ΔCFS due to the Kaikoura earthquake can reach several MPa around mainshock rupture regions. The ΔCFS also exhibits complex coseismic deformation patterns and
diversity for each depth (Fig. 7a–d), undoubtedly
reflect-ing the complexity of multi-fault ruptures associated with the Kaikoura earthquake.
In terms of coseismic stress perturbation at 1 km depth, the stress shadow covers most of the major rup-ture zone, which explains that aftershocks occurred only sporadically at shallow depths (< 5 km depth). However, a large increase in the Coulomb stress was observed at the end of the Kekerengu fault, which meets the Needles fault offshore the east coast of the upper South Island. In addition, positive Coulomb stress change was observed at
the northeastern Needles fault (Fig. 7a), which triggered
shallow afterslip (reaching up to 0.56 m at 2 km depth;
Fig. 6b). At the depth of coseismic peak slip (~ 9 km
depth), widespread increased Coulomb stress was observed in North Canterbury. The occurrence of nearly half of the aftershocks can be explained by the Coulomb stress triggering mechanism. In the deep regions (17 km depth) of shallow crustal faults, most of the mainshock rupture regions experienced loaded stress changes, which contributed to the occurrence of most aftershocks.
In Fig. 7b (9 km depth) and c (15 km depth), many
after-shocks surround the Needles fault, characterized by high positive stress changes of more than 6 MPa. This con-firms that stress loading derived from earthquake defor-mation contributes to the failure of regional faults. We can conclude that the stress is unloaded in a wider area
in the Marlborough fault system (Fig. 7b, c), whereby the
of the earthquake. The earthquake released most of the interseismic accumulated tectonic stress around the Kekerengu fault, which indicates reduced seismic risk in these regions. We calculated the Coulomb stress changes at 35 km depth, where deep peak slip occurs. We discov-ered that aftershocks rarely appear along the downdip of the subduction interface, but most of these regions experienced coseismic stress increase. We therefore assume that afterslip was relatively active, as evidenced
based on one high-slip concentration in our study. In addition, many aftershocks occurred in stress shadow regions, which may be the result of the use of a too sim-plified model responding to such complex multi-fault rupture. Widely distributed positive coseismic Coulomb stress was also observed around Wellington, although the magnitudes are much smaller than the ΔCFS around the mainshock regions.
173˚ 174˚ 175˚
−43˚ Marlborough fault system
North Canterbury Aftershock [0, 5] km
a
173˚ 174˚ 175˚
−43˚ Marlborough fault system
North Canterbury Aftershock [5, 13] km
b
173˚ 174˚ 175˚
−43˚ Marlborough fault system
North Canterbury Aftershock [13, 25] km
c Marlborough fault system
North Canterbury Aftershock [25, 45] km
d
Seismic hazard assessment in the Wellington region
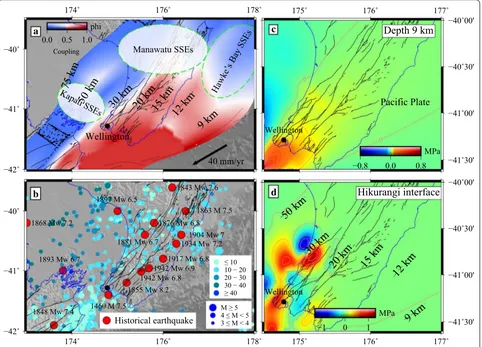
Wellington, the nation’s capital, is the largest city within a zone with very high seismic risk and has witnessed many
devastating earthquakes (Fig. 8b) including the 1460 M
7.5 Wellington earthquake and 1855 Mw 8.2
Wai-rarapa earthquake (Eiby 1968). Rapid plate convergence
(~ 40 mm/year) of the Australian–Pacific collision zone contributes to relatively frequent strain accumulation, which is released in form of earthquake deformation and volcanic explosion. Geodetic investigations carried out over more than 10 years suggest that the SSEs preced-ing the Kaikoura earthquake are absent in the Wellpreced-ington region. They are aseismic relative to normal earthquakes and show a diverse behavior with respect to duration, moment release, occurrence depth, and recurrence
inter-val at the Hikurangi margin (Wallace and Beavan 2010;
Wallace and Eberhart-Phillips 2013). An interseismic
long-term fault coupling investigation (Fig. 8a) and
geo-detic studies revealed that the Wellington region was highly locked and strongly aseismic in the decades before
the 2016 Kaikoura earthquake (Wallace 2004; Wallace
and Beavan 2010).
The 2016 Mw 7.8 Kaikoura earthquake that severely destroyed the northern South Island had a coseismic slip of more than 20 m beneath the Marlborough fault sys-tem. However, no significant surface deformation was observed during the coseismic or postseismic phases in the Wellington region, especially in the eastern regions. The CFS change investigation at 9 km depth suggests that the total CFS increase induced by coseismic and
post-seismic slip covers the Wellington region (Fig. 8c), which
might lead to future seismic activity. We also checked the
174˚ 176˚ 178˚
−42˚ −41˚
−40˚ 0.0 0.5 1.0Coupling
phi
9 km
12 km
15 km
20 km
30 km
50 km
75 km
Kapati SSEs
Manawatu SSEs
Hawke’s Bay SSE s
40 mm/yr
Wellington a
174˚ 176˚ 178˚
−42˚ −41˚ −40˚
Historical earthquake
Μ ≥ 5 4 ≤ Μ < 5 3 ≤ Μ < 4
≤ 10 10 − 20 20 − 30 30 − 40 ≥ 40 1460 M 7.5
1843 Mw 7.6
1848 Mw 7.4
1855 Mw 8.2
1863 M 7.5 8 . 6 w M 6 7 8 1 2
. 7 w M 8 6 8 1
1881 Mw 6.7
1893 Mw 6.7
1897 Mw 6.5
1904 Mw 7
1917 Mw 6.8 1934 Mw 7.2
1942 Mw 6.9 1942 Mw 6.8
b
175˚ 176˚ 177˚
−41˚30' −41˚00' −40˚30' −40˚00'
0 0
−0.8 0.0 0.8 MPa Wellington
Pacific Plate
Depth 9 km
c
175˚ 176˚ 177˚
−41˚30' −41˚00' −40˚30' −40˚00'
0
0
0
0
0
0
9 km
12 km
15 km
20 km
30 km
50 km
−1 0 1
MPa Wellington
Hikurangi interface
d
spatial distribution of the stress changes at the Hikurangi subduction interface and found that most of the plate interface is loaded due to the Kaikoura earthquake. Based on the static stress triggering mechanism, we suggest that the widely distributed CFS increase could promote widespread slow-slip movements along the Hikurangi subduction interface on the North Island. Aftershocks (based on the GeoNet earthquake catalogue) are widely distributed in the mainshock regions and on the North Island, but only a few of them occurred in the Wellington
region (Fig. 8b). According to the study of Wallace et al.
(2017), the Kaikoura earthquake immediately triggered
widespread slow-slip movements, but none of them occurred in the Wellington region.
Considering the deformation characteristics associ-ated with the Kaikoura earthquake and interseismic plate coverage and historical earthquakes, we conclude that no effective tectonic movements adequately encouraged the release of stress in Wellington. Multifaceted evidence consistently confirms that the Wellington region is still under high seismic threat. Accordingly, great attention should be paid to these regions and measures should be taken to reduce future earthquake damage.
Conclusions
We used GPS measurements to establish coseismic and postseismic models, investigated Coulomb stress changes, and assessed the seismic hazard associated with the 2016 Mw 7.8 Kaikoura earthquake. Several conclu-sions can be drawn:
1. The coseismic deformation mainly involved two differ-ent tectonic regions: right-lateral oblique-slip move-ments in North Canterbury and right-lateral strike-slip motions in the Marlborough fault system. Postseismic deformation shows a logarithmic behavior in time and decays slowly in space, with the motion tendency being consistent with coseismic patterns.
2. Our optimal geodetic coseismic model shows that coseismic rupture did not only occur with domi-nantly dextral strike-slip motions on shallow crustal faults but also at the Hikurangi subduction interface characterized by small-scale thrusting motions. The GPS-inverted moment of the coseismic model is equivalent to a magnitude 7.9 earthquake.
3. The near-field postseismic deformation is mainly derived from right-lateral strike-slip motions on shal-low crustal faults. The postseismic model suggests that the afterslip not only significantly extends north-eastward on the Needles fault but also occurs at the plate interface, slowly releasing energy over the past 6 months, which is equivalent to a magnitude 7.3 earthquake.
4. The ΔCFS exhibits coseismic deformation complex patterns and diversity for each depth, undoubtedly reflecting multi-fault rupture complexity associated with the Kaikoura earthquake. The increased ΔCFS of coseismic deformation can reach several MPa, which can explain the occurrence of afterslip in two high-slip regions and the majority of aftershocks. 5. Considering the deformation characteristics
asso-ciated with the Kaikoura earthquake and the inter-seismic plate coverage and historical earthquakes, we conclude that no effective tectonic movements adequately encouraged the release of stress in Wel-lington. Therefore, this region is currently under high seismic threat.
Abbreviations
GPS: Global Positioning System; GNSS: Global Navigation Satellite System; IGS: International GNSS Service; SDM: steepest descent method; VISR: velocity interpolation for stain rate; ITRF14: International Terrestrial Reference Frame 2014; SSEs: slow-slip events; GMF: global mapping function; CFS: Coulomb fail-ure stress; NGL/UNR: Nevada Geodetic Laboratory, University of Nevada, Reno; FES2004: finite element solutions 2004; InSAR: Interferometric Synthetic Aper-ture Radar; GNS: Institute of Geological and Nuclear Sciences; GIPSY-OASIS: GNSS-Inferred Positioning System and Orbit Analysis Simulation Software; GAMIT/GLOBK: GPS Analysis at Massachusetts Institute of Technology/Global Kalman filter; JPL: Jet Propulsion Laboratory.
Authors’ contributions
ZSJ completed all experiments and wrote the manuscript. DFH and LGY provided suggestions and guidance. AH, LPZ, and ZRY prepared related materials and revised the manuscript. All authors read and approved the final manuscript.
Acknowledgements
We appreciate the Nevada Geodetic Laboratory, University of Nevada, Reno (NGL/UNR), for processing the GeoNet GPS observations and releasing the corresponding time-series products. We are also grateful to Dr. Rongjiang Wang for his seismic inversion software SDM and PSGRN/PSCMP. Several figures were created using the Generic Mapping Tools (GMT 5.4.1) software
(Wessel and Smith 1998).
Competing interests
The authors declare that they have no competing interests.
Availability of data and materials
All data and materials supporting the conclusions of this article are available; they are either deposited in publicly available repositories or presented in the main paper or supporting files.
Ethics approval and consent to participate
Not applicable.
Funding
This research was supported by the National Key Research Program of China “Collaborative Precision Positioning Project” (No. 2016YFB0501900), National Natural Science Foundation of China (Nos. 41374032 and 41374002), and Sichuan Provincial Science and Technology Program (No. 2015JQO046). Linguo Yuan was funded by the National Program for Support of Top-notch Young Professionals.
Additional file
Publisher’s Note
Springer Nature remains neutral with regard to jurisdictional claims in pub-lished maps and institutional affiliations.
Received: 1 December 2017 Accepted: 28 March 2018
References
Beavan J, Samsonov S, Denys P, Sutherland R, Palmer N, Denham M (2010) Oblique slip on the Puysegur subduction interface in the 2009 July MW 7.8 Dusky Sound earthquake from GPS and InSAR observations: implica-tions for the tectonics of southwestern New Zealand. Geophys J Int 183:1265–1286
Beavan J, Wallace LM, Palmer N, Denys P, Ellis S, Fournier N, Hreinsdottir S, Pearson C, Denham M (2016) New Zealand GPS velocity field: 1995–2013. NZ J Geol Geophys 59:5–14
Bradley BA, Razafindrakoto HNT, Polak V (2017) Ground-motion observations from the 14 November 2016 Mw 7.8 Kaikoura, New Zealand, earthquake and insights from broadband simulations. Seismol Res Lett 88:740–756 Chardot L, Jolly AD, Kennedy BM, Fournier N, Sherburn S (2015) Using volcanic
tremor for eruption forecasting at White Island volcano (Whakaari), New Zealand. J Volcanol Geoth Res 302:11–23
Clark KJ, Nissen EK, Howarth JD, Hamling IJ, Mountjoy JJ, Ries WF, Jones K, Goldstien S, Cochran UA, Villamor P, Hreinsdóttir S, Litchfield NJ, Mueller C, Berryman KR, Strong DT (2017) Highly variable coastal deformation in
the 2016 M W 7.8 Kaikōura earthquake reflects rupture complexity along
a transpressional plate boundary. Earth Planet Sci Lett 474:334–344 Duputel Z, Rivera L (2017) Long-period analysis of the 2016 Kaikoura
earth-quake. Phys Earth Planet Inter 265:62–66
Eiby GA (1968) An annotated list of New Zealand earthquakes, 1460–1965. NZ J Geol Geophys 11:630–647
Elliott JR, Nissen EK, England PC, Jackson JA, Lamb S, Li Z, Oehlers M, Parsons B (2012) Slip in the 2010–2011 Canterbury earthquakes, New Zealand. J Geophys Res Solid Earth 117:207–216
Freed AM (2005) Earthquake triggering by static, dynamic, and postseismic stress transfer. Annu Rev Earth Planet Sci 33:335–367
Gorum T, Yildirim C (2017) Preliminary results on landslides triggered by the Mw 7.8 Kaikoura earthquake of 14 November 2016 in northeast South Island, New Zealand. EGU Gen Assem Conf Abstr 19:3545
Hamling IJ, Hreinsdottir S, Clark K, Elliott J, Liang C, Fielding E, Litchfield N, Vil-lamor P, Wallace L, Wright TJ, D’Anastasio E, Bannister S, Burbidge D, Denys P, Gentle P, Howarth J, Mueller C, Palmer N, Pearson C, Power W, Barnes P, Barrell DJ, Van Dissen R, Langridge R, Little T, Nicol A, Pettinga J, Rowland J, Stirling M (2017) Complex multifault rupture during the 2016 Mw 7.8 Kaikoura earthquake, New Zealand. Science 356:eaam7194
Holden C, Kaneko Y, D’Anastasio E, Benites R, Fry B, Hamling IJ (2017) The 2016
Kaikōura earthquake revealed by kinematic source inversion and seismic
wavefield simulations: slow rupture propagation on a geometrically complex crustal fault network. Geophys Res Lett 44:11320–311328 Hollingsworth J, Ye L, Avouac J-P (2017) Dynamically triggered slip on a splay
fault in the Mw 7.8, 2016 Kaikoura (New Zealand) earthquake. Geophys Res Lett 44:3517–3525
Huang M-H, Bürgmann R, Freed AM (2014) Probing the lithospheric rheology across the eastern margin of the Tibetan Plateau. Earth Planet Sci Lett 396:88–96
Jiang Z, Yuan L, Huang D, Yang Z, Chen W (2017) Postseismic deformation associated with the 2008 Mw 7.9 Wenchuan earthquake, China: con-straining fault geometry and investigating a detailed spatial distribution of afterslip. J Geodyn 112:12–21
Kääb A, Altena B, Mascaro J (2017) Coseismic displacements of the 14 Novem-ber 2016 Mw7.8 Kaikoura, New Zealand, earthquake using the Planet optical cubesat constellation. Nat Hazards Earth Syst Sci 17:627–639 Kaiser A, Balfour N, Fry B, Holden C, Litchfield N, Gerstenberger M, D’Anastasio
E, Horspool N, McVerry G, Ristau J, Bannister S, Christophersen A, Clark K, Power W, Rhoades D, Massey C, Hamling I, Wallace L, Mountjoy J, Kaneko Y, Benites R, Van Houtte C, Dellow S, Wotherspoon L, Elwood K, Gledhill K
(2017) The 2016 Kaikōura, New Zealand, earthquake: preliminary
seismo-logical report. Seismol Res Lett 88:727–739
Kilgour GN, Mader HM, Blundy JD, Brooker RA (2016) Rheological controls on the eruption potential and style of an andesite volcano: a case study from Mt. Ruapehu, New Zealand. J Volcanol Geotherm Res 327:273–287 King GCP, Stein RS, Lin J (1994) Static stress changes and the triggering of
earthquakes. Bull Seismol Soc Am 84:935–953
Langridge RM, Ries WF, Litchfield NJ, Villamor P, Van Dissen RJ, Barrell DJA, Rattenbury MS, Heron DW, Haubrock S, Townsend DB, Lee JM, Berryman KR, Nicol A, Cox SC, Stirling MW (2016) The New Zealand active faults database. NZ J Geol Geophys 59:86–96
Litchfield NJ, Van Dissen R, Sutherland R, Barnes PM, Cox SC, Norris R, Beavan RJ, Langridge R, Villamor P, Berryman K, Stirling M, Nicol A, Nodder S, Lamarche G, Barrell DJA, Pettinga JR, Little T, Pondard N, Mountjoy JJ, Clark K (2013) A model of active faulting in New Zealand. NZ J Geol Geophys 57:32–56
Liu C, Dong P, Shi Y (2017) Stress change from the 2015 Mw 7.8 Gorkha earth-quake and increased hazard in the southern Tibetan Plateau. Phys Earth Planet Inter 267:1–8
McCaffrey R, Wallace LM, Beavan J (2008) Slow slip and frictional transition at low temperature at the Hikurangi subduction zone. Nat Geosci 1:316–320 Motagh M, Beavan J, Fielding EJ, Haghshenas M (2014) Postseismic ground
deformation following the September 2010 Darfield, New Zealand, earth-quake from TerraSAR-X, COSMO-SkyMed, and ALOS InSAR. IEEE Geosci Remote Sens Lett 11:186–190
Nicol A, Beavan J (2003) Shortening of an overriding plate and its implications for slip on a subduction thrust, central Hikurangi Margin, New Zealand. Tectonics 22:38–46
Norris RJ, Cooper AF (2007) The Alpine Fault, New Zealand: surface geology and field relationships. Am Geophys Union 175:157–175
Okada Y (1985) Surface deformation due to shear and tensile faults in a half-space. Bull Seismol Soc Am 75:1135–1154
Power W, Clark K, King DN, Borrero J, Howarth J, Lane EM, Goring D, Goff J, Chagué-Goff C, Williams J, Reid C, Whittaker C, Mueller C, Williams S, Hughes MW, Hoyle J, Bind J, Strong D, Litchfield N, Benson A (2017) Tsunami runup and tide-gauge observations from the 14 November
2016 M7.8 Kaikōura earthquake, New Zealand. Pure appl Geophys
174:2457–2473
Robinson R, Van Dissen R, Litchfield N (2011) Using synthetic seismicity to evaluate seismic hazard in the Wellington region, New Zealand. Geophys J Int 187:510–528
Shan B, Xiong X, Wang R, Zheng Y, Yang S (2013a) Coulomb stress evolution along Xianshuihe–Xiaojiang Fault System since 1713 and its interac-tion with Wenchuan earthquake, May 12, 2008. Earth Planet Sci Lett 377–378:199–210
Shan B, Xiong X, Zheng Y, Jin B, Liu C, Xie Z, Hsu H (2013b) Stress changes on major faults caused by the 2013 Lushan earthquake and its relationship with the 2008 Wenchuan earthquake. Sci China Earth Sci 56:1169–1176 Shan B, Xiong X, Wang R, Zheng Y, Yadav RBS (2015) Stress evolution and
seis-mic hazard on the Maqin–Maqu segment of East Kunlun Fault zone from co-, post- and interseismic stress changes. Geophys J Int 200:244–253 Shen ZK, Wang M, Zeng Y, Wang F (2015) Optimal interpolation of spatially
discretized geodetic data. Bull Seismol Soc Am 105:2117–2127 Shi X, Wang Y, Liu-Zeng J, Weldon R, Wei S, Wang T, Sieh K (2017) How complex
is the 2016 Mw 7.8 Kaikoura earthquake, South Island, New Zealand? Sci Bull 62:309–311
Stein RS (2000) The role of stress transfer in earthquake occurrence. Transl World Seismol 402:605–609
Wallace LM (2004) Subduction zone coupling and tectonic block rotations in the North Island. New Zealand. J Geophys Res 109:B12406
Wallace LM, Beavan J (2006) A large slow slip event on the central Hikurangi subduction interface beneath the Manawatu region, North Island, New Zealand. Geophys Res Lett 33:223–224
Wallace LM, Beavan J (2010) Diverse slow slip behavior at the Hikurangi sub-duction margin, New Zealand. J Geophys Res 115:B12402
Wallace LM, Eberhart-Phillips D (2013) Newly observed, deep slow slip events at the central Hikurangi margin, New Zealand: implications for downdip variability of slow slip and tremor, and relationship to seismic structure. Geophys Res Lett 40:5393–5398
Wang R, Lorenzo-Martín F, Roth F (2006) PSGRN/PSCMP—a new code for calculating co- and post-seismic deformation, geoid and gravity changes based on the viscoelastic-gravitational dislocation theory. Comput Geosci 32:527–541
Wang R, Diao F, Hoechner A (2013) SDM-A geodetic inversion code incorpo-rating with layered crust structure and curved fault geometry. EGU Gen Assem Conf Abstr 15:2411
Wessel P, Smith WH (1998) New, improved version of Generic Mapping Tools released. EOS Trans Am Geophys Union 79:579
Williams CA, Eberhart-Phillips D, Bannister S, Barker DHN, Henrys S, Reyners M, Sutherland R (2013) Revised interface geometry for the Hikurangi subduction zone, New Zealand. Seismol Res Lett 84:1066–1073
Xiong X, Shan B, Zheng Y, Wang R (2010) Stress transfer and its implica-tion for earthquake hazard on the Kunlun Fault, Tibet. Tectonophysics 482:216–225
Xiong X, Shan B, Zhou YM, Wei SJ, Li YD, Wang RJ, Zheng Y (2017) Coulomb stress transfer and accumulation on the Sagaing Fault, Myanmar, over the past 110 years and its implications for seismic hazard. Geophys Res Lett 44:4781–4789