R E S E A R C H
Open Access
Multistatic adaptive CFAR detection in
non-Gaussian clutter
Riccardo Palamà, Maria Greco
*and Fulvio Gini
Abstract
This work addresses the problem of target detection for multistatic radars. We propose an algorithm that is able to keep constant the false alarm rate, when the disturbance samples associated with each receiver-transmitter pair are distributed according to a compound Gaussian model. The performance of the proposed detection algorithm are analysed to assess the impact of clutter diversity on detection performance. The results show that clutter statistical diversity has a strong impact on detection performance. The performance of both single-channel and multichannel detection schemes are evaluated by processing real sea clutter data collected by the NetRAD nodes, in order to evaluate which of the two channels, i.e. the bistatic and monostatic channels, is more favourable for target detection. Furthermore, the gain achieved by using a multistatic detection algorithm is also analysed.
1 Introduction
Sea clutter is typically non-Gaussian and non-stationary, which makes the design of proper detection algorithms a critical task. The development of radar detection algo-rithms in the presence of Gaussian or non-Gaussian dis-turbance has been widely addressed in literature and is still an active research field. In the case of non-Gaussian disturbance, one of the most used algorithms is the so-called normalized matched filter (NMF) [1–3]. Under the hypothesis of compound Gaussian clutter, this algo-rithm is able to keep constant the false alarm rate (FAR). This property is verified both when the clutter covari-ance matrix is a priori known and when it is unknown and estimated from the range cells surrounding the range cell under test (in this case, we use the adaptive version of the NMF, i.e. the normalized adaptive matched filter (NAMF) [4–6]). The fast temporal fluctu-ations of the clutter make its samples to be only partially correlated in short times and broaden the clutter spectrum. The correlation properties are described, from a statistical standpoint, by the clutter covariance matrix.
The use of multiple transmitters and receivers in a radar system aims at improving the target detection, tracking and recognition capabilities of a radar system [7–13]. Radar detection techniques for multistatic radars
can be distinguished between centralized and decentra-lized ones. According to a centradecentra-lized detection scheme, the signals associated with each transmitter-receiver pair are processed locally at each receiver node, which com-putes a local statistic, and then, all the local statistics are transmitted to a central processor, which in turn com-putes a global statistic [7, 9]. The hard decision is per-formed by comparing this global statistic with a threshold. An alternative detection rule is the decentra-lized one (see, e.g. [14–17]), according to which each node performs a hard decision, then transmits the resulting binary symbols to a central processor, that exe-cutes the final decision. One of the main limitations of a centralized detection technique is that it requires a large bandwidth of the communication link between the sys-tem nodes. If the communication bandwidth is not suffi-ciently large, the local statistics, transmitted by each node to the central processor, may be distorted [18]. For this reason, in real systems, the local statistics are quan-tized and then transmitted to the central processor; thus, a quantization noise is present. In this work, a central-ized detection rule is considered, without accounting for the limitations associated with a communication link with finite bandwidth, as the aim of the work is to study the effect of clutter diversity on the detection perform-ance of a multistatic radar system.
One of the first works dealing with the design of cen-tralized detection for multistatic radar is Conte et al.’s paper [7] that proposes both optimum and suboptimum * Correspondence:[email protected]
Dipartimento di Ingegneria dell’Informazione, University of Pisa, Via G. Caruso 16, Pisa, Italy
detection algorithms in the case of white Gaussian noise. In [8], the authors discuss again the optimum and sub-optimum multistatic radar detection techniques in the cases that clutter and jamming are Gaussian and corre-lated with both time and space. A multichannel detection technique, under cross-correlated Gaussian channels, is proposed in [19], where a multichannel generalized likeli-hood ratio test (GLRT) is derived. More recently, the interest of the radar community towards Multi-Input Multi-Output (MIMO) radar systems has encouraged the research on multichannel detection techniques. MIMO radars can be distinguished, based on the location of their nodes, between collocated and not collocated (also known as widely separated MIMO). In a collocated MIMO radar [11], the transmitter and receiver antennas are in the same location; thus, the diversity is achieved by using antennas with a certain number of elements, each of them transmit-ting a different waveform. Hence, the diversity gain is guaranteed by the fact that each element of the receiver antenna looks at a different channel. In the case of widely separated radars, transmitter and receiver locations are not the same; thus, the signals associated with each transmitter-receiver pair—if combined together in a cor-rect way—can provide a diversity gain, due to the spatial separation between channels [10, 13]. The optimum de-tection technique for MIMO radars in the cases of Gauss-ian and spatially uncorrelated clutter, called MIMO-Optimum Gaussian Detector (MIMO-OGD), has been discussed in [13]. In [20], the authors evaluate the per-formance of the MIMO-OGD, compared with a decentra-lized detection scheme. A detection algorithm for MIMO radar that utilizes space-time coded waveforms is derived and discussed in [12]. A MIMO-GLRT, based on a para-metric approach, is proposed and validated in [21]. In [22], a MIMO-GLRT and Rao detector are derived in the case of non-Gaussian clutter, and their performance are evaluated in the case of known covariance matrix.
In this work, we consider a multichannel extension of the NMF, introduced with the name of MIMO-Generalized Likelihood Ratio Test-Linear Quadratic (MIMO-GLRT-LQ) in [23]. This detector is the MIMO version of the aforementioned NMF; thus, it can also be termed MIMO-NMF. It has been demonstrated to be able to keep constant the false alarm rate under different clutter distributions belonging to the compound Gauss-ian family, associated with each transmitter (TX) re-ceiver (RX) pair. The mode of operation of the adopted detection rule is centralized.
In this work, we first discuss the received signal model for multistatic radar, where the target is observed in the presence of non-Gaussian disturbance. Then, two funda-mental assumptions—uncorrelated channels and com-pound Gaussian disturbance—are introduced, in order to derive a suboptimum detection scheme, i.e. the
multichannel NMF. First, the performance of the pro-posed detector are tested by processing simulated data. The adaptive version of the adopted detector, i.e. the MIMO-NAMF is also implemented, by estimating the clutter covariance matrix [5]. The performance of the single-channel NAMF is then evaluated on real sea clut-ter data, collected by the nodes of the multistatic radar system, NetRAD [24, 25], in order to evaluate the differ-ences between the bistatic and monostatic sea clutter from a radar detection standpoint. NetRAD sea clutter data have been analysed in some recent papers, in order to highlight the differences in the statistics between monostatic and bistatic sea clutter, which have been de-fined as clutter diversity in [25]. Our performance ana-lysis aims at assessing which of the two channels is the more favourable for target detection. At the same time, the performance of the multichannel NAMF are also analysed by processing real clutter data, with the aim of investigating whether and under which conditions a multistatic detector is able to provide a performance gain with respect to the single-channel detector. In synthe-sis, the novelty of this work consists of the evaluation of false alarm regulation and detection performance over the two channels, bistatic and monostatic, with different statis-tical properties. Performance analysis has been carried out by processing both simulated and real clutter data.
The rest of this paper is organized as follows. In Section 2, we summarize the single-channel NMF tector, describe the multistatic signal model and de-rive the multichannel detection scheme. In Section 3, the performance of the multichannel NAMF are ana-lysed by processing simulated data. In Section 4, the performance of the single-channel and multichannel NAMF are analysed by processing real sea clutter data collected by the NetRAD system. Final remarks are drawn in Section 5.
2 Problem formulation
2.1 Single-channel detection
In the case of single-channel radar, the received signal model under the hypothesis H1 (target signal plus dis-turbance) is z=αp +w, whereas under theH0 hypoth-esis (disturbance only), is z=w ([1, 2]). The received signal samples, z(n), are stacked into the vector z
¼fz nð ÞgLn−¼10, whereLis the number of coherently inte-grated pulses. The time duration of the coherent pro-cessing interval (CPI) is TCPI; thus, L=TCPI⋅PRF. Similarly, the vector w contains the disturbance samples. The target signal is modelled by the target complex amplitude α times the target steering vector p¼fp nð ÞgnL−¼10 , whose nth element is given by pðnÞ
The disturbance is usually modelled as a compound Gaussian (CG) random vector, consisting of a slowly varying component, called texture, τ (assumed as com-pletely correlated within a CPI), and a rapidly varying component, called speckle,x; thus, w¼pffiffiffiτx. The valid-ity of this model for sea clutter has been discussed by a large number of works in literature for both monostatic [26–28] and, more recently, for bistatic clutter [25, 29, 30]. The rapid fluctuations of sea clutter are taken into account for the speckle component, which is modelled as a complex Gaussian random vector, whose covariance matrix isR=E{xxH}. As shown in many works (see, e.g. [1–3]), the NMF performs the following test:
Λð Þ ¼z pHR−
The non-adaptive version requires the prior know-ledge of the speckle covariance matrix,R, whereas in the adaptive version,Ris replaced by its estimate,R^; in this case, the detector is called normalized adaptive matched filter (NAMF). This test has been demonstrated to be “texture-CFAR” and “covariance matrix-CFAR,” i.e. it keeps constant the false alarm rate with respect to the texture distribution and to the shape of the speckle co-variance matrix, if a proper estimation technique is used [4, 5, 31]. The estimation of the speckle covariance matrix is a crucial operation in order to guarantee good performance of the NAMF detector. In the case of CG-distributed clutter, the fixed-point (FP) estimate of the covariance matrix has been demonstrated [4–6] to be asymptotically optimum. Other possible estimators are the sample covariance matrix (SCM) and the normalized sample covariance matrix (NSCM) [32, 33].
2.2 Multichannel received signal model
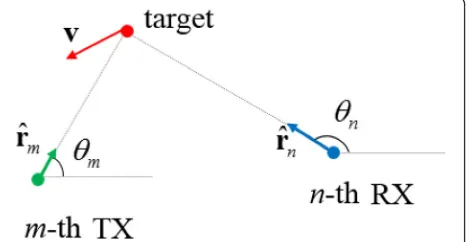
Let us consider a radar system consisting ofM transmit-ters and N receivers, whose geometry is sketched in Fig. 1. The transmitter and receiver indexes aremandn,
respectively; thus, m= 1,…,M and n= 1,…,N. The azi-muth pointing angles of the m-th transmitter and n-th receiver are θð Þmt and θð Þnr , respectively. The unit vector associated with the line-of-sight (LOS) of the m-th transmitter is rð Þmt , whereas rð Þnt is the unit vector associ-ated with the LOS of the n-th receiver. By assuming a bi-dimensional system geometry, the unit vectors are given by rð Þmt ¼ cosθð Þmt sinθð Þmt
h i
and rð Þnr ¼
cosθð Þnr sinθð Þnr
h i
. The target velocity v consists of two components,vx and vy, i.e. v= [vx vy]. Hence, the target
Doppler frequency, associated with themn-th TX-RX pair, is given by
The signal received by the nth receiver and trans-mitted by the m-th transmitter is indicated as zmn(l),
where l is the pulse index. We assume that the CPI consists of L samples, assumed equal for all the TX-RX pairs; thus, the received signal vector can be expressed as zmn¼fzmnð Þl gLl¼−01.We can distinguish be-tween the H1and the H0hypotheses:
H1:zm;n¼αm;npm;nþwm;n; H0:zm;n¼wm;n;
ð3Þ
wherem= 1,…,M n= 1,…,N,αmnis the target complex
amplitude and wmn is the disturbance. A general
re-ceived signal model is obtained by stacking the vectors
zmnfor all the TX-RX pairs, i.e. z¼ zT11;…; a more general case, the disturbance can be modelled as a complex elliptically symmetric (CES) random variable [34], and then, its multivariate probability density func-tion (pdf ) can be expressed as
fWð Þ ¼w CL;gj jΣ−1g wHΣ−1w
ð5Þ
where g(.) is the density generator, Σ is the covariance matrix and CL,g is the normalizing constant [34]. The
compound Gaussian family is a subset of the CES family, described by the following density generator:
g tð Þ ¼
In the multidimensional disturbance model, there is a combination of a multidimensional texture vector τ= [τ11(0)…τ11(L−1)…τMN(0)…τMN(L−1)]T and speckle vector s= [s11(0)…s11(L−1),…,sMN(0)…
sMN(L−1)]. Hence, the disturbance w can be
expressed as
w¼τ1=2⊙s¼Ts ð7Þ
where ⊙ denotes the Hadamard product and T is a diagonal matrix, containing the texture samples, T= diag(τ1/2). The space-time clutter covariance matrix, Σ, is given by
Σ¼EfwwHg ¼ETssHTH¼Enτ1=2⊙sτ1=2⊙sHo
¼Enτ1=2τ1=2Ho⊙EfssHg ¼C1=2⊙R
ð8Þ
whereRis the space-time speckle covariance matrix and
C is the space-time covariance matrix of the texture. It can be concluded that the global covariance matrix Σis given by the Hadamard (i.e. element-wise) product of the space-time speckle and texture covariance matrices. The size ofΣ,R and C is MNL×MNL, i.e. the product of the number of TX-RX pairs (MN) times the number of integrated pulses, L. Each space-time covariance matrix can be viewed as a block-matrix, whose block size is L×L and total number of blocks is (MN)2. The global, speckle and texture covariance matrices are re-lated by
The general blocks Σmn,rs, Cmn,rs andRmn,rs are given by could be noted that the blocks on the main diagonal rep-resent the autocovariance matrices of the clutter, texture and speckle samples collected by one transmitter-receiver pair, whereas the blocks off the diagonal represent the cross-covariances between the temporal samples collected by the mn-th and rs-th channels. Hence, if the channels are assumed statistically independent, matrices Σ, C, and
R are block-diagonal. Due to the element-wise product structure shown in (9), in order for the global space-time covariance matrix to be not block-diagonal, both the tex-ture covariance matrix,C, and speckle covariance matrix,
R, should not be block-diagonal. In other words, both the texture and speckle samples should be correlated across different TX-RX pairs. However, in this work, the chan-nels are assumed statistically independent; hence, the matricesΣ,CandRare block-diagonal.1
The target complex amplitudes can be stacked into the vectorα, whose covariance matrix isCα=E{ααH}, of size MNL×MNL, and is block-structured, similar to Σ, C and R. Hence, if the target returns are statistically inde-pendent across different channels, the matrix Cα is block-diagonal. In addition, if a Swerling I target model is used, the target amplitude is constant within a CPI.
Under the assumption of compound Gaussian clutter, the joint pdfs under the hypothesesH0and H1are given by [34]
where the vectors τ0 and τ1 are the texture vectors in
the two hypotheses.
Under the assumption of independent channels, concerning both the clutter and target returns, the joint pdfs can be written as:
fðzjH1;α;vÞ ¼
In the general case of CG disturbance, the expressions of the joint pdfs (11)–(12) have not closed form; thus, the optimum detector cannot be derived in closed form. A suboptimum approach [2] consists of replacing the texture with its maximum likelihood estimate (MLE), which gives the following GLRT:
ΛðzÞ ¼ maxτ1;α;vfðzjH1;α;v;τ1Þ
maxτ0fðzjH0;τ0Þ
H1
> <H0 λ
ð17Þ
This approach is tantamount to consider the clutter as Gaussian distributed with unknown covariance. In the following, a multichannel GLRT is derived in both cases of perfectly known target signal and unknown target complex amplitude.
2.3 Multichannel detection
In the case that target signal is perfectly known, we have knowledge of the elements of the vector α containing the target complex amplitudes and of the target steering vectorspmn, for all the values ofmand n, which in turn
requires a perfect knowledge of the system geometry and of the target velocity v. Hence, the target signal, for the mnth pair, is sm,n=αm,npm,n; thus, q
The GLRT reduces to
Λð Þ ¼z maxτ1 fðzjH1;τ1Þ
The numerator is max
τ1
fðzjH1;τ1Þ ¼fðzjH1;^τ1Þ , where^τ1 is the texture MLE, which can be calculated as ∇τ1ffðzjH1;τ1Þgjτ1¼^τ1 ¼0 . In the case that the clutter
samples are statistically independent across channels, we
have ∂fðzjH1;τ1Þ
. The texture MLE
for themnth channel,^τmn, is obtained by equating to zero the previous derivative. Hence, the vector consists of the texture estimates, calculated separately for each
receiver-transmitter pair. ^τ1¼ τ^ð Þm1;n
Similarly, under the H0 hypothesis, the texture MLE for the mnth channel is ^τð Þm0;n¼qð Þm0;n zm;n
The suboptimum GLR in (18) is given by
Hence, the suboptimum multichannel GLRT for per-fectly known signal can be recasted as
Λð Þ ¼z Y
In the case that the target complex amplitudes, con-tained in the vector α, are now unknown parameters (and the target velocity vis still a known quantity), the general form of the adopted suboptimum GLRT is given by
Due to the statistical independence across the target returns associated with different channels, the MLE of the vector αis a vector consisting of the MLEs of the target complex amplitude associated with all the TX-RX pairs ( ^αm;n , m= 1,…,M and n= 1,…,N), i.e. ^α¼
After straightforward manipulations, the value of αmn
that maximizes the final quantity in (25) is
^
By substituting the value of ^αmn in the general
expres-sion of the suboptimum GLRT in (22), we obtain
Hence, the multichannel GLRT in the case of unknown complex target amplitude can be recasted in the form
Λð Þ ¼z YM
which is the MIMO (ormultichannel) version of the nor-malized matched filter. This detector has been originally derived in [23] in a different manner. In [23], the authors show that in the case of known covariance matrices, this detector is texture-CFAR andPFAis a function only of the
detection threshold λ, the number of pulses L and the number of transmitter-receiver pairs (MN = P),
PFA¼λ1−L which is the well-known expression of the probability of false alarm achieved by the single-channel NMF [1]. In [23], it is also shown that detector (28) outperforms the MIMO-Optimum Gaussian Detector (MIMO-OGD) in non-Gaussian clutter.
3 Performance analysis on simulated data
The performance of the multichannel NMF detector was analysed by simulating the target and clutter signals. Simulations were realized for both known and unknown covariance matrix. In the latter case, the adaptive version of the detector (28) was implemented, by replacing the covariance matrix with its estimates.
The global signal-to-clutter ratio (SCR) is given by the sum of all the local signal-to-clutter ratios (SCRmn), SCR¼
PM
m¼1
PN
n¼1SCRmn, where the local SCR is given by
SCRmn¼
In the simulations, SCR is assumed uniformly dis-tributed over all the transmitter-receiver pairs; thus, SCRmn= SCR/MN. The target is modelled according
to the Swerling-I model, and its amplitude is a com-plex Gaussian random variable and independent for different TX-RX pairs. For each CPI, one value of the complex amplitude is generated, according to the complex Gaussian distribution, and assumed as con-stant for all the samples within the CPI. The clutter power PðcmnÞ is assumed equal to 1. The clutter is modelled as a first-order autoregressive stochastic process, AR(1), characterized by the one-lag correl-ation coefficient ρmn and centre frequency fðcmnÞ [35].
Both the target Doppler frequency and the clutter centre frequency were assumed to be zero, in order to remove the influence of the system geometry on the algorithm performance, and to consider the worst case, where the target is totally embedded in clutter. Then, we set ρmn= 0.9, a value that is typically
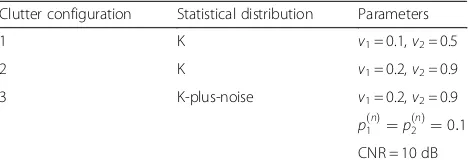
adopted to model sea clutter spectrum. We consid-ered the case of two TX-RX pairs, studying three dif-ferent cases for the clutter statistical distribution, illustrated in Table 1 (note that the shape parameters are indicated as ν, with a subscript indicating the channel index, whereas p(n) indicates the noise level for the plus-noise distribution). In the case of K-plus-noise distribution, the clutter-to-noise ratio (CNR) is also indicated in Table 1. The number of in-tegrated pulses, L, was set equal to 8. We considered both the scenarios where the speckle covariance matrix is known and unknown (and estimated by using the SCM, NSCM and FP estimates). The num-ber of iterations for the iterative estimation algorithm was set to 4. The number of Monte Carlo runs was 107. The number of secondary range cells used to estimate the clutter covariance matrix was K= 2L, which guaran-tees quite accurate covariance estimates [5].
3.1 False alarm regulation
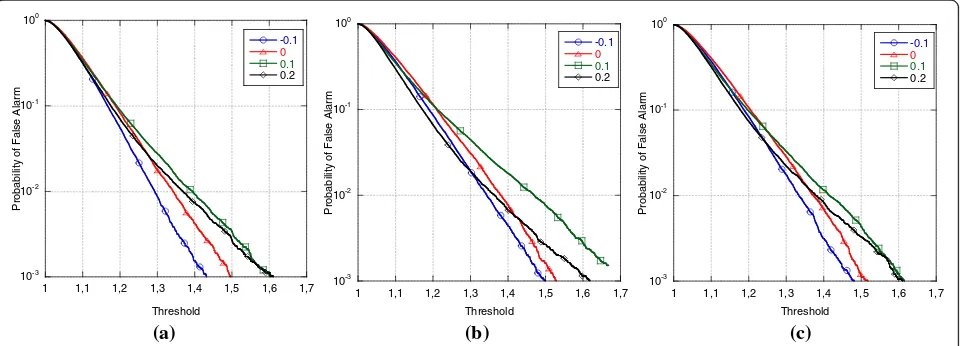
The false alarm regulation performance of the multi-channel NMF detector, (28), is illustrated in Fig. 2. The PFA values obtained by simulating the clutter samples, and using the statistical models described in Table 1, are compared with the theoretical PFA values, given by (29) [23]. In the case of known covariance matrix, the PFA values are identical for all the clutter configurations, per-fectly matched with the theoretical values; thus, the
CFAR property of the multichannel NMF in the ideal case (i.e. non-adaptive) is confirmed. ThePFAvalues are not influenced by the clutter distribution, if the covari-ance matrix is estimated by the NSCM and FP methods, which indeed confirms the robustness of the multichan-nel NAMF. On the other hand, the multichanmultichan-nel NAMF that utilizes the SCM covariance estimate is not a CFAR detector with respect to the clutter distribution. These results are expected, as the SCM estimator is optimum in the case of Gaussian clutter, whereas the NSCM and FP estimators are able to give good estimates in the case of compound Gaussian clutter [4–6].
By evaluating the “PFA-vs-threshold” plots, the values of the detection threshold λ can be set in order to achieve a desired value of thePFA. As the values ofλ de-pends on the technique used to estimate the covariance matrix, λKC indicates the value of the threshold in the case of known covariance matrix;λNSCMand λFPare the values of the threshold in the case of NSCM and FP esti-mates, respectively. The values ofλKC,λNSCMandλFPto set in order to achievePFAvalues from 10−5to 10−2are shown in Table 3. These values will be used in evaluating the detection performance of the multichannel NAMF, by setting a desiredPFA.
3.2 Detection performance
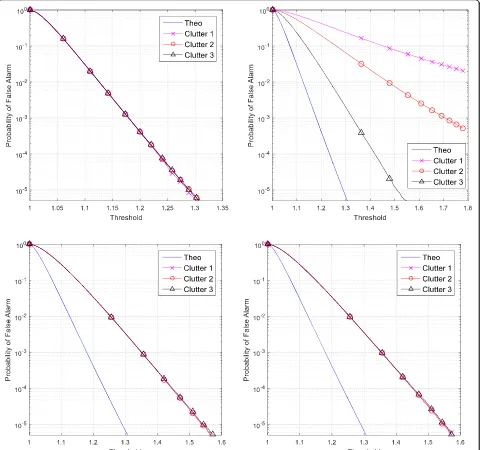
The ROC of the multichannel NAMF have been derived for the three clutter configurations illustrated in Table 1; for known and estimated covariance matrix, the global SCR was equal to 10 dB. Figure 3 shows the ROC curves of the MIMO-NAMF, i.e. for unknown target signal.
The detection performance in the first clutter uration is similar to the one in the second clutter config-uration, whereas it decreases in the third clutter configuration. This is probably because the third clutter configuration includes the presence of a thermal noise component. ThePD values are, as expected, the highest in the case of known covariance matrix. Furthermore, the NSCM method shows slightly better performance than the FP, whereas thePDvalues obtained through the SCM method are always lower than the one obtained by using the NSCM and FP methods. This is an expected result, because the SCM method is optimum only if the clutter is Gaussian.
It should be noted that the single-channel optimum detector has already shown (for many combinations of the values of PFAand SCR) better detection performance with decreasing values of the K-distribution shape par-ameter, i.e. with increasing clutter spikiness [1, 33, 38– 40]
The ROC curves have shown that different shape par-ameter values associated with different TX-RX pairs have an impact on the detection performance. In order to better evaluate this impact, simulations were realized Table 1Clutter configurations
Clutter configuration Statistical distribution Parameters
1 K v1= 0.1,v2=0.5
2 K v1= 0.2,v2=0.9
3 K-plus-noise v1= 0.2,v2=0.9
pð Þ1n ¼pð Þ2n ¼0:1
by generating clutter samples distributed according to the K-plus-noise distribution, with unitary clutter power, thermal noise power of 0.1 and different values of the shape parameters (ν1, ν2), both included between 0.04 and 1.2 (in real data, the values of the shape parameter are usually included within this interval [30]). The threshold values were set in order to obtain aPFA= 10−5, as shown in Table 2. PD was calculated for each pair of shape parameters (ν1, ν2). Figure 4 shows 3D contour plots of the PD values versus (ν1,ν2), for a value of the global SCR of 15 dB. A peak occurs for both the shape parameters equal to about 0.15, which is suggested by
shown much lower performance than the NSCM and FP estimators. In addition, the NSCM covariance estimator shows better performance than the FP one and a less steep gradient. The contour plots highlight that identical values of PD are achieved by the multichannel NAMF for different combinations of the shape parameters asso-ciated with the two jointly processed channels. In other words, the clutter conditions experienced by each of the two channels jointly influence the global detection performance.
In recent works [25, 30], the statistical analysis of simul-taneously collected bistatic and monostatic data of the shape parameter has highlighted that the monostatic shape parameter is almost constant with range, whereas the bistatic one shows large deviations, due to the geom-etry change. Hence, the detection performance, achieved by applying the multichannel NAMF to monostatic and bistatic data at different ranges, may be heavily influenced by this clutter diversity, especially by the behaviour of bistatic clutter.
4 Performance analysis on real data
4.1 Data overview
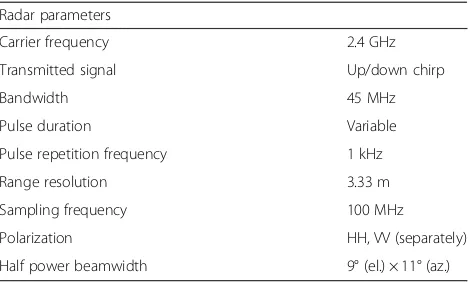
The performance of the multichannel NAMF were analysed on real sea clutter data, collected by the nodes of the NetRAD system, which is an S-band multistatic radar system, developed at the University College London. The
main parameters of the NetRAD are summarized in Table 3.
The analysed data were collected by the NetRAD system during a measurement campaign realized in October 2010 at Scarborough, Cape Town, by researchers from the University College London and University of Cape Town. Two nodes—a monostatic one and a bistatic one—were employed in the measurements and were located on the sea coast, at a short distance from the sea.
Measurements were made by varying the azimuth angle, polarization and baseline. For each range cell, the number of received pulses isNp= 130,000, corresponding to a total
acquisition time of 130 s. In this work, we consider the datasets collected on October 21, 2010, with a baseline of 728 m and a bistatic angle (β) of 30° [25, 30].
In order to evaluate the performance of both single-channel and multisingle-channel NAMF detectors on NetRAD data, a target was simulated and its signal superimposed on real clutter data. In particular, the target fluctuations were modelled according to the Swerling-I model, with a complex Gaussian target amplitude, completely correlated within a CPI. The signal-to-clutter ratio (SCR) was set similar to the case of simulated data, and the clutter power is directly computed from the data [30].
The target Doppler frequency, fD, influences heavily the performance of a detection algorithm, as if the Range-Doppler bin of the target is located within an area of low clutter power, the detection performance will be high. In order to evaluate the impact of sea clutter on false alarm regulation and on detection performance, the range cell under test (rCUT) was set where the clutter power is high for both the bistatic and monostatic sea clutter data, i.e. at the centre of the intersection between the antenna patterns of the transmitter and bistatic re-ceivers (range of about 1400 m for the analysed dataset) [30]. Since the aim of this work is to study the impact of Probability of False Alarm
Probability of Detection
Known Cov SCM NSCM FPE
Probability of False Alarm
Probability of Detection
Known Cov SCM NSCM FPE
Probability of False Alarm
Probability of Detection
Known Cov SCM NSCM FPE
(a) (b) (c)
Fig. 3ROC curves of the multichannel NAMF, in the cases of two TX-RX pairs, first (a), second (b) and third (c) clutter configuration. SCR = 10 dB
Table 2Threshold values (simulated data)
PFA Known covariance NSCM FP
10−2 1.13 1.23 1.25
10−3 1.18 1.31 1.35
10−4 1.23 1.44 1.45
clutter statistics on the radar performance, the values of the bistatic and monostatic Doppler frequencies of the target were set manually, by evaluating the sea clutter spectra, in order to inject the target within the area of heavy clutter. Figure 5 shows the sea clutter spectra of the analysed data, for both horizontal and vertical polarization. The method adopted to estimate the Power Spectral Density (PSD) was the Welch periodogram [35], with a window of 512 samples and an overlap of 50 %. Each periodogram was calculated over a time interval of 15 s. We note that most spectra are centred at a normal-ized Doppler frequency of about 0.1. Figure 5 shows that monostatic spectrum is wider than bistatic one and VV spectra are wider than HH ones.
An important quantity to analyse is the cross-correlation between monostatic and bistatic data. The received signal model at the basis of the adopted detec-tion scheme assumes that the signals associated with dif-ferent channels are uncorrelated. Thus, the fact that two (or more) channels are actually correlated might worsen the performance of the adopted detection scheme. We separated two clutter components, i.e texture and speckle, by using the technique illustrated in [30] (by using blocks of 512 samples, resulting in a total number of blocks,Nb, equal to 250), and then, we computed the cross-correlation coefficient between the texture samples (shown in Fig. 6a) and in-phase and quadrature speckle samples (shown in Fig. 6b).
The cross-covariance function between the bistatic and monostatic textures,Rτ, was calculated as
Rτð Þ ¼m 1 Nb
X
l¼1 Nb−j jm
^
τBð Þ−l μ^ð ÞτB h i
^
τMðlþj jmÞ−μ^ð ÞτM
h i
;
ð31Þ
where τ^B and ^τM represent the bistatic and monostatic
texture, respectively, whose sample means are μ^ð ÞτB and
^
μð ÞM
τ , respectively. The texture cross-correlation
coeffi-cient isrτð Þ ¼m Rτð Þm= σ^ð ÞτBσ^ð ÞτM
, where^σð ÞτM andσ^ð ÞτB are the estimated standard deviations of monostatic and bistatic texture, respectively.
Concerning the analysis of the speckle, the cross-covariance function between the bistatic and monostatic in-phase speckle samples was calculated as
Rs;IIð Þ ¼m 1 Np
X
l¼1 Np−j jm
^
xB;Ið Þ−i ^μð ÞsB;I h i
^
xM;Iðiþj jmÞ−^μM
ð Þ
s;I
h i
;
ð32Þ
where ^xB;I and x^M;I are the bistatic and monostatic
in-phase speckle estimates (obtained by normalizing the clutter samples over the texture estimates), respectively, and μ^ð Þs;BI and μ^ð Þs;MI are their sample means, respectively. The cross-correlation coefficient between the in-phase components isrs;IIð Þ ¼i Rs;IIð Þm= σ^ð ÞsB;Iσ^
M
ð Þ
s;I
, where σ^ð ÞsB;I andσ^ð ÞsM;I are the estimated standard deviations of the in-phase speckle components. The cross-correlation coeffi-cient between the quadrature components, rs,QQ(m), is
calculated similar tors,II(m).
The texture cross-correlation coefficient shows a small periodicity for both HH and VV data. For VV data, there are two peaks at a time lag of about 5 and 22 s, whereas for HH data, there are peaks at about 3, 16 and 22 s. In general, VV data show higher peaks, separated by longer intervals, with respect to HH data.
The values of the speckle cross-correlation coefficient are very low for all the data, even if not null (with max-imum values around 0.01), and show different behav-iours, depending on polarization. For HH data, both rs,QQ and rs,II show an almost identical periodic
Fig. 4Contour plots of thePDvalues as a function of the shape parameters (ν1,ν2), in the cases of known (a) covariance matrix, NSCM (b) and FP (c) estimates. SCR = 15 dB, CNR = 10 dB,PFA= 10−
behaviour, whose fluctuations decrease with increasing time lag. For VV data, bothrs,QQandrs,IIshow a slightly
decreasing behaviour as a function of the time lag, with the values ofrs,IIlower than the values ofrs,QQ.
In general, the analysis of the cross-correlation suggests that bistatic and monostatic data have a certain degree of correlation, which could influence the performance of the adopted detector.
4.2 False alarm regulation
In the first analysis, we studied the behaviour of the prob-ability of false alarm as a function of the detection thresh-old, for the single-channel NAMF, applied separately on simultaneous bistatic and monostatic data. This analysis was realized also for themultichannelNAMF, combining the bistatic and monostatic data. In order to evaluate the robustness of the adopted detectors against the time-varying clutter spectra [36], four different values of the normalized Doppler frequency were chosen, i.e.fD= [−0.1, 0, 0.1, 0.2]. As shown in Fig. 5 for the datasets collected by the NetRAD on October 21, 2010, at a bistatic angle of 30°, the clutter power is low forfD=−0.1, 0 and 0.2 (PC< −35 dBm) and very high forfD= 0.1 (PC≈ −10 dBm).
In the following, we analyse the false alarm regulation performance of the single-channel and multichannel NAMF on the HH polarized data, collected at a bistatic angle of 30°. The range cell under test is at 1400 m.
It should be noted that the total number of pulses is about 130,000 and that the number of integrated pulses (L) was set as 8. ThePFAwas measured over bursts of L pulses, with 50 % overlap; thus, it cannot be accurately estimated for values lower than 10−2.
Figure 7 shows the behaviour of thePFAfor the multi-channel NAMF. All the plots compare the PFA values obtained at different Doppler frequencies, by employing the SCM, NSCM and FP covariance estimates. The “PFA-vs-threshold” plots show that the variation of the clutter properties (in particular its non-stationarity) with the Doppler frequency influences the false alarm regula-tion performance. It could be noted that the maximum values of PFA are obtained for a normalized Doppler frequency equal to 0.1.
From the examination of the clutter spectra, it is confirmed that the Doppler bins giving higher values of PFAare included within the area where the sea clutter is more powerful and spikier. This phenomenon has been already observed and explained in [36]. For this reason, the values ofPFA are not constant over the entire range, and their spread is larger if the SCM estimate is used and reduced if either the NSCM or FP estimates are employed. The SCM estimate is not accurate in the case that the clutter is not Gaussian, whereas the NSCM and FP estimates are more accurate [5, 36].
By examining Fig. 7, it is possible to set suitable values of the threshold in order to achieve a desired PFA. Due to the variation of PFA as a function of the analysed Doppler frequency, these threshold values are not unique. A possible choice consists of adopting the average threshold, included between its maximum and minimum values. The resulting average threshold values (that were then adopted in our analysis), obtained for
-0.5 -0.4 -0.3 -0.2 -0.1 0 0.1 0.2 0.3 0.4 0.5 Normalized Frequency
-70 -60 -50 -40 -30 -20 -10 0
Power [dBm]
Mono
Bi
(a)
-0.5 -0.4 -0.3 -0.2 -0.1 0 0.1 0.2 0.3 0.4 0.5 Normalized Frequency
-70 -60 -50 -40 -30 -20 -10 0
Power [dBm]
Mono
Bi
(b)
Fig. 5Spectrum of bistatic and monostatic sea clutter.β= 30°,rCUT= 1400 m, HH (a) and VV (b) polarization Table 3NetRAD radar parameters
Radar parameters
Carrier frequency 2.4 GHz
Transmitted signal Up/down chirp
Bandwidth 45 MHz
Pulse duration Variable
Pulse repetition frequency 1 kHz
Range resolution 3.33 m
Sampling frequency 100 MHz
Polarization HH, VV (separately)
the analysed dataset (HH polarized data,β= 30°,rCUT= 1400 m) and for each covariance matrix estimation method, are shown in Table 4.2
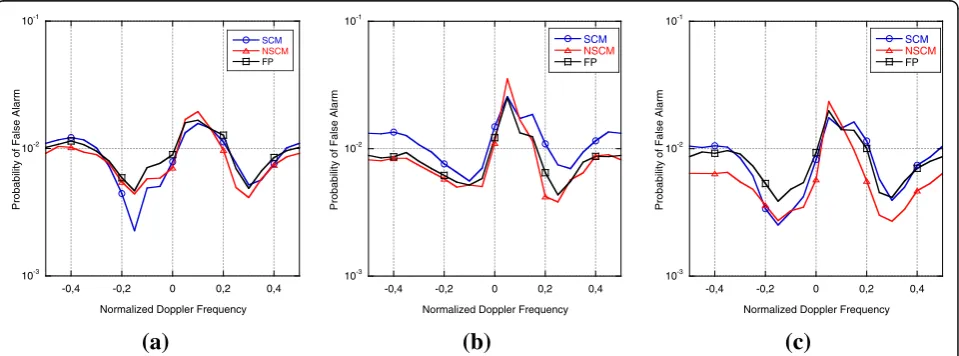
The false alarm regulation performance achieved by the adopted detectors (by using the chosen thresholds) is ana-lysed as a function of the Doppler frequency, as shown in Fig. 8. In other words, for a fixed Doppler frequency, the PFAvalues were computed for the single-channel detector, applied separately on monostatic and bistatic data and for the multichannel detector. The fluctuations of the PFA values as a function of the Doppler frequency are smaller for monostatic data (Fig. 8a) with respect to bistatic ones (Fig. 8b). Both the bistatic and monostatic data show a peak ofPFAatfD≈0.1, and this peak is higher for bistatic data. The overall behaviour of the PFAvalues is matched to the clutter spectra shown in Fig. 5.
In general, the FP and NSCM estimates guarantee a more stable behaviour of the PFA values, fluctuating around the desired value of 10−2. The behaviour of PFA seems to be less stable for the multichannel detector with respect to the single-channel one. It seems that the PFA values obtained by using the multichannel detector adapt themselves to the less favourable between the bistatic and monostatic channels, i.e. the channel that, for each Dop-pler bin, givesPFAvalues farther from the desired value of 10−2. By comparing the covariance estimation methods, the SCM is shown to give larger fluctuations of the PFA with respect to the FP and NSCM ones.
4.3 Detection performance
In the first analysis, the detection performances of the single-channel and multichannel detectors on NetRAD
0 5 10 15 20 25 30
Fig. 6Cross-correlation between monostatic and bistatic sea clutter data, for texture (a) and in-phase and quadrature speckle components (b).
β= 30°,rCUT= 1400 m, HH and VV polarization
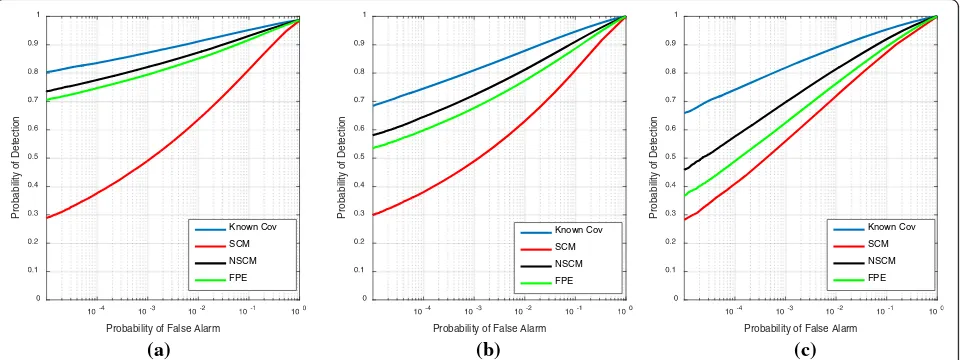
data are examined, in terms of receiver operating charac-teristics, obtained for different values of the target Doppler frequency and of the signal-to-clutter ratio. The ROC curves of the multichannel NAMF are evaluated by using the SCM, NSCM and FP covariance estimates. Different values of the normalized target Doppler frequency were analysed, i.e.fD= [−0.1, 0, 0.1, 0.2], and the value of SCR was set as 0 dB. ROC curves in Fig. 9 show that the PD values are lower forfDequal to 0.1, where the majority of the clutter power is concentrated. On the other hand,PD values are very high forfD=−0.1. From a comparison be-tween the covariance matrix estimators, the NSCM and FP ones give better performance than the SCM one, espe-cially in heavy clutter conditions (fD= 0.1 and, less clearly, fD= to 0 and 0.2). This is due to the fact that the SCM es-timator has good performance if the statistical distribution of the disturbance samples approaches the Gaussian one, whereas the NSCM and FP estimators are accurate also in the case of non-Gaussian clutter [36].
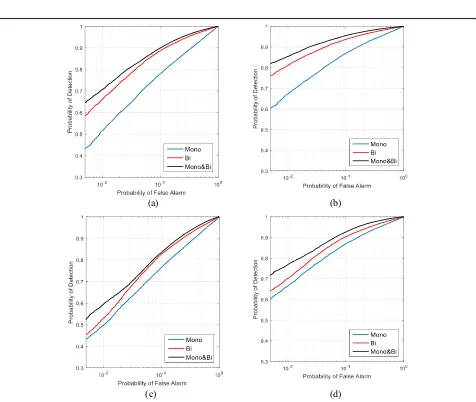
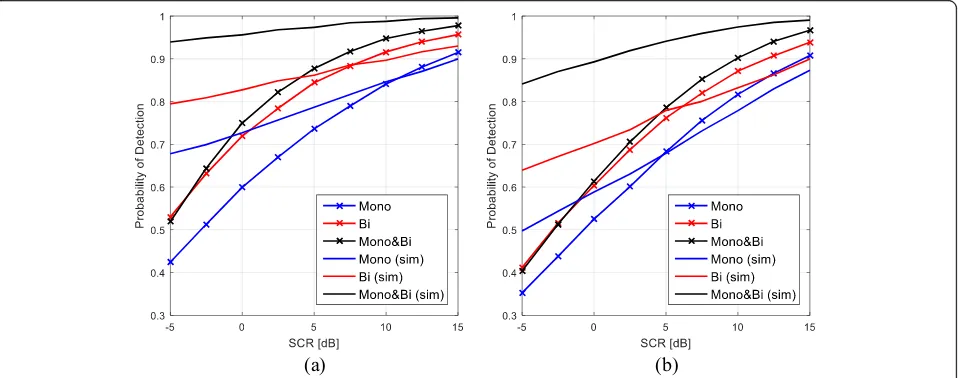
In order to better examine the detection performance, only the heavy-clutter Doppler bin (fD= 0.1) was consid-ered. Figure 10 shows the ROC curves obtained by the single-channel and multichannel detectors for fD= 0.1, for two different values of SCR (0 and 5 dB), on horizon-tally and vertically polarized data. By examining the single-channel NAMF detector, the PDvalues are always higher for bistatic data with respect to monostatic ones,
for both HH and VV data, meaning that bistatic clutter offers, in the analysed cases, more favourable conditions for target detection. Polarization seems to have a small impact on results obtained on monostatic clutter (thePD values are similar to HH and VV monostatic data). On the other hand, for bistatic clutter, for PFA= 10−2 and SCR = 0 dB, PD is about 0.65 for HH and 0.5 for VV, whereas for SCR = 5 dB,PDis about 0.82 for HH and 0.7 for VV.
In addition, the difference between the PD values of bistatic and monostatic channels is higher for HH polar-ized data with respect to the VV ones. This difference could be due to the different behaviours of the shape parameter between HH and VV data, shown in [30], ac-cording to which the estimated values of the K + N shape parameters are lower in the bistatic data com-pared to the monostatic ones, for both polarizations (relative to the datasets collected at a bistatic angle of 30 and range cell of 1400 m).
The higher PD values shown by the bistatic channel are consistent with the results shown in Section 3.2 for simu-lated data, which highlight that, for each covariance esti-mate, the lower the shape parameter, the higher the detection probability (this behaviour of the detection prob-ability of the NMF detector has been shown also in [1]).
The multichannel NAMF provides a gain in perform-ance over the single-channel NAMF. This gain is more evident for a higher value of the SCR (i.e. SCR = 5 dB). In terms of detection performance, analysed on a single Doppler bin, it is evident that, by jointly processing the signals associated with two different channels of the system, the multichannel NAMF adapts itself to the more favourable between the two channels.
The analysis of detection performance was deepened by studying the behaviour of thePDvalues as a function Table 4Average threshold values for PFA = 10−2, evaluated on
NetRAD data
SCM NSCM FPE
Bi 0.79 0.84 0.83
Mono 0.81 0.85 0.83
Mono and Bi 1.35 1.42 1.38
10-3
10-2
10-1
-0,4 -0,2 0 0,2 0,4
SCM
NSCM
FP
Probability of False Alarm
Normalized Doppler Frequency
10-3
10-2
10-1
-0,4 -0,2 0 0,2 0,4
SCM
NSCM
FP
Probability of False Alarm
Normalized Doppler Frequency
10-3
10-2
10-1
-0,4 -0,2 0 0,2 0,4
SCM
NSCM
FP
Probability of False Alarm
Normalized Doppler Frequency
(a)
(b)
(c)
10-2
10-1
100 Probability of False Alarm
0.3 0.4 0.5 0.6 0.7 0.8 0.9 1
Probability of Detection
-0.1
0
0.1
0.2
10-2
10-1
100
Probability of False Alarm
0.3 0.4 0.5 0.6 0.7 0.8 0.9 1
Probability of Detection
-0.1
0
0.1
0.2
10-2
10-1
100
Probability of False Alarm
0.3 0.4 0.5 0.6 0.7 0.8 0.9 1
Probability of Detection
-0.1
0
0.1
0.2
(a) (b) (c)
Fig. 9ROC of the multichannel NAMF applied to real data, achieved by using the SCM (a), NSCM (b), and FP (c) estimates. HH pol.,β= 30°,rCUT= 1400 m
(a) (b)
(c) (d)
of the SCR, for a normalized Doppler of 0.1 and PFA of 10−2; thus, the threshold values contained in Table 4 were utilized. As the NSCM estimator seems to give better performance, it was chosen for the comparison between single-channel and multichannel detectors.
Synthetic clutter samples were also generated, with similar statistical properties as the analysed real data. Clutter samples were generated according to the K-plus-noise distribution, whose parameters were esti-mated from real data through the Method of Moments [30]. For the HH data, shape parameter ν is 0.047 for bistatic data and 0.057 for monostatic data, whereas for VV data, ν= 0.064 for bistatic and ν= 0.091 for mono-static data.
The clutter autocorrelation was also estimated for each analysed dataset, where the symbol (.)* indicates the complex conjugate. The clutter samples were generated with the extracted correlation properties.
Figure 11 shows the“PD-vs-SCR”curves of the single-channel NAMF and of the multisingle-channel NAMF, applied to real and simulated data.
For the real data, Fig. 11a shows that, for aPDof 0.8, the multichannel NAMF gives a SCR gain of about 1.5 and 6 dB over the single-channel NAMF applied on bistatic and monostatic data, respectively. The corre-sponding values for VV data (Fig. 11b) are 1 and 4 dB.
The behaviour of PD is more flat for simulated data with respect to real ones, which means that the SCR has a higher impact when real clutter is processed. Relative to the single-channel detector, the gap between bistatic and monostatic data is similar to real and simulated data. On the other hand, we note a large deviation in the detection performance of the multichannel de-tector, between real and simulated data. In the case
of real data, the PD values achieved by the multichan-nel detector are not far from the ones obtained by using the single-channel detector on bistatic data. In the simulated data, a large gap is noticeable between the multichannel and the single-channel curves. In other words, the gain achieved by using a multichan-nel detection scheme is larger for simulated data with respect to real ones. One of the factors that could in-fluence this different behaviour is that real bistatic and monostatic data show (Fig. 6) to be correlated, whereas simulated data are generated independently (i.e. they are uncorrelated). As the detection scheme is derived by assuming that the channels are uncorre-lated, its performance is expected to be generally higher if this assumption is verified.
5 Conclusions
This work concerns suboptimum radar detection tech-nique that combines the signal received by the nodes of a multistatic radar, in the case of non-Gaussian disturb-ance. The adopted multichannel detection scheme, called multichannel normalized adaptive matched filter, is able to keep constant the probability of false alarm, for different clutter conditions associated with the nodes of the system.
A derivation of the multichannel NAMF has been il-lustrated, as an alternative to the one already provided by authors in [23]. The performance of the multichannel NAMF has been evaluated, showing that clutter statis-tical diversity influences the detection performance. We have studied the behaviour of thePDvalues as a function of the couple of shape parameters, associated with the two channels of the simulated system. The results have shown that, in the case of two channels, the contour
(a) (b)
Fig. 11PDas a function ofSCRof thesingle-channel NAMF, on monostatic (blue marked) and bistatic (red marked) data, and of themultichannel
plots ofPDas a function of the clutter shape parameters are similar to hyperbolas, meaning that the same value ofPD can be obtained for different couples of shape pa-rameters. The performance analysis has been carried out also on real sea clutter data, combining the bistatic and monostatic clutter data collected by the nodes of the NetRAD system. The false alarm regulation performance of the multichannel NAMF seem to be slightly lower than the one of the single-channel NAMF, applied separ-ately on bistatic and monostatic data. In particular, the behaviour of thePFAvalues of the multichannel NAMF, for each Doppler bin, seems to adapt to the less favourable between the two system nodes. This behav-iour is not desirable; thus, it should be better studied in future research steps.
The detection performance evaluation has shown that the multichannel NAMF gives a gain over the single-channel one, which is larger in the horizontally polarized data than in vertically polarized ones. If the multichannel detector is employed, the PD values are higher in the case of simulated data with respect to real ones. A possible reason is that, in real data, the channels are not uncorrelated, whereas the multichannel NAMF has been derived from the assumption of independent channels. In future research steps, this assumption will be possibly removed, in order to derive a detection scheme that exploits the whole information carried on by the radar channels, by processing them jointly and not separately. In [37], the authors remove the aforementioned assump-tion and derive a detecassump-tion scheme in the case of Gaussian clutter. It would be of interest to consider the case where the clutter samples are compound Gaussian distributed and correlated across channels.
6 Endnotes
1
It should be noted that another possible representa-tion adoptsMN×MN-sized blocks, whose total number isL2.
2
ThePFAversus threshold plots for the single-channel detector, applied separately to monostatic and bistatic data, are not shown for lack of space.
Acknowledgements
The authors would like to thank the researchers of the University College London and University of Cape Town who provided the real clutter data and analysed this work.
Competing interests
The authors declare that they have no competing interests.
Received: 5 August 2016 Accepted: 4 October 2016
References
1. E Conte, M Lops, G Ricci, Asymptotically optimum radar detection in compound-Gaussian clutter. IEEE Trans. Aerosp. Electron. Syst.31(2), 617–625 (1995)
2. F Gini, Sub-optimum coherent radar detection in a mixture of K-distributed and Gaussian clutter. IEE Proc. Radar Sonar Navig.144(1), 39–48 (1997) 3. S Kraut, LL Scharf, The CFAR adaptive subspace detector is a scale-invariant
GLRT. IEEE Trans. Signal Process.47(9), 2538–2541 (1999)
4. E Conte, A De Maio, G Ricci, Recursive estimation of the covariance matrix of a compound-Gaussian process and its application to adaptive CFAR detection. IEEE Trans. Signal Process.50(8), 1908–1915 (2002) 5. F Gini, M Greco, Covariance matrix estimation for CFAR detection in
correlated heavy tailed clutter. Signal Process.82(12), 1847–1859 (2002) 6. F Pascal, Y Chitour, JP Ovarlez, P Forster, P Larzabal, Covariance structure
maximum-likelihood estimates in compound Gaussian noise: existence and algorithm analysis. IEEE Trans. Signal Process.56(1), 34–48 (2008) 7. E Conte, E D’Addio, A Farina, M Longo, Multistatic radar detection: synthesis
and comparison of optimum and suboptimum receivers. IEE Proc. Commun. Radar Signal Process.130(6), 484–494 (1983)
8. E D’Addio, A Farina, Overview of detection theory in multistatic radar. IEE Proc. F Commun. Radar Signal Process.133(7), 613–623 (1986) 9. V Chernyak,Fundamentals of multisite radar systems(Amsterdam, 1995) 10. E Fishler, A Haimovich, RS Blum, LJ Cimini, D Chizhik, RA Valenzuela, Spatial
diversity in radars—models and detection performance. IEEE Trans. Signal Process.54(3), 823–838 (2006)
11. J Li, P Stoica,MIMO radar signal processing(Wiley, Hoboken, 2009) 12. A De Maio, M Lops, Design principles of MIMO radar detectors. IEEE Trans.
Aerosp. Electron. Syst.43(3), 886–898 (2007)
13. AM Haimovich, RS Blum, LJ Cimini, MIMO radar with widely separated antennas. IEEE Signal Process. Mag.25(1), 116–129 (2008)
14. M Barkat, PK Varshney, Decentralized CFAR signal detection. IEEE Trans. Aerosp. Electron. Syst.25(2), 141–149 (1989)
15. RS Blum, SA Kassam, HV Poor, Distributed detection with multiple sensors: part II—advanced topics. Proc. IEEE85(1), 64–79 (1997)
16. F Gini, F Lombardini, L Verrazzani, Robust monoparametric multi-radar CFAR detection against non-Gaussian spiky clutter. IEE Proc. Radar Sonar Navig.
144(3), 131–140 (1997)
17. F Gini, F Lombardini, PK Varshney, On distributed signal detection with multiple local free parameters. IEEE Trans. Aerosp. Electron. Syst.35(4), 1457–1466 (1999)
18. F Gini, F Lombardini, L Verrazzani, Decentralised detection strategies under communication constraints. IEE Proc. Radar Sonar Navig.145(3), 199–208 (1998) 19. JH Michels, P Varshney, D Weiner, Multichannel signal detection involving temporal and cross-channel correlation. IEEE Trans. Aerosp. Electron. Syst.
31(3), 866–880 (1995)
20. NA Goodman, D Bruyere, Optimum and decentralized detection for multistatic airborne radar. IEEE Trans. Aerosp. Electron. Syst.43(2), 806–813 (2007) 21. P Wang, H Li, B Himed, Moving target detection using distributed MIMO
radar in clutter with nonhomogeneous power. IEEE Trans. Signal Process.
59(10), 4809–4820 (2011)
22. G Cui, L Kong, X Yang, Multiple-input multiple-output radar detectors design in non-Gaussian clutter. IET Radar Sonar Navig.4(5), 724–732 (2010) 23. CY Chong, F Pascal, J-P Ovarlez, M Lesturgie, MIMO radar detection in non-Gaussian
and heterogeneous clutter. IEEE J. Sel. Top. Signal Process.4(1), 115–126 (2010) 24. WA Al-Ashwal, K Woodbridge, HD Griffiths, Analysis of bistatic sea clutter
part I: average reflectivity. IEEE Trans. Aerosp. Electron. Syst.50(2), 1283– 1292 (2014)
25. WA Al-Ashwal, K Woodbridge, HD Griffiths, Analysis of bistatic sea clutter part II: amplitude statistics. IEEE Trans. Aerosp. Electron. Syst.50(2), 1293–1303 (2014) 26. E Conte, M Longo, Characterization of radar clutter as a spherically invariant
random process. IEE Proc.134(2), 191–197 (1987)
27. K Ward, R Tough, S Watts,Sea clutter: scattering, the K distribution and radar performance(IET, London, 2013)
28. A Farina, F Gini, MV Greco, L Verrazzani, High resolution sea clutter data: statistical analysis of recorded live data. IEE Proc. Radar Sonar Navig.144(3), 121 (1997)
29. R. Palamà, M. Greco, P Stinco, F Gini, "Statistical analysis of netrad high resolution sea clutter",21st European Signal Processing Conference (EUSIPCO 2013), Marrakech, 2013, pp. 1-5.
30. R Palamà, MS Greco, P Stinco, F Gini, "Statistical analysis of bistatic and monostatic sea clutter",IEEE Transactions on Aerospace and Electronic Systems, vol. 51, no. 4, pp. 3036-3054, Oct. 2015.
32. F Gini, JH Michels, Performance analysis of two covariance matrix estimators in compound-Gaussian clutter. IEE Proc. Radar Sonar Navig.
146(3), 133–140 (1999)
33. F Gini, M Greco, Suboptimum approach to adaptive coherent radar detection in compound-Gaussian clutter. IEEE Trans. Aerosp. Electron. Syst.
35(3), 1095–1104 (1999)
34. E Ollila, DE Tyler, V Koivunen, HV Poor, Complex elliptically symmetric distributions: survey, new results and applications. IEEE Trans. Signal Process.
60(11), 5597–5625 (2012)
35. P Stoica, R Moses,Spectral analysis of signals(Prentice Hall, Upper Saddle River, 2005)
36. M Greco, P Stinco, F Gini, M Rangaswamy, Impact of sea clutter nonstationarity on disturbance covariance matrix estimation and CFAR detector performance. IEEE Trans. Aerosp. Electron. Syst.46(3), 1502–1513 (2010)
37. CY Chong, F Pascal, J Ovarlez, M Lesturgie, Robust MIMO radar detection for correlated subarrays, inIEEE International Conference on Acoustics, Speech and Signal Processing (ICASSP), 2010, pp. 2786–2789
38. E Conte, A De Maio, E Conte, A De Maio, Mitigation Techniques for Non-Gaussian Sea Clutter. IEEE Journal of Oceanic Engineering29(2):284–302 (2004)
39. KJ Sangston, F Gini, MV Greco, A Farina, KJ Sangston, F Gini, MV Greco, A Farina, Structures for radar detection in compound Gaussian clutter. IEEE Transactions on Aerospace and Electronic Systems35(2):445–458. 40. F. Gini, M.V. Greco, A. Farina, P. Lombardo, F. Gini, M.V. Greco, A. Farina, P.
Lombardo, Optimum and mismatched detection against K-distributed plus Gaussian clutter. IEEE Transactions on Aerospace and Electronic Systems
34(3):860–876.
Submit your manuscript to a
journal and benefi t from:
7Convenient online submission 7Rigorous peer review
7Immediate publication on acceptance 7Open access: articles freely available online 7High visibility within the fi eld
7Retaining the copyright to your article