R E S E A R C H
Open Access
A putative molecular network associated
with colon cancer metastasis constructed
from microarray data
Songtao Chu
1, Haipeng Wang
1and Miao Yu
2*Abstract
Background:This study aimed to identify the potential molecular network associated with colon cancer metastasis.
Methods:A gene expression profile dataset (GSE40367) downloaded from Gene Expression Omnibus was used to
identify and compare differentially expressed genes (DEGs) between primary colon adenocarcinoma tissues and matched tissue samples of liver metastases of colon adenocarcinoma. After the functional analysis of the DEGs, their protein–protein interactions (PPIs) were analyzed, and the transcription factors (TFs) and microRNAs (miRNAs) that regulated these DEGs were predicted. The data were used to construct an integrated network of DEGs, TFs, and miRNAs. Finally, the GSE68468 dataset was used to validate the DEGs associated with liver metastasis of colon adenocarcinoma identified in the GSE40367 dataset.
Results:Compared with the primary colon adenocarcinoma sample, 262 DEGs were upregulated and 216 were
downregulated in the liver metastasis sample. The DEGs were primarily involved in functions associated with cell junctions and cell adhesion. The DEGs included 17 genes encoding TFs, and 39 miRNAs that regulated DEGs were predicted. Further analysis of the DEGs led to the identification of 490 PPIs. The data were used to construct an integrated network consisting of DEGs, TFs, and miRNAs. DEGs with a high degree of connectivity in the network includedFGF2,ERBB4,PTPRC,CXCR4,CCL2, andCCL4. The network also revealed thatFGF2interacted withERBB4, PTPRC, andCXCR4and thatPTPRCinteracted withCXCR4. Furthermore,LCP2andAPBB1IPwere predicted to target several other DEGs, includingPTPRC, and miR-30a-3p and miR-30e-3p were predicted to regulateERBB4and several other DEGs. Notably,FGF2,ERBB4,PTPRC,LCP2,CCL2, andCCL4were also identified as DEGs in the GSE68468 dataset.
Conclusion:The DEGs, TFs, and miRNAs identified in this study might play key roles in colon cancer metastasis.
Keywords:Colon cancer, Metastasis, Differentially expressed gene, Protein–protein interaction, Integrated network
Background
Colon cancer is a potentially fatal disease that affects more than a quarter of a million people each year [1]. Despite recent advances in the diagnosis and treatment of colon cancer, there were still 95,270 estimated new cases of colon cancer and 49,190 estimated deaths asso-ciated with it in the USA in 2016 [2]. Tumor metastasis is the primary cause of disease recurrence and death in patients with colon cancer [3].
In recent years, remarkable advances have been made in the study of the molecular mechanisms underlying colon cancer metastasis. CD44v6, a gene required for the colon cancer cell migration and generation of meta-static colon tumors, has been identified as a functional biomarker and therapeutic target of colon cancer ther-apy, and low levels ofCD44v6are associated with an in-creased probability of survival [3]. CCAT2, a novel long
noncoding RNA transcript, is upregulated in
microsatellite-stable colorectal cancer (CRC). CCAT2 enhances tumor growth and metastasis via miR-17-5p, miR-20a, and MYC [4]. In addition, nuclear β-catenin is resistant to FOXO3a-mediated apoptosis and promotes * Correspondence:[email protected]
2Gastrointestinal Colorectal and Anal Surgery, China-Japan Union Hospital of
Jilin University, Changchun 130000, Jilin Province, China Full list of author information is available at the end of the article
colon cancer metastasis [5]. Galectin-3 mediates resist-ance to tumor necrosis factor-related apoptosis-inducing ligand (TRAIL) by inhibiting TRAIL binding to death re-ceptors, thereby promoting the metastasis of colon adenocarcinoma cells [6]. MicroRNAs (miRNAs) have also been shown to be associated with colon cancer me-tastasis. For example, miR-200 has been shown to medi-ate epithelial-to-mesenchymal transition (EMT) and metastatic behavior in colon cancer [7, 8]. miR-192 is able to inhibit the metastasis of colon cancer to the liver by downregulating the expression of several target genes, including Bcl-2,Zeb2, andVEGFA[9]. However, despite these findings, the molecular mechanisms underlying the metastasis of colon cancer, especially in the context of colon adenocarcinoma, remain incompletely under-stood. In addition, approaches for analyzing the differ-ences between primary tumor lesions and their matched distant metastases remain unclear.
The present study’s aim was to investigate the molecu-lar mechanisms underlying colon cancer metastasis. For the same, we used publically available gene expression data from metastatic colon adenocarcinoma samples to identify and characterize genes that are differentially be-tween primary colon adenocarcinoma tissues and matched liver metastasis tissues. The putative functions and protein–protein interactions (PPIs) associated with the differentially expressed genes (DEGs) were analyzed, and transcription factors (TFs) and miRNAs that regu-lated the DEGs were predicted. The goal of the study was to identify novel metastasis-related DEGs in colon adenocarcinoma and provide insights into the mecha-nisms underlying colon adenocarcinoma metastasis, which could potentially inform further studies.
Methods Data source
Gene expression profile dataset GSE40367 [10] was ex-tracted from the Gene Expression Omnibus (GEO) data-base (http://www.ncbi.nlm.nih.gov/geo/). The data were analyzed using Affymetrix Human Genome U133 Plus 2.0 Array (GPL570, Affymetrix, Santa Clara, CA, USA). The dataset included data from 61 primary and meta-static tumor specimens. Data from 14 colon adenocar-cinoma samples, consisting of seven endothelial samples from primary colon adenocarcinoma tissues and seven tumor endothelial samples from matched liver metasta-ses were extracted for further analysis.
Gene expression profile dataset GSE68468 was also downloaded from GEO and analyzed using Affymetrix Human Genome U133A Array (HG-U133A-GPL96). This dataset comprised data from several types of sam-ples, including primary colon cancer, polyps, metastases, and matched normal mucosal samples. Data from 185
metastatic colon cancer tissues and 14 colon carcinoma liver metastases were used for data validation.
Identification of DEGs
The Affymetrix CEL files were downloaded from GEO. The robust microarray analysis method [11] in the Affy package [12] was used for the initial processing of the data. This processing included background correction, quantile normalization, probe summarization, and transla-tion of the probe ID to the gene symbol. Empirical Bayes statistics in LIMMA (Linear Models for Microarray Data, http://www.bioconductor.org/packages/release/bioc/html/ limma.html) package in R (Version 3.0.0) provided by bio-conductor software (http://biobio-conductor.org/help/search/ index.html?q=R+software+/) [13] was utilized to calculate the significance (P value) of the differences in expression of the DEGs between the primary tumor tissues and the matched metastatic tissues. A P value of <0.05 was se-lected as the cutoff criterion for defining DEGs.
Functional enrichment analysis
The online tool called Database for Annotation, Visualization, and Integrated Discovery, (DAVID; version 6.7; http://david.abcc.ncifcrf.gov/) [14] was used to con-duct the Gene Ontology (GO) functional enrichment ana-lysis for cellular components (CC), biological processes (BPs), molecular functions (MFs), and the KEGG (Kyoto
Fig. 1A heatmap of DEGs between primary colon adenocarcinoma tissues and liver metastases. Eachrowrepresents a single gene, and eachcolumnrepresents a sample. Thelabelsbelow represent the sample number in the dataset.Redrepresents upregulation, andblue
Encyclopedia of Genes and Genomes) pathway analysis. A P value of <0.01(calculated using Fisher’s exact test) and gene count >2 were set as the cutoff criteria for the GO functional enrichment analysis. A P value of <0.05 and gene count of >2 were chosen as the cutoff criteria for the KEGG pathway enrichment analysis.
PPI network construction
PPIs among the DEGs were identified using the STRING (Search Tool for the Retrieval of Interacting Genes; http://string-db.org/) database, which integrates a large number of known and predicted protein interactions [15]. PPIs with a combined score of >0.4 were used to Fig. 2The results of the GO and pathway enrichment analyses of the DEGs.BPbiological process,CCcellular component,MFmolecular function,
KEGGKyoto Encyclopedia of Genes and Genomes,GOGene Ontology
construct the PPI network, and the network was visual-ized using Cytoscape (http://cytoscape.org/) [16]. Net-work modules were extracted from the original PPI network based on MCODE analysis [17]. The default pa-rameters (K-Core, 2; degree cutoff, 2; max. depth, 100; node score cutoff, 0.2) were used as the cutoff criteria for the identification of network modules. The GO func-tional and KEGG pathway enrichment analyses of genes in the modules were conducted using the threshold values described above.
Prediction of DEG regulators
TFs that regulate the DEGs identified were predicted using integrated TF platform (ITFP), which contains a large number of mammalian TFs and their targets [18].
miRNAs that regulate the DEGs identified were ana-lyzed using WEB-based gene set analysis toolkit (Web-gestalt; http://www.webgestalt.org) [19]. The threshold number of genes targeted by a regulatory miRNA was defined as≥4. The thresholdP value (calculated by Fish-er’s exact test) was set at <0.01.
Construction of an integrated network
The integrated network consisting of PPIs, TF-DEG pairs, and miRNA-DEG pairs was visualized using Cytoscape. The connectivity degree of the nodes in the network was calculated according to the scale-free prop-erty of the network.
Data validation
Dataset GSE68468 from the GEO database was used to validate the DEGs identified in GSE40367. The DEGs were screened using the same method and threshold values. DEGs common to both datasets were determined using a Venn diagram.
Results
Identification and characterization of DEGs
Compared with the primary samples, 262 genes were upregulated and 216 genes were downregulated in the metastasis samples. The hierarchy cluster analysis of the DEGs was able to distinguish the two groups of samples (Fig. 1), confirming the reliability of the results for sub-sequent analysis.
The biological functions of the DEGs were analyzed using GO and KEGG pathway functional enrichment analyses. The DEGs were predicted to be significantly associated with pathways related to cell adhesion mole-cules (P= 0.03) and pyrimidine metabolism (P= 0.03), as well as several GO functions, including leukocyte activa-tion (P= 0.002), extracellular structure organization (P= 0.005), cell junctions (P= 0.001), and cell adhesion (P= 0.00015; Fig. 2) (Additional file 1).
Analysis of the PPI network and modules
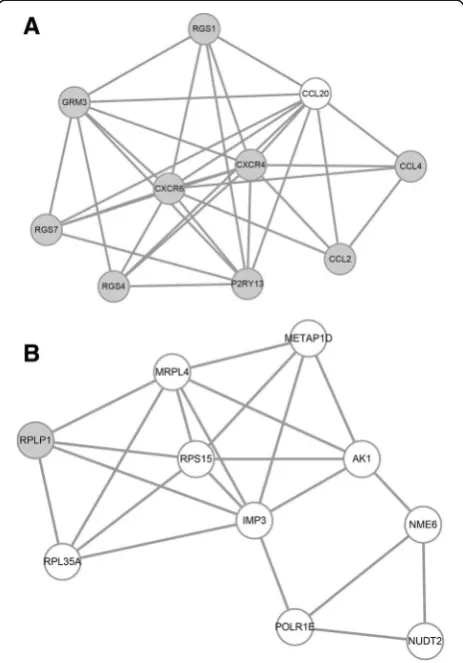
Putative PPIs associated with the DEGs were investi-gated PPIs using STRING. A total of 490 PPIs involving 70 DEGs were identified (Fig. 3). According to the PPI network, FGF2 interacted with ERBB4, PTPRC, and CXCR4andPTPRCinteracted withCXCR4.
A total of 10 modules in the PPI network met the cut-off criteria. The two modules (modules 1 and 2) with the highest scores and several additional nodes were selected for further analysis. Module 1 included 10 DEGs (nine upregulated genes and one downregulated gene), includ-ing CXCR4, CXCR6, C-C Motif Chemokine Ligand 2 (CCL2),CCL4, andCCL20(Fig. 4a). Module 2 also com-prised 10 DEGs (one upregulated gene and nine down-regulated genes), includingRPLP1, RPL35A,RPS15, and MRPL4(Fig. 4b).
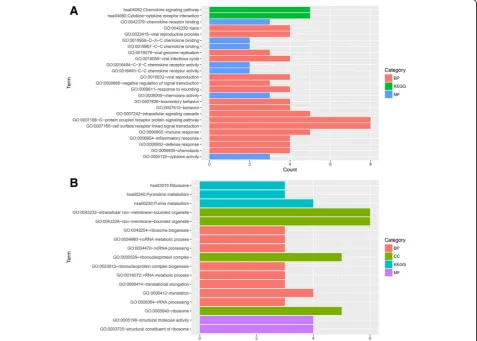
The functional enrichment analysis revealed that DEGs in module 1 were significantly enriched for factors associated with chemokine signaling (P= 0.000025) and cytokine–cytokine receptor interactions (P= 0.000095), as well as several GO functions, including cell surface receptor linked signal transduction (P= 0.00015),
protein coupled receptor protein signaling (P= 0.03), and immune responses (P= 0.00068; Fig. 5a). DEGs in module 2 were markedly enriched for pathways associ-ated with ribosomes (P= 0.00011) and pyrimidine and purine metabolism (P= 0.0049), as well as several GO functions, including ncRNA metabolism (P= 0.005) and ribonucleoprotein complex biogenesis and translation (P = 0.004; Fig. 5b) (Additional file 1).
Prediction of regulatory TFs and miRNAs
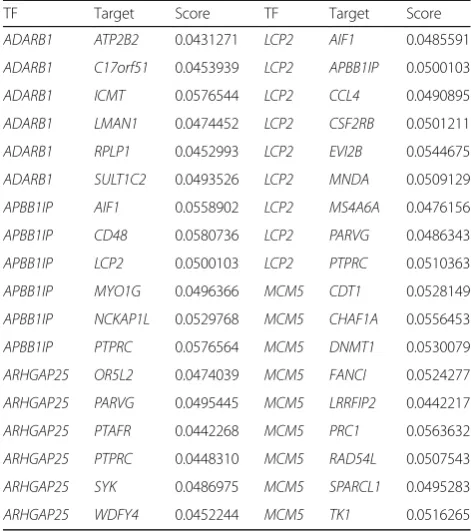
We also investigated TFs and miRNAs that potentially regulate the identified DEGs. Seventeen DEGs encoded TFs that targeted other DEGs. Five DEGs encoding TFs (ADARB1, APBB1IP, ARHGAP25, LCP2, and MCM5) that targeted more than five genes (Table 1) were se-lected for further analysis. A total of 39 miRNAs pre-dicted to regulate the DEGs met the cutoff criteria. The 17 miRNAs associated with the 10 lowestP values (e.g., miR-506, miR-330, miR-17-5P, and miR-124A) targeted a total of 88 DEGs (Table 2).
Analysis of the integrated network
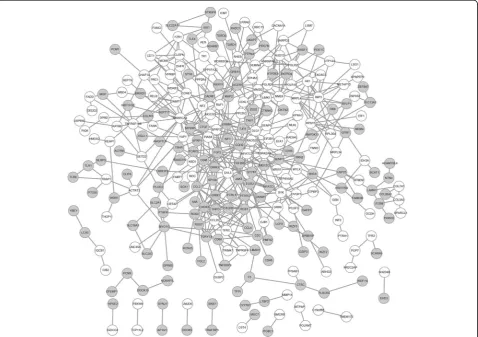
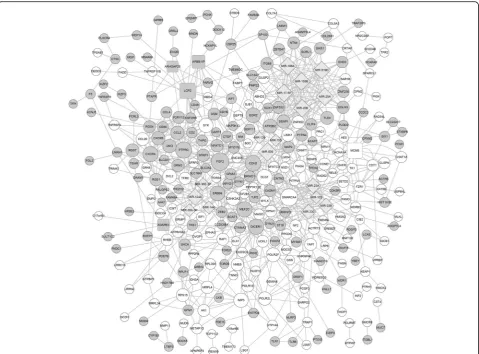
The PPIs, TF-DEG pairs, and miRNA-DEG pairs were used to construct an integrated network comprising 323 nodes and 785 relation pairs (Fig. 6). miRNAs and DEGs with the highest degree of connectivity included miR-506 (degree = 22), FGF2 (degree = 20), miR-106A (de-gree = 20), and SMARCA4 (degree = 19). The degree of
the TF-encoding genes LCP2 and MCM5 was 15
(Table 3). In addition, the network revealed that LCP2 and APBB1IP targeted several DEGs, including PTPRC, and that miR-30a-3p and miR-30e-3p regulated several DEGs, includingERBB4.
Data validation of the DEGs
A total of 5537 DEGs were identified in the comparison of non-metastatic colon carcinoma samples and metas-tasis samples from the GSE68468 dataset. Among them, 147 genes (e.g., FGF2, ERBB4, PTPRC, LCP2, MCM5, CCL2, CCL4, RPL35A, and MRPL4) were identified in both GSE40367 and GSE68468 (Fig. 7).
Discussion
The present study identified 262 genes that were upreg-ulated, and 216 genes were downregulated in liver me-tastasis samples compared with matched primary colon adenocarcinoma samples. In the integrated network con-structed from these data, DEGs with the highest degree of connectivity included FGF2, ERBB4, PTPRC, and CXCR4. FGF2 was predicted to interact with ERBB4, PTPRC,CXCR4, CCL2, and CCL4, whereas PTPRC was predicted to interact withCXCR4.
FGF2 encodes fibroblast growth factor 2, a protein with mitogenic and angiogenic activities, which contrib-utes to tumor growth [20]. FGF2is highly expressed in metastatic CRC [21], consistent with the results of the present study. FGF2 promotes CRC cell migration and invasion via integrin αvβ5-mediated adhesion and FGF receptor-SRC signaling [22]. The IC50 of 5-fluorouracil (5-FU) decreases in cells deficient for FGF2 compared with control CRC cells in vitro [23]. Moreover, high FGF2 expression levels are correlated with a lower re-sponse rate to 5-FU and overall survival in CRC patients [23]. These results indicate thatFGF2plays an important role in colon cancer metastasis. In this study,FGF2was predicted to interact with ERBB4, PTPRC, CXCR4, CCL2, andCCL4. ERBB4encodes Erb-B2 receptor tyro-sine kinase 4, a member of the epidermal growth factor receptor subfamily. ERBB4 is overexpressed in human colon cancer and promotes cellular transformation [24]. A previous study found that ErbB4 and the metastasis-enhancing geneKAI1 C-terminal interacting tetraspanin (KITENIN) can upregulate c-Jun and promote CRC cell invasion [25]. ERBB4 was predicted to be regulated by miR-30a-3p and miR-30e-3p. A previous study reported that miR-30A inhibits EMT in lung cancer [26], suggest-ing that low levels of miR-30A might enhance EMT in cancer. PTPRC encodes a member of the protein tyro-sine phosphatase (PTP) family, which comprises proteins commonly activated in tumors [27]. Consistent with the results of the present study,CXCR4(C-X-C motif chemo-kine receptor 4) is highly expressed in metastatic colon cancer in the liver compared with primary colon cancer tissue, and elevated CXCR4 expression levels contribute to poor survival [28–30]. CCL2 is upregulated in meta-static CRC and functions as a prognostic marker of liver metastasis due its role in recruiting myeloid cells [31]. CCL4has also been shown to play a crucial role in meta-static CRC via interactions with the receptor CCR5 [32, 33]. No other studies have reported an association be-tweenPTPRCand colon cancer metastasis. However, the PTP family member PRL-3 is associated with CRC me-tastasis to the liver and CRC prognosis [34, 35]. As PTPRCwas predicted to interact withCXCR4, we specu-lated thatPTPRC may also be involved in the metastasis of colon cancer to the liver. In this study, PTPRC was predicted to be targeted by TFs encoded by the upregu-lated genes APBB1IP and LCP2. APBB1IP encodes a Rap1-GTP-interacting adaptor molecule. Rap1-GTPase activation mediates breast cancer cell migration [36], and activated Rap1can promote prostate cancer metas-tasis [37].LCP2, also referred to asSLP-76, promotes T-cell development and activation [38]. To date, no other studies have reported an association between APBB1IP and LCP2. However, both genes targeted PTPRC, and PTPRC interacted with FGF2. The aforementioned Table 2The top 10 results of predicted microRNAs with a
lowerPvalue
hsa_ACTGAAA, miR-30A-3P, miR-30E-3P 10 0.0006
hsa_ATACTGT, miR-144 10 0.0006
hsa_AATGTGA, miR-23A, miR-23B 15 0.0006
hsa_ACTGTAG, miR-139 8 0.0006
hsa_AGCATTA, miR-155 8 0.0008
hsa_GCATTTG, miR-105 9 0.0008
Table 1The transcription factors targeting more than five differentially expressed genes
TF Target Score TF Target Score
ADARB1 ATP2B2 0.0431271 LCP2 AIF1 0.0485591
ADARB1 C17orf51 0.0453939 LCP2 APBB1IP 0.0500103
ADARB1 ICMT 0.0576544 LCP2 CCL4 0.0490895
ADARB1 LMAN1 0.0474452 LCP2 CSF2RB 0.0501211
ADARB1 RPLP1 0.0452993 LCP2 EVI2B 0.0544675
ADARB1 SULT1C2 0.0493526 LCP2 MNDA 0.0509129
APBB1IP AIF1 0.0558902 LCP2 MS4A6A 0.0476156
APBB1IP CD48 0.0580736 LCP2 PARVG 0.0486343
APBB1IP LCP2 0.0500103 LCP2 PTPRC 0.0510363
APBB1IP MYO1G 0.0496366 MCM5 CDT1 0.0528149
APBB1IP NCKAP1L 0.0529768 MCM5 CHAF1A 0.0556453
APBB1IP PTPRC 0.0576564 MCM5 DNMT1 0.0530079
ARHGAP25 OR5L2 0.0474039 MCM5 FANCI 0.0524277
ARHGAP25 PARVG 0.0495445 MCM5 LRRFIP2 0.0442217
ARHGAP25 PTAFR 0.0442268 MCM5 PRC1 0.0563632
ARHGAP25 PTPRC 0.0448310 MCM5 RAD54L 0.0507543
ARHGAP25 SYK 0.0486975 MCM5 SPARCL1 0.0495283
ARHGAP25 WDFY4 0.0452244 MCM5 TK1 0.0516265
studies indicate that FGF2 plays an important role in colon cancer metastasis. Therefore,APBB1IP,LCP2, and PTPRCmight also play a role in colon cancer metastasis. Despite the significance of our findings, several limita-tions to this study are worth noting. The results are
solely predictions; therefore, they should be confirmed by laboratory data. Furthermore, our findings should be confirmed in a larger sample size. The expression pat-terns of the genes identified in the present study should be validated by large-scale studies in the future. Fig. 6The integrated network consisting of DEGs, TFs, and miRNAs.Roundandrectangular gray nodesrepresent upregulated genes, andround
andrectangular white nodesrepresent downregulated genes. Therectangular nodesrepresent TFs, anddiamondsrepresent miRNAs
Table 3The nodes with a degree at least 10 in the integrated network
Node Degree Node Degree Node Degree Node Degree
miR-506 22 CDH2 16 miR-330 14 SENP1 11
FGF2 20 CXCR4 15 IMP3 13 APBB1IP 10
miR-106A 20 DICER1 15 SYK 13 CCL20 10
miR-106B 20 DLG1 15 ATP2B2 12 miR-144 10
miR-17-5P 20 LCP2 15 DVL3 12 miR-30A-3P 10
miR-20A 20 MCM5 15 POLR2F 12 miR-30E-3P 10
miR-20B 20 MEF2C 15 CCL2 11 RGS7 10
miR-519D 20 miR-23A 15 CSNK2A2 11 RPS15 10
SMARCA4 19 miR-23B 15 CXCR6 11 TLE4 10
miR-124A 18 EGR2 14 JAK3 11 ZNF652 10
Furthermore, the interactions among the DEGs identi-fied and their relationship with the predicted regulatory TFs and miRNAs should be confirmed.
Conclusions
In conclusion, we identified 262 upregulated and 216 downregulated DEGs in liver metastases originating from colon adenocarcinoma and used these data to con-struct a network of DEGs, regulatory TFs, and miRNAs. Genes that played a prominent role in this network in-cludedFGF2,ERBB4,PTPRC,CXCR4,CCL2, and CCL4. The set of DEGs also comprised genes encoding TFs, in-cluding APBB1IP and LCP2, and miRNAs, including miR-30a-3p and miR-30e-3p. This is the first evidence supporting a role forPTPRC, APBB1IP,LCP2, miR-30a-3p, and miR-30e-3p in colon cancer metastasis. These findings might provide new information that can serve as the basis for future experimental studies.
Additional file
Additional file 1:Result of functional enrichment analysis. (XLSX 24 kb)
Abbreviations
BP:Biological process; CC: Cellular component; CRC: Colorectal cancer; DEGs: Differentially expressed genes; EMT: Epithelial-to-mesenchymal transition; GEO: Gene Expression Omnibus; GO: Gene Ontology; ITFP: Integrated TF platform; KEGG: Kyoto Encyclopedia of Genes and Genomes; MF: Molecular function; miRNAs: MicroRNAs; PPIs: Protein–protein interactions; PTP: Protein tyrosine phosphatase; TFs: Transcription factors
Acknowledgements None.
Funding None.
Availability of data and materials
All data generated or analyzed during this study are included in this published article.
Authors’contributions
SC participated in the design of this study and drafted the manuscript. HW performed the statistical analysis. MY helped draft the manuscript. All authors read and approved the final manuscript.
Competing interests
The authors declare that they have no competing interests.
Consent for publication Not applicable.
Ethics approval and consent to participate Not applicable.
Publisher’s Note
Springer Nature remains neutral with regard to jurisdictional claims in published maps and institutional affiliations.
Author details
1Department of Forensic Medicine of Basic Medical College, Beihua
University, Jilin 132013, Jilin Province, China.2Gastrointestinal Colorectal and Anal Surgery, China-Japan Union Hospital of Jilin University, Changchun 130000, Jilin Province, China.
Received: 24 December 2016 Accepted: 7 June 2017
References
1. Sears C, Garrett W. Microbes, microbiota, and colon cancer. Cell Host Microbe. 2014;15:317–28.
2. Siegel RL, Miller KD, Jemal A. Cancer statistics, 2016. CA Cancer J Clin. 2016; 66:10–29.
3. Todaro M, Gaggianesi M, Catalano V, Benfante A, Iovino F, Biffoni M, et al. CD44v6 is a marker of constitutive and reprogrammed cancer stem cells driving colon cancer metastasis. Cell Stem Cell. 2014;14:342–56. 4. Ling H, Spizzo R, Atlasi Y, Nicoloso M, Shimizu M, Redis RS, et al. CCAT2, a
novel noncoding RNA mapping to 8q24, underlies metastatic progression and chromosomal instability in colon cancer. Genome Res. 2013;23:1446–61. 5. Tenbaum SP, Ordóñezmorán P, Puig I, Chicote I, Arqués O, Landolfi S, et al.
β-catenin confers resistance to PI3K and AKT inhibitors and subverts FOXO3a to promote metastasis in colon cancer. Nat Med. 2012;18:892–901. 6. Mazurek N, Byrd JC, Sun Y, Hafley M, Ramirez K, Burks J, et al. Cell-surface
galectin-3 confers resistance to TRAIL by impeding trafficking of death receptors in metastatic colon adenocarcinoma cells. Cell Death Differ. 2012; 19:523–33.
7. Hur K, Toiyama Y, Takahashi M, Balaguer F, Nagasaka T, Koike J, et al. MicroRNA-200c modulates epithelial-to-mesenchymal transition (EMT) in human colorectal cancer metastasis. Gut. 2013;62:1315–26.
8. Paterson EL, Kazenwadel J, Bert AG, Khew-Goodall Y, Ruszkiewicz A, Goodall GJ. Down-regulation of the miRNA-200 family at the invasive front of colorectal cancers with degraded basement membrane indicates EMT is involved in cancer progression. Neoplasia. 2013;15:180–91.
9. Geng L, Chaudhuri A, Talmon G, Wisecarver JL, Are C, Brattain M, et al. MicroRNA-192 suppresses liver metastasis of colon cancer. Oncogene. 2013; 33:5332–40.
10. Roessler S, Lin G, Forgues M, Budhu A, Hoover S, Simpson RM, et al. Integrative genomic and transcriptomic characterization of matched primary and metastatic liver and colorectal carcinoma. Int J Biol Sci. 2015;11:88–98. 11. Irizarry RA, Hobbs B, Collin F, Beazer-Barclay YD, Antonellis KJ, Scherf U, et al.
Exploration, normalization, and summaries of high density oligonucleotide array probe level data. Biostatistics. 2003;4:249–64.
12. Gautier L, Cope L, Bolstad BM, Irizarry RA. affy—analysis of Affymetrix GeneChip data at the probe level. Bioinformatics. 2004;20:307–15. 13. Ritchie ME, Phipson B, Wu D, Hu Y, Law CW, Shi W, et al. limma powers
differential expression analyses for RNA-sequencing and microarray studies. Nucleic Acids Res. 2015;43:e47.
14. Alvord G, Roayaei J, Stephens R, Baseler MW, Lane HC, Lempicki RA. The DAVID Gene Functional Classification Tool: a novel biological module-centric algorithm to functionally analyze large gene lists. Genome Biol. 2007;8:R183.
15. Szklarczyk D, Franceschini A, Wyder S, Forslund K, Heller D, Huerta-Cepas J, et al. STRING v10: protein–protein interaction networks, integrated over the tree of life. Nucleic Acids Res. 2015;43:D447–52.
16. Kohl M, Wiese S, Warscheid B. Cytoscape: software for visualization and analysis of biological networks. Methods Mol Biol. 2011;696:291–303. 17. Bader GD, Hogue CW. An automated method for finding molecular
complexes in large protein interaction networks. BMC Bioinf. 2003;4:2. 18. Zheng G. ITFP: an integrated platform of mammalian transcription factors.
Bioinformatics. 2008;24:2416–7.
19. Zhang B, Kirov S, Snoddy J. WebGestalt: an integrated system for exploring gene sets in various biological contexts. Nucleic Acids Res. 2005;33:741–8. 20. Brooks AN, Kilgour E, Smith PD. Molecular pathways: fibroblast growth
factor signaling: a new therapeutic opportunity in cancer. Clin Cancer Res. 2012;18:1855–62.
21. Lieu CH, Varellagarcia M, Xu LG, Jiang ZQ, Eckhardt SG, Messersmith WA, et al. Increased gene copy number and amplification of FGF2 and FGFR1 in metastatic colorectal cancer. J Clin Oncol. 2013;31(4_suppl):402–402. 22. Knuchel S, Anderle P, Werfelli P, Diamantis E, Rüegg C. Fibroblast
surface-associated FGF-2 promotes contact-dependent colorectal cancer cell migration and invasion through FGFR-SRC signaling and integrinαvβ 5-mediated adhesion. Oncotarget. 2015;6:410–6.
23. Modest DP, Schulz C, von Weikersthal LF, Quietzsch D, von Einem JC, Schalhorn A, et al. Influence of mRNA expression of fibroblast growth factor 2 (FGF2) in colorectal cancer (CRC) cell lines and in patients with metastatic colorectal cancer (mCRC) treated with FUFIRI or mIrOx (FIRE1). J Clin Oncol. 2016;34:3570. 24. Williams CS, Bernard JK, Beckler MD, Almohazey D, Washington MK, Smith
JJ, et al. ERBB4 is over-expressed in human colon cancer and enhances cellular transformation. Carcinogenesis. 2015;36:710–8.
25. Bae JA, Yoon S, Park SY, Lee JH, Hwang JE, Kim H, et al. An unconventional KITENIN/ErbB4-mediated downstream signal of EGF upregulates c-Jun and the invasiveness of colorectal cancer cells. Clin Cancer Res. 2014;20:4115–28. 26. Kumarswamy R, Mudduluru G, Ceppi P, Muppala S, Kozlowski M, Niklinski J,
et al. MicroRNA-30a inhibits epithelial-to-mesenchymal transition by targeting Snai1 and is downregulated in non-small cell lung cancer. Int J Cancer. 2012;130:2044–53.
27. Ostman A, Hellberg C, Böhmer FD. Protein-tyrosine phosphatases and cancer. Nat Rev Cancer. 2006;6:307–20.
28. Matsusue R, Kubo H, Hisamori S, Okoshi K, Takagi H, Hida K, et al. Hepatic stellate cells promote liver metastasis of colon cancer cells by the action of SDF-1/CXCR4 axis. Ann Surg Oncol. 2009;16:2645–53.
29. Kim J, Mori T, Chen SL, Amersi FF, Martinez SR, Kuo C, et al. Chemokine receptor CXCR4 expression in patients with melanoma and colorectal cancer liver metastases and the association with disease outcome. Ann Surg. 2006;244:113–20.
30. Kim J, Takeuchi H, Lam ST, Turner RR, Wang HJ, Kuo C, et al. Chemokine receptor CXCR4 expression in colorectal cancer patients increases the risk for recurrence and for poor survival. J Clin Oncol. 2005;23:2744–53. 31. Zhao L, Lim SY, Gordon-Weeks AN, Tapmeier TT, Im JH, Cao Y, et al.
Recruitment of a myeloid cell subset (CD11b/Gr1 mid) via CCL2/CCR2 promotes the development of colorectal cancer liver metastasis. Hepatology. 2013;57:829.
32. Bobanga ID, Allen F, Teich NR, Huang AY. Chemokines CCL3 and CCL4 differentially recruit lymphocytes in a murine model of early metastatic colon cancer. J Surg Res. 2014;186:515–6.
33. Halama N, Zoernig I, Berthel A, Kahlert C, Klupp F, Suarez-Carmona M, Suetterlin T, Brand K, Krauss J, Lasitschka F. Tumoral Immune Cell exploitation in colorectal cancer metastases can be targeted effectively by anti-CCR5 therapy in cancer patients. Cancer Cell. 2016;29:587.
34. Peng L, Ning J, Meng L, Shou C. The association of the expression level of protein tyrosine phosphatase PRL-3 protein with liver metastasis and prognosis of patients with colorectal cancer. J Cancer Res Clin Oncol. 2004;130:521–6. 35. Saha S, Bardelli A, Buckhaults P, Velculescu VE, Rago C, Croix BS, et al. A phosphatase
associated with metastasis of colorectal cancer. Science. 2001;294:1343–6. 36. Mcsherry EA, Brennan K, Hudson L, Hill AD, Hopkins AM. Breast cancer cell
migration is regulated through junctional adhesion molecule-A-mediated activation of Rap1 GTPase. Breast Cancer Res. 2011;13:1–14.
37. Bailey CL, Kelly P, Casey PJ. Activation of Rap1 promotes prostate cancer metastasis. Cancer Res. 2009;69:4962–8.
38. Baker RG, Hsu CJ, Lee D, Jordan MS, Maltzman JS, Hammer DA, et al. The adapter protein SLP-76 mediates“outside-in”integrin signaling and function in T cells. Mol Cell Biol. 2009;29:5578–89.
• We accept pre-submission inquiries
• Our selector tool helps you to find the most relevant journal
• We provide round the clock customer support
• Convenient online submission
• Thorough peer review
• Inclusion in PubMed and all major indexing services
• Maximum visibility for your research
Submit your manuscript at www.biomedcentral.com/submit