pISSN 2320-1770 | eISSN 2320-1789
Research Article
Maternal body mass index in outcome of pregnancy
G. Sharmila, M. Sudha*
INTRODUCTION
The increasing prevalence of obesity in young women is a major public health concern. These trends have a major impact on pregnancy outcomes in these women, which have been documented by several researchers. The rising rate of obesity is a major public health concern in the developing countries like India very few females come for preconception counselling so estimation of pre-pregnancy weight record is not available. Women from
rural area are not aware of their weights.1 so, considering this factors we decided to conduct this study as correlation of early pregnancy BMI with foetal outcome. BMI provides a reliable indicator of body fat for most people and is used to screen for weight categories that may lead to health problems WHO describes obesity as one of the most blatantly visible, yet most neglected, public health problems that threaten to overwhelm both more and less developed countries. Obesity is a major public health issue and as per WHO, it is a killer disease Department of Obstetrics and Gynaecology,Neiloufer Medical College, Telangana, India
Received: 04 June 2016
Accepted: 01 July 2016
*Correspondence:
Dr.M. Sudha,
E-mail: geet1379@yahoo.co.in
Copyright: © the author(s), publisher and licensee Medip Academy. This is an open-access article distributed under the terms of the Creative Commons Attribution Non-Commercial License, which permits unrestricted non-commercial use, distribution, and reproduction in any medium, provided the original work is properly cited.
ABSTRACT
Background: The increasing prevalence of obesity in young women is a major public health concern. These trends
have a major impact on pregnancy outcomes in these women, which have been documented by several researchers. The objective of this study was toassess antenatal, intra-partum complications, perinatal outcome in pregnant women with high BMI.
Methods: A total number of 100 cases were included in the study out of which, 50 cases were pregnant women with
high BMI (> or = 30 kg/m2), 50 were pregnant women with normal BMI (20-24 kg/m2). Their pregnancy outcome were observed and compared. The outcome variables evaluated in study were rates of preeclampsia, gestational diabetes, cesarean delivery, failed induction, operative vaginal deliveries, birth weight, and postpartum infection.
Results: Most of the patients that is, 60% of obese group and 68% of control group were between 20-25years, 28% of obese group and 8% of control group were between 31-35years. In our study most of the patients, 66% of obese group and 56% of control group were primiparas, whereas 34% of obese and 44% of normal group were multipara. There is a fourfold increase in the incidence of pre-eclampsia in the obese group compared to normal BMI group. Incidence of gestational diabetes is 2% in normal group compared to 8% in obese group that is fourfold increase in incidence in obese group. Pre-term labor is 8% among obese and 2% among control groups, a significant increase. Incidence of induction of labor is doubled in obese group, incidence being 20% in control group and 40% in obese group. Incidence of instrumental delivery is 14% in obese group and 6% in control group. 32% of obese group underwent cesarean section when compared to 12% of control group. The incidence of cesarean section is 3times higher in obese group. Macrosomia is the most common complication observed in the study, the incidence being 22% in obese group and 2% in control group. There is increase in incidence by eleven fold. Incidence of low APGAR score is increased by twofold.
Conclusions: Maternal BMI shows strong associations with pregnancy complications and outcome. Both maternal and fetal complications are increased.
Keywords: BMI, Obese, Maternal, Fetal complications
at par with HIV and malnutrition. Even in countries like India, significant proportion of overweight and obese coexists with the undernourished. Lifestyle modifications over the years have led to a more sedentary lifestyle. This is of global concern, as excess bodyweight is now the sixth important risk factor contributing to disease worldwide and increased level of obesity may result in a decline in life expectancy in the future.2,3
Obesity causes or exacerbates many health problems, both independently and in association with other diseases. It is associated with the development of type 2 diabetes, coronary heart disease, an increased incidence of certain forms of cancer, respiratory complications and osteoarthritis of large and small joints in later life.4 Increasing degrees of overweight and obesity are important predictors of longevity.5 The impact of low BMI or increased BMI in general population has been focus on many studies but study pertaining to pregnant women are few. Further exploration for this topic is needed. The outcome variables evaluated in study were rates of preeclampsia, gestational diabetes, caesarean delivery, failed induction, operative vaginal deliveries, birth weight, and postpartum infection.
METHODS
It is a prospective non randomized descriptive study conducted in the department of obstetrics and gynecology in Neiloufer Hospital, Telangana. Complications during pregnancy, labor, puerperium studied 50 pregnant women of BMI >25 as cases and controls 50 pregnant women with normal BMI
Inclusion criteria
All women with singleton pregnancies >20 years and <35 years with BMI above 25 without preexisting medical comorbidities.
Exclusion criteria
All women with multiple pregnancy, previous cesarean section, more than 35 years and less than 20 years of age, underweight women, preexisting hypertension and diabetes.
Women were informed about the study. Detailed history regarding name, age, and obstetric score were taken. Estimated gestational age calculated based on recalled LMP or USG studies. Baseline weight and height were recorded during the initial visit in the first trimester and basal BMI was calculated using the formula. The women were placed in standard BMI categories and the obstetric outcome variables were evaluated.
The outcome variables evaluated were rates of preeclampsia, gestational diabetes, cesarean delivery, failed induction, operative vaginal deliveries, birth weight, and postpartum infection.
Basic investigations were carried out like hemoglobin, blood grouping and typing, HIV, HbsAg, HCV, urine routine and microscopy and random blood sugar
Sonography was routinely carried out at first - initial visit (dating scan), second 20-22 weeks for any congenital anomalies (anomaly scan), third - 3rd trimester (growth scan). Patients were subjected to other tests, when required like screening test for diabetes - FBS, PPBS, GTT, platelet count, urine culture and sensitivity, 24 hours urinary protein, serum creatinine, blood urea, serum uric acid and fundoscopy.
Patients having Bp >= 140/90 mmHg on two occasions 6 hours apart were considered as having hypertension and were managed accordingly after performing the necessary investigations. Patients having risk factors for GDM were subjected to screening tests for diabetes and if gestational diabetes was diagnosed it was managed accordingly.
Most of the patients allowed to go into spontaneous labor, were induced as and when required, none of the booked admitted patients were allowed to go for post maturity. Once the patients went in labor, the case was reviewed and pelvis reassessed if need felt so. The progress of labor was assessed periodically by abdominal and vaginal examinations. Any signs of fetal distress were looked for, patients were monitored for spontaneous vaginal delivery, instrumentation or cesarean section was done whenever indicated. Each baby was assessed by the neonatologist soon after the delivery. APGAR score was recorded at one minute and five minutes, weight of the baby recorded. Any complications were treated aggressively. The mother and baby were observed in postnatal period for any complications, women were educated about weight reduction. The observations were then computed and compared to evaluate the problems associated with.
[image:2.595.311.546.579.745.2]RESULTS
Table 1: Comparison of demographic distribution in each group.
Age Controls Obesity Total
20-25 Years 34 (68%) 30 (60%) 64 26-30 Years 12 (24%) 6 (12%) 18 31-35 Years 4 (8%) 14 (28%) 18
Gravida
Primi 28 (56%) 33 (66%) 61 Multi 22 (44%) 17 (34%) 39
Rate of pre-eclampsia
Yes 2 (4%) 8 (16%) 10 No 48 (96%) 42 (84%) 90
Gestational diabetes
Of the total number of 100 cases in this study (68%) of normal pregnant and 30 cases (60%) of obese pregnant group women were of 20-25years age. 61 were primi and 39 were multi. Among 61 cases 28 cases (56%) from normal group and 33 cases (66%) from obese group were primi para 10 cases developed pre-eclampsia in this study. Among the 10 cases, 2 cases (4%) belong to normal group and 8cases (16%) to obese group. 48 cases of normal group and 8 cases (16%) remained normotensive.
[image:3.595.311.548.163.339.2]5 cases developed gestational diabetes among which only 1case (2%) belongs to normal group and 4 cases (8%) in obese group. 49 cases in normal group and 46 cases in obese group remained normoglycemic in this study.
Table 2: Comparing rate of various parameters in labor of two groups.
Pre-term labor
Normal group(N=50)
Obese group
(N=50) Total
Yes 1 (2%) 4 (8%) 5 No 49 (98%) 46 (92%) 95
Labor
Induced 10 (20%) 22 (44%) 32 Spontaneous 40 (80%) 28 (56%) 68
Mode of delivery
Normal
delivery 41 (82%) 27 (54%) 68 Forceps 3 (6%) 7 (14%) 10 Caesarean
section 6 (12%) 16 (32%) 22
Birth weight (kg)
<2.5 5 (10%) 5 (10%) 10 2.5-3.5 44 (88%) 38 (76%) 82 >4 1 (2%) 11 (22%) 12
In total number of 100 cases in this study 95 patients delivered at term and 5 patients had preterm delivery among which 1 (2%) case belongs to the group of normal BMI and 4 cases (8%) to that of obese group.
In total 100 cases in this study, 68 cases had spontaneous labor and 32 cases needed induction. Among the 32 cases with induced labor, 10 cases (20%) were from normal BMI group and 22 cases (44%) were from obese group.
Among the total number of 100 cases, 68 had normal vaginal delivery, 10 cases required out forceps and 22cases were delivered by caesarean section. Out of the 10cases with normal delivery, 3 (6%) cases were from normal BMI group, 7 cases were from obese group. Out of the 22 cases who delivered by caesarean section, 6 cases (12%) were from normal BMI group and 16 cases (32%) were from obese group.
82 with normal birth weight and 8 infants were born with macrosomia. Among 8 infants with macrosomia, only 1 infant is from the group with normal BMI and 7 infants
[image:3.595.52.286.290.500.2]were from the obese group. Among 100 cases in the study 5 infants were born with low APGAR score in which only one infant is from normal BMI group and 4 from obese group.
Table 3: Comparing the APGAR score and fetal, neonatal, maternal complications.
APGAR score Normal
group
Obese
group Total
<6 1 (2%) 4 (8%) 5 7-10 49 (98%) 46 (92%) 95
Fetal and neonatal complications
Macrosomia 1 (2%) 11 (22%) 12 Low APGAR 1 (2%) 4 (8%) 5
Maternal complications and outcome
Pre-eclampsia 2 (4%) 89 (16%) 10 Gestational diabetes 1 (2%) 4 (8%) 5 Preterm labor 1 (2%) 4 (8%) 5 Induction of labor 10 (20%) 22 (44%) 32 Forceps delivery 3 (6%) 7 (14%) 10 Caesarean section 6 (12%) 16 (32%) 22
There is a fourfold increase in the incidence of pre eclampsia in the obese group. Pre-eclampsia is closely followed by gestational diabetes and preterm labor. Incidence of gestational diabetes is increased fourfold in obese group. Pre-term labor is 8% among obese and 2% among control groups, a significant increase. Obese group had two fold increase in induced labours and threefold increase in caesarean section rate.
Among fetal complications macrosomia is the most common complication observed in this study, the incidence being 22% in obese group and 2% in control group, a eleven fold increase. Incidence of low APGAR score or fetal distress is increased by twofold.
DISCUSSION
Obesity has become one of the major public health problems in the world. Incidence of obesity is on rise in developing countries including India. Obesity not only affects the mother but also has hazardous effect of the fetus and is also responsible for the offspring overweight or obesity. Because the overall prevalence of obesity has increased over the past decades, the prevalence of obesity complicating pregnancy has also increased.
Table 4: Distribution of age and parity comparing with other studies.
Age Control
group
Obesity group
Vahratian et al6 (obese group)
Cedergren et al7 (obese group) 20-25
years 34 (68%) 30 (60%) 56% 58% 26-30
years 12 (24%) 6 (12%) 15% 16% 31-35
years 4 (8%) 14 (28%) 29% 26%
Parity wise distribution
Primi 28 (56%) 33 (66%) 63% 65% Multi 22 (44%) 17 (34%) 37% 35%
In this present study majority of obese group were between 20 and 25 years, followed by 31 and 35 years. In a study conducted by Vahratian et al majority of obese group were between 20-25 years.6 In a study conducted by Cedergren et al, majority of obese group were between 20-25 years.7
In the present study 66% of obese patients were of primigravida and 34% were of multigravida. In a study conducted by Cedergren et al, 65% of obese group were primigravida and 35% were of multigravida.7
In a study conducted by sohinee Bhattacharya et al, 14.7% of obese women developed pre-eclampsia.11 In our present study pre-eclampsia developed in 16% of obese women. Incidence of pre-eclampsia is 4times higher in obese group compared to normal BMI group in this study.
In a study conducted by Cedergren et al, 6% of obese women developed gestational diabetes mellitus. In our study 8% of obese women developed GDM.7 Obese women 4 times more incidence of GDM. This result is mostly due to increased insulin resistance in obese patients.
In one study conducted by Sohinee Bhattacharya et al, incidence of pre-term labor was higher in control group and only 1.25 times increased incidence in obese group.11 In the present study the incidence of preterm labor in obese group is 8% and 2% in normal BMI group and there is four times increase in rate of pre-term labor in obese group. However increase is higher in present study, which probably reflects increased number of women who are anemic and of low socioeconomic status compared to above studies. In addition small number of patients in present study could also contribute to this result.
In our study the incidence of instrumental delivery in obese group is 14%. In a study conducted by Cedergren et al, the incidence of instrumental delivery is 39%.7 This difference may be due to the use of instrumental delivery
as a prophylactic measure in other studies, whereas in this study forceps was used when and only indicated.
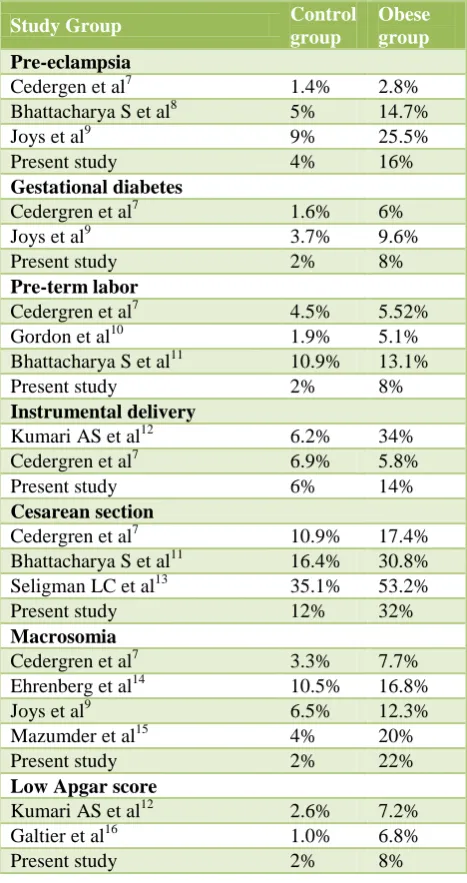
Table 5: various parameters in present study compared to other studies.
Study Group Control
group
Obese group
Pre-eclampsia
Cedergen et al7 1.4% 2.8% Bhattacharya S et al8 5% 14.7% Joys et al9 9% 25.5% Present study 4% 16%
Gestational diabetes
Cedergren et al7 1.6% 6% Joys et al9 3.7% 9.6% Present study 2% 8%
Pre-term labor
Cedergren et al7 4.5% 5.52% Gordon et al10 1.9% 5.1% Bhattacharya S et al11 10.9% 13.1% Present study 2% 8%
Instrumental delivery
Kumari AS et al12 6.2% 34% Cedergren et al7 6.9% 5.8% Present study 6% 14%
Cesarean section
Cedergren et al7 10.9% 17.4% Bhattacharya S et al11 16.4% 30.8% Seligman LC et al13 35.1% 53.2% Present study 12% 32%
Macrosomia
Cedergren et al7 3.3% 7.7% Ehrenberg et al14 10.5% 16.8% Joys et al9 6.5% 12.3% Mazumder et al15 4% 20% Present study 2% 22%
Low Apgar score
Kumari AS et al12 2.6% 7.2% Galtier et al16 1.0% 6.8% Present study 2% 8%
In the present study, there is an increase in the rate of cesarean section by 3 times in the obese group when compared to control group and this incidence is comparable to the study conducted by Oded langer et al in which 10.2% of normal BMI group and 39% of obese group had cesarean section that is about four times increased rate.17 In a study conducted by Seligmen LC et al incidence of cesarean rate was higher in normal BMI group, and there was only 1.5 times increased risk in obese group.13
that in other studies, the cut off for macrosomia being birth weight >4.5 kg, where as in our study 4 kg being taken as the cut off. Limited number of cases in the study group may also contribute to this result.
In our study, the incidence of low APGAR score in control group is 2% and in obese group 8% which is comparable to other studies. There is increased incidence of low Apgar score (<3) by 4 fold. The increased incidence of prolonged labor, meconium stained liquor in obese group explains the increased of low APGAR score.
CONCLUSION
Maternal BMI shows strong associations with pregnancy complications and outcome. Both maternal and fetal complications are increased. Attempt should be made to prevent obesity in women of childbearing age and encourage weight loss to attain ideal weight before pregnancy.
It is beneficial to monitor overweight and obese women carefully, so as to intervene earlier if complications arise. Effort should be made to educate about obesity and appropriate weight gain in pregnancy, particularly for women with high pre-pregnancy BMI. Pre-pregnancy and early pregnancy dietary counseling of obese women should include education about appropriate intake of calories and nutrients to meet the needs of pregnant women and developing embryo.
Funding: No funding sources Conflict of interest: None declared
Ethical approval: The study was approved by the Institutional Ethics Committee
REFERENCES
1. Kopelman PG. Causes and consequences of obesity.
Med Int. 1994;22:385-8.
2. James WP. WHO recognition of the global obesity
epidemic. Int J Obes (Lond). 2008;32(Suppl 7):S120-6.
3. Haslam DW, James WP. Obesity. Lancet.
2005;366:1197-209.
4. Kopelman PG. Obesity as a medical problem.
NATURE. 2006;404.
5. Lew EA. Mortality and weight: insured lives and the
American cancer study. Annals of Intern Med. 1985;103:1024-9.
6. Vahratian A, Siega-Riz AM, Savitz DA, Zhang J.
Maternal pre-pregnancy overweight and obesity and the risk of cesarean delivery in nulliparous women. Ann Epidemiol. 2005;15:467-747.
7. Cedergren MI. Maternal morbid obesity and the risk
of adverse pregnancy outcomes. Obstet Gynecol. 2004;103:219-24.
8. Bhattacharya S, Campbell DM, Liston WA,
Bhattacharya S. Effect of body mass index on
pregnancy outcomes in nulliparous women
delivering singleton babies. BMC Public Health. 2007;7:168.
9. Joy S, Istwan N, Rhea D, Desch C, Stanziano G. The
impact of maternal obesity on the incidence of adverse pregnancy outcomes in high-risk term pregnancies. Am J Perinatol. 2009;26:345-9.
10. Gordon CS. Smith. Maternal obesity in early
pregnancy and risk of spontaneous and elective preterm deliveries: a retrospective cohort study. Am J Public Health. 2007;97(1):157-62.
11. Bhattacharya S, Campbell DM, Liston WA,
Bhattacharya S. Effect of body mass index on
pregnancy outcomes in nulliparous women
delivering singleton babies. BMC Public Health. 2007;7:168.
12. Kumari AS. Pregnancy outcome in women with
morbid obesity. International Journal of Gynecology and Obstetrics. 2001;73(2):101-7.
13. Seligman LC, Duncan BB, Branchtein L, Gaio DS,
Mengue SS, Schmidt MI. Obesity and gestational
weight gain: cesarean delivery and labor
complications. Rev Saude Publica. 2006;40:457-65.
14. Ehrenberg HM, Durnwald CP, Catalano P, Mercer
BM. The influence of obesity and diabetes on the risk of caesarean delivery. Am J Obstet Gynecol. 2004;191:969-74.
15. Mazumder U, Sarker S, Riaz BK, Chowdhury TA.
Maternal over weight and obesity: its effect on
pregnancy outcome. Mymensingh Med J.
2011;20:213-8.
16. Galtier-Dereure F, Boegner C, Bringer J. Obesity and
pregnancy: complications and cost. American Journal of Clinical Nutrition. 2000;71(5):1242S-1248s:4:989-97.
17. Oded Langer, Yogev Y, Most O, Xenakis EM.
Gestational diabetes: The consequences of not treating. 2005;192(4):989-97.