DOI: http://dx.doi.org/10.26483/ijarcs.v8i9.4929
Volume 8, No. 9, November-December 2017
International Journal of Advanced Research in Computer Science
RESEARCH PAPER
Available Online at www.ijarcs.info
ISSN No. 0976-5697
ENHANCING FILTER BASED ALGORITHMS FOR SELECTING OPTIMAL
FEATURES FROM THYROID DISEASE DATASET
K.Pavya
Assistant Professor, Department of Computer Science,
Vellalar College for Women, Erode, India
Dr.B.Srinivasan
Associate Professor Department of Computer Science,
Gobi Arts and Science College, Erode, India
Abstract: In medical science, automatic disease diagnosis is an invaluable tool because of restricted observation of the specialist and uncertainties in medical knowledge. Advances in medical information technology have enabled healthcare industries to automatically collect huge amount of data through clinical laboratory examinations. To explore these data, the past few years have envisaged the use of Computer Aided Diagnosis (CAD) systems in many screening sites and hospitals. While using CAD, thyroid function diagnosis is considered as a classification problem, which can automatically identify the type of thyroid (hyper, hypo or normal). Machine learning techniques are increasingly introduced to construct the CAD systems owing to its strong capability of extracting complex relationships in the biomedical data.
Keywords: Thyroid disease, Filter based, Feature Selection, Classifier, Support Vector Machine, Data Mining
1. INTRODUCTION
Data mining plays a vital role in medical field for disease diagnosis. It offers lot of classification techniques to predict the disease accuracy [1]. The computer based analysis system indicates the mechanized medical diagnosis system. This mechanized diagnosis system support the medical practitioner to make good decision in treatment and disease [2].Classification maps data into predefined groups or classes. It is frequently referred to as supervised learning because the classes are determined before examining the data [3].Filter based method selects the feature without depending upon the type of classifier used. The advantage of this method is that, it is simple and independent of the type of classifier used so feature selection need to be done only once [4].
A. THYROID DISEASE
Thyroid disease (TD) is a study of Endocrinology and is considered as one of the most common diseases that is frequently misunderstood and misdiagnosed. Thyroid disease is a medical condition that affects the function of the into the two categories. They are
• Hyperthyroidism - Condition when the thyroid produces too much hormone, which makes the body use energy faster than it should.
• Hypothyroidism. – Condition when the thyroid doesn’t produce enough hormones, which makes the body use energy slower than it should.
Patients with this disease have a complex relationship with metabolism and body weight and unless treated properly, can lead to serious faults like Decreased taste, Decreased smelling ability, Memory loss and Depression. Thus, early and correct diagnosis of this disease is an important task of medical diagnosis.
B. THYROID DISEASE DIAGNOSIS
Proper interpretation of the thyroid data besides clinical examination and complementary investigation is an important issue in the diagnosis of thyroid disease. Doctors can incorporate numerous factors, including clinical evaluation, blood tests, imaging tests, biopsies, and other tests to diagnose thyroid disease. A common used method is a test, called the thyroid-stimulating hormone (TSH) test, which can identify thyroid disorders even before the onset of symptoms. Usage of CAD systems for diagnosis provides multiple advantages
• Can minimize the operator-dependent nature inherent in medical imaging systems and can make the diagnostic process reproducible.
• Help to improve the accuracy of diagnosis
• Can work with features (like computational features and statistical features) that cannot be obtained through visual analysis or through intuitive examinations.
2. LITERATURE REVIEW:
Zhenning Wu et. al., [5] have proposed a PIM-clustering-based FSVM algorithm for classification problems with outliers or noises. The experiments have been conducted on five benchmark datasets to test the generalization performance of the PIM- FSVM algorithm. Their results have shown that the PIM-FSVM algorithm presents more reasonable memberships and is more robust than other methods used in their paper for classification problems with outliers or noises. Second, the computational complexity of the PIM-FSVM algorithm is presented, which is not more complex or even less complex than other methods.
relationships with other algorithms. Theoretical analysis and all experimental results shown that, the S-TWSVM can more fully exploit this prior structural information to improve the classification accuracy.
Himanshu Rai et. al., [7] have introduced a novel and efficient approach for iris feature extraction and recognition. They compared the recognition accuracy with the previous reported approaches for finding better recognition rate than using SVM or Hamming distance alone. They claim for the increase of efficiency, when they used separate feature extraction techniques for SVM and Hamming distance based classifier and proven that the accuracy of the proposed method is excellent for the CASIA as well as for the Chek image database in term of FAR and FRR.
Zuriani Mustaffa et. al., [8], have reported empirical results that examine the feasibility of eABC-LSSVM in predicting prices of the time series of interest. The performance of their proposed prediction model was evaluated using four statistical metric, namely MAPE, PA, SMAPE and RMSPE and experimented using three different set of data arrangement, in order to choose the best data arrangement for generalization purposes. In addition, the proposed technique also has proven its capability in avoiding premature convergence that finally leads to a good generalization performance.
Khyati K. Gandhi, Prof. Nilesh B. Prajapati in 2014 performed[9] feature selection techniques on diabetes data set (Pima Indian diabetic database) from UCI repository. F-score, ReliefF and Genetic Algorithm are used for feature selection from the diabetes dataset and then the classification is performed by using Support Vector Machine classifier. It has been analyzed that the performance of SVM is better enhanced by using F-score technique on diabetes dataset. The accuracy achieved by F-score is more than the other methods. The accuracy of Genetic Algorithm is analyzed by using Support Vector Machine as well as by Artificial Neural Networks. The result shown that the accuracy achieved is more in case of SVM.
Xiaobo Li et al in 2011 presented [10] a comparison of seven different feature selection techniques on multiclass cancer dataset. The seven feature selection methods are Correlation based, Chi-Squared, Gain Ratio, Information Gain, ReliefF, SVM-RFE and Symmetrical Uncertainty. The experimental results show that the feature selection by using SVM-RFE gives better performance than other six methods. The feature selection on multiclass cancer is critical, but it is possible to achieve better accuracy on the dataset by using proper feature selection and classification methods.
B Zheng et al in 2013 proposed [11] a model that is a hybrid of K-Means and Support Vector Machine. The model is implemented on breast cancer dataset to diagnose cancer based on the extracted features of tumor. Kmeans is used for finding the hidden pattern of tumor and SVM for classification of features. There are two types of tumors: malignant (are cancerous) and benign (can’t be cancerous, can be removed). The classifier separates these two types of tumors. The k-means is used for clustering the patterns of the similar tumor based on the features of malignant and benign tumors. The membership function is used to measure the similarity of the data point and the tumor. The results
show that the K-means and SVM hybrid model reduces the time required for prediction with higher rate of accuracy.
Esin Dogantekin [12] [13] have proposed two hybrid method for thyroid disease diagnosis. One method is based on principal component analysis and least square support vector machine and has produced 97.67% accuracy. The other method is based on Generalized Discriminate Analysis and wavelet support vector machine and this method has achieved 91.86% of accuracy. For both these studies thyroid dataset has been downloaded from UCI machine learning repository
S. Yasodha et al.[14] have proposed CACC-SVM techniques which is hybridization of class-Attribute Contingency Coefficient (CACC) and support vector machine(SVM) for classification of thyroid data. The proposed model achieved better accuracy compared to other traditional models.
Nikita Sigh and Alka Jindal [15] have concluded that SVM is better classifier as compared to KNN and Bayesian. Accuracy of SVM is about 84.62%. KNN found the nearest neighborhood automatically. It represented by the graph each vertices having object. Bayesian based on the probability classification which gives the sample data belongs to a class.
3. METHODOLOGY:
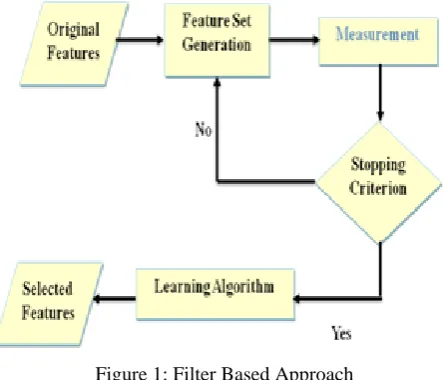
Filter-based algorithms rely on general characteristics of the data to evaluate and select feature subsets without involving any mining algorithm.
Figure 1: Filter Based Approach
[image:2.595.325.547.413.603.2]The filter based algorithm, uses implicit subset evaluation method, in order to select optimal features that are both non-redundant and relevant.
Table I : The characteristics of Filter method
Items Filters
Processing Speed Fast
Classification Accuracy Depends
Depend on Learning Methods No
A. IMPROVES MULTIPLE FILTER-BASED FS (IMFSS) ALGORITHM
To solve these issues, this research work proposes a filter-based algorithm
• Uses two selection criteria instead of one to select features
• Identifies both relevant and redundant features
• Considers both feature-feature relationship and feature-class relationship
• Uses a combination method that can combine the results of the two algorithms in an optimal manner
Advantages of the proposed IMFFS algorithm
• Time complexity is improved by first selecting relevant features and then removing redundant features from the reduced set having only relevant features.
• Subset feature quality is improved by using two filter criteria, instead of using one as in conventional methods
• Minimizes discrepancies and thus increases the performance during thyroid disease classification
1. Feature Analysis Using Multiple Measures
• Relationship in this research is analyzed using four measures
• Information Gain – Termed as Maximum Relevant Minimum Redundant FS Based on IG (MRMR-IG)
• Mutual Information – Termed as Maximum Relevant Minimum Redundant FS Based on MI (MRMR-MI)
• These two measures were used because
• Information Gain – results with maximum informative features
• Mutual Information – results with features having maximum discrimination ability
• Using these measures two types of relationships are estimated
• Class-Feature Relation (C-F-R) - measures relationship between a features A and the class C.
• Feature-Feature Relation (F-F-R) - measures relationship between a pair of features A and B.
Table II: Analysis of Filter-Based Algorithms Coding Scheme Used
CODE DESCRIPTION
No FS No Feature Selection IG Information Gain MI Mutual Information
MRMR-IG Maximum Relevant Minimum Redundant FS Based on IG MRMR-MI Maximum Relevant Minimum
Redundant FS Based on MI IMFFS Improved Multiple Filter-Based
Feature Selection
2. MRMR-IG
• Step 1 : Relevancy Analysis
• Step 1a : Calculated C-F-R of each feature
• Step 1b: Select feature with highest C-F-R as feature that is relevant to a class C. // Let the set of relevant features identified be denoted as F*.
• Step 2 : Redundancy Analysis
• Step 2a : Apply Markov Blanket on F*
• Step 2b : Identify predominant (features which have maximum F-F-R with its class and does not repeat itself) using Markov blanket algorithm
• Step 2c : Remove non-predominant features related to that class
• Step 2d : Repeat steps 2a-2c until no more predominant feature is found
• Step 3 : Return remaining predominant features as selected features
3. MRMR-MI
• Step 1 : Estimate MI of all features in F
• Step 2 : Select fi with maximum MI
• Step 3 : Add fi to Fnew and Remove fi from F
• Step 4 : Repeat
Estimate sum of F-F-R(fi, fnew) AF = Average F-F-R(fnew) Estimate C-F-R(fnew,C) for all features in F
• Step 5 : Select next fnew that has maximum AF but minimum C-F-R
• Step 6 : Go to Step 3 until all fi are processed
• Step 7 : Return Fnew as selected features
4. Combining MRMR-IG and MRMR-MI
• To design a method that combine the results of MRMR-IG and MRMR-MI to obtain a final feature set that is stable without decreasing classification accuracy.
• This scoring method is termed as ‘Scoring Method to Combine MRMR-IG and MRMR-MI (SCC)’
• Steps Involved in SCC:
• Let F1 be the feature set result of MRMR-IG and F2 be the feature set result of MRMR-MI
• Let NF1 = Normalize F1 and NF2 = Normalized F2
• Construct IGMI_Vector with NF1 and NF2
• Calculate Magnitude of IGMI_Vector (MIV) as square root of sum of NF1 and NF2
• Order features in descending order of MIV
• Select top K features as optimal features of proposed IMFFS algorithm
B. Advantages of using SCC in IMFFS
• IGMI_Vector contains information about both IG and MI based MRMR feature selection algorithm
• The SCC method increases the performance of both FS and classification algorithm better than using Boolean operators like Union or Intersection (which are normally used to combine feature selection results from multiple algorithms)
[image:4.595.324.529.63.271.2]4. EXPERIMENTAL ANALYSIS
Figure 2: Analysis of Filter Based Algorithms Accuracy (%)
[image:4.595.44.247.154.341.2]Figure 3: Analysis of Filter Based Algorithms Sensitivity (%)
[image:4.595.322.529.317.537.2]Figure 4: Analysis of Filter Based Algorithms Specificity (%)
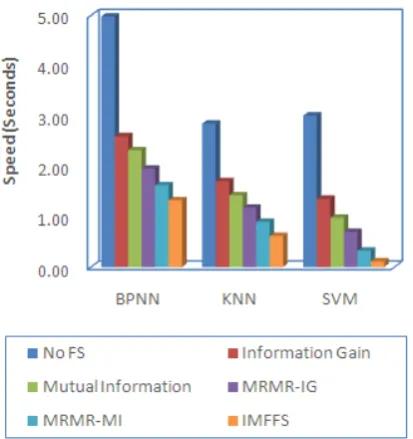
Figure 5: Analysis of Filter Based Algorithms Speed (Seconds)
5. RESULTS AND DISCUSSION
In the experiments discussed, the analysis of the feature selection algorithm performance was done using three frequently used classifiers, namely, BPNN (Back Propagation Neural Network), KNN (K Nearest Neighbor) and SVM (Support Vector Machine) classifier. From the results, it is clear that the SVM produces high accuracy and hence the next research work is planned to improve the working of SVM.
6. CONCLUSION
[image:4.595.41.249.374.536.2]of the proposed IMFFS algorithm is better in terms of all the selected performance metrics, when compared to the conventional algorithm. This indicates that the algorithm is able to remove maximum redundant algorithm while preserving the relevant (or important) data.
REFERENCES
[1] Srinivasan, B. and Pavya, K. “Diagnosis of Thyroid Disease Using Data Mining Techniques: A Study”, International Research Journal of Engineering and Technology, Vol.3, no.11, 2016, PP. 1191-1194.
[2] Srinivasan, B. and Pavya, K. “A study on data mining prediction techniques in healthcare sector”, International Research Journal of Engineering and Technology, Vol.3, no.3, 2016 ,PP. 552-556.
[3] Srinivasan, B. and Pavya, K. “ A Comparative Study on Classification Algorithms in Data Mining”, International Journal of Innovative Science, Engineering & Technology, Vol. 3,no.3, 2016, PP. 415-418.
[4] Srinivasan, B. and Pavya, K. “Feature Selection Techniques in Data Mining: A Study”, International Journal of Scientific Development and Research (IJSDR), Vol.2, no.6, 2017, PP. 594-598.
[5] Z. Wu, H. Zhang and J. Liu, “A fuzzy support vector machine algorithm for classification based on a novel PIM fuzzy clustering method”, Neurocomputing, vol. 125, 2014, pp. 119–124.
[6] Z. Qi, Y. Tian and Y. Shi, “Structural twin support vector machine for classification”, Knowledge-Based Systems, vol. 43, 2013, pp. 74–81.
[7] H. Rai and A. Yadav, “Iris recognition using combined support vector machine and Hamming distance approach”, Expert Systems with Applications, vol. 41, 2014, pp. 588– 593.
[8] Z. Mustaffa, Y. Yusof and S. S. Kamaruddin, “Enhanced artificial bee colony for training least squares support vector machines in commodity price forecasting”, Journal of Computational Science, vol. 5, no. 2, March 2014, pp. 196– 205.
[9] Gandhi, K. K., & Prajapati, N. B. “Study of Diabetes Prediction using Feature Selection and Classification” In International Journal of Engineering Research and Technology,Vol. 3, No. 2 ,February2014. ESRSA Publications.
[10] Xiaobo Li, Peng, S., Zhan, X., Zhang, J., & Xu, Y. (2011, October). “Comparison of feature selection methods for multiclass cancer classification based on microarray data”. In Biomedical Engineering and Informatics (BMEI), 2011 4th International Conference on IEEE. Vol. 3, pp. 1692-1696. [11] Zheng, B., Yoon, S. W., & Lam, S. S.. “Breast cancer
diagnosis based on feature extraction using a hybrid of K-means and support vector machine algorithms”. Expert Systems with Applications, vol.41,no.4, 2014, pp.1476- 1482. [12] Esin Dogantekin,Asif Dogantekin,Derya Avci.(2010)”An
automatic diagnosis system based on thyroid gland:ADSTG‖”,Expert system with applications, vol.37,no.9,2010,pp.6368-6372.
[13] Esin Dogantekin,Asif Dogantekin,Derya Avci. “An expert system basedon generalized discriminant analysis and wavelet support vector machine for diagnosis of thyroid diseases” Expert system with Application, vol.38, no.1, 2011, pp.46-150.
[14] S.Yasodha and P. S.Prakash,“Data Mining Classification Technique for Talent Management using SVM”, International Conference on Computing, Electronics and Electrical Technologies (ICCEET), 978-1-4673-02l0-4/12,2012, pp. 959-963.