International Journal of Advanced Research in Computer Science RESEARCH PAPER
Available Online at www.ijarcs.info
PI
3Vivek Thapar Ph.D. Research Scholar I.K.G. Punjab Technical University
Kapurthala, Punjab, India
Performance Model of Software as a Service (SaaS) Cloud Environment
Dr. O.P. Gupta Associate Professor and Head
School of Electrical Engg. & Information Technology PAU, Ludhiana, Punjab, India
Abstract: Cloud computing is a vibrant and dynamic technology. Cloud users can subscribe to various types of cloud services like Infrastructure as a Service (IaaS), Platform as a Service (PaaS), and Software as a Service (SaaS) etc. offered to clients by various cloud service providers like Amazon, Microsoft, Google, IBM, Facebook, Twitter, and WhatsApp etc. SaaS service model is the most popular service model of the cloud. In this service model, cloud user downloads the Application (App) of the cloud service provider (CSP) and interacts with the resources of the CSP by using the App. The App execution engine is placed at various data centers located at different locations by the CSP to optimize the performance of the App. The placement of Cloud App execution engine at various data centers by the CSP plays a vital role in overall performance of SaaS cloud environment. In this paper, we address this issue and propose a performance model of SaaS cloud environment to aid the CSP to optimally place the App execution engine at various locations to improve the overall performance of the Cloud App. The proposed performance model is named as
PI3(π3)
Keywords: Cloud performance model, SaaS, Performance model of SaaS cloud, Performance parameters of the cloud.
(Prodigal, Ideal, Impoverished, and Inefficient) uses two important performance metrics response time of user request and cost of providing services and it classifies the performance of the SaaS cloud environment into four types: Prodigal, Ideal, Impoverished and Inefficient. Finally, we use the proposed model to analyze and optimize the performance of a SaaS cloud environment.
I. INTRODUCTION
Cloud computing has revolutionized the computing world. The term stems back from 1961 when championed computer scientist John McCarthy suggests that computers might be used one day as a public utility. The growth of internet users, internet data, web-based services, smart phones, electronic gadgets and other related technology produces a very conducive environment for the growth of cloud computing during the last decade. Around 40% of the world population has an internet connection today [1]. The number of internet users has grown manifold from 16 million in December 1995 to 3,366 million in December 2015 [2]. Traditional computing techniques and methods are not enough to handle the ever-increasing number of users and devices on the internet. Cloud computing is the way to handle massive computing requirements. In cloud computing, physical resources are virtualized and offered to users on pay as you go model. The users can scale up and down the resources as per their requirement. Various types of services are offered to clients on pay as you go model. The cloud services can be broadly categorized into three types: Infrastructure as a Service (IaaS), Platform as a Service (PaaS) and Software as a Service (SaaS). In IaaS service model virtualized computing resources like computers, storage, and networking are offered to clients on a subscription basis. Various players like Amazon EC2 (Elastic Computer Cloud), Microsoft Azure, and IBM Smart cloud etc. offer IaaS service to clients. In PaaS service model, clients are provided with the platform allowing them to develop, run, and manage applications. Google App Engine and Microsoft Azure are some of the big players offering PaaS services to clients on pay as you go model. SaaS provides access to
applications as a service to the clients. Various social networking sites like Facebook, Twitter, and WhatsApp etc. falls under the category of SaaS.
SaaS is a software or application distribution model in which cloud service provider hosts software and application and makes them available to clients over the internet. SaaS service model is gaining popularity among governments in delivering public services to population e.g. booking of rail tickets, air tickets, paying off electricity bills, and telephone bills etc. The ‘Digital India’ idea of Government of India is a step towards digitizing the delivery process of public services to masses. One of the key pillars in the success of ‘Digital India’ concept is SaaS service model. In this scenario, a Cloud Application (App) is used by the client to access the services provided by the government. Most of the organizations are outsourcing their application and software distribution model to the data centers of the cloud provider. It eliminates the need for an organization to install, run, and store applications on their own computers and thus reducing the cost of hardware and infrastructure. The various benefits of SaaS service model to organizations include flexible monthly payments, scalable usage of the application, and automatic updates of application and software.
performance model PI3 (π3): Prodigal, Ideal, Impoverished, and Inefficient. The Proposed performance model classifies the performance of the SaaS cloud environment into four types i.e. Prodigal, Ideal, Impoverished, and Inefficient. The proposed model can be used to place the Cloud App execution engine optimally at various locations to improve the overall performance of the SaaS cloud environment. The rest of the paper is organized as follows: In section II, related work is discussed. In section III, the various performance metrics in the context of SaaS and IaaS cloud environment are discussed. The relationship between various performance metrics and their effect on each other is also explored. In section IV, we propose a performance model PI3
II. RELATED WORK
for analyzing the performance of SaaS cloud. In section V, we analyze the performance of SaaS cloud environment using the proposed performance model. In section VI, results are discussed. Finally, in section VII conclusion and future scope are listed.
Cloud computing is an emerging paradigm and cloud performance analysis is the latest area of research. A lot of work has been done on performance evaluation of cloud.
In [3] authors have proposed a ranking framework that can help customers to evaluate cloud offering and rank them based on the user Quality of Service (QoS) requirements. The proposed framework measures the quality of IaaS cloud service and prioritizes them. The authors discussed the various components of the framework and discuss various metrics to analyze the performance of IaaS service provider. Service measurement index (SMI) and SMI cloud architecture were discussed for ranking purpose. Finally, the analytic hierarchy process (AHP) technique was used for ranking and decision making.
In [4] authors have proposed a method to work out a unified figure to assign merit to various CSP’s. In their work they select four different VM sizes Small (S), Medium (M), Large (L) and XLarge (XL) of eight different cloud service providers including Amazon, Softlayer, Rackspace, Google, Microsoft Azure, Aruba, DigitalOcean, Joyent and analyze the performance using seven different metrics including CPU performance, Memory performance, Disk I/O performance, MeanResponsetime (MRT), Provisioningtime, Availability, and Variability. In the next step, pricing is linked with performance and finally, a unified customer aware figure is worked out to rank various CSP’s
In [5] authors have proposed a technique to estimate the virtual resources necessary to run their applications effectively in IaaS clouds. Cloud Crawler environment was discussed to automatically test the performance of applications in clouds environment. An experimental evaluation of social networking application is done by using cloud crawler and the performance of various types of virtual machines is tested under different levels of demand.
In [6] authors have proposed a tool called Cloud-based Testing as a Service (CTaaaS) to meet the needs of SaaS application testing, its performance, and scalability evaluation. They explained the CTaaS design and implementation and evaluate the SaaS performance and scalability using the tool.
In [7] authors have suggested a technique for Quality of Service (QoS) driven service selection for multitenant SaaS environment. Different clients have different QoS requirements for accessing the application. These QoS requirements need to be satisfied keeping in view the cost and response time of the application. A novel QoS-driven approach is proposed for helping developers of SaaS application and the proposed approach is tested using an example SaaS synthetically generated dataset based on real world web service.
In [8] authors have devised metrics based on physics and microeconomics concepts to measure elasticity in cloud computing environment. They use physics concept of strain and stress and microeconomics concepts of price elasticity of demand to propose a set of metrics for elasticity measurement in the cloud environment. Experimentation is performed to measure elasticity using workloads generated through micro benchmarks.
In [9] authors have discussed proactive resource management for service workflows in virtualized cloud environment. Experimentation was done using adaptive resource management algorithm. The algorithm avoids unnecessary resources allocations and terminations and makes resource management decisions on predictive results and user specified thresholds.
In [10] authors have proposed a new method for evaluating the trust and reputation of cloud environments. They have filtered the real comments of the people from unreal and incorrect comments. They call the real comments as recommendations of opinion leaders and the unreal comments as troll entities. Based on the recommendations of the opinion leaders, they evaluate the trust and reputation of cloud environment based on five parameters reliability, availability, data integrity, identity, and capability. They also propose a method for the identification of opinion leaders from troll entities by using three topological metrics, input-degree, output-degree and reputation measures.
In [11] authors have devised metrics and techniques for quantifying performance isolation in cloud environments. They have proposed three metrics to evaluate the performance isolation capabilities of cloud service provider. They also propose four new approaches to achieve performance isolation in Software as a Service cloud offerings. The proposed metrics and approaches are evaluated using a simulated based case study to show the effectiveness and applicability of the proposed system.
systems. The results of the analytical model are combined in an iterative manner to obtain the solution with the required accuracy. Various features like the batch arrival of user requests, resource virtualization, and realistic servicing steps are incorporated in the model to obtain results.
Most of the research in this area has been focused on performance modeling of IaaS cloud service, SaaS application testing, and ranking of CSPs in the context of IaaS cloud service, but to the best of our knowledge performance modeling in the context of SaaS cloud service is less explored and hence needs attention. In this paper, we would explore various performance metrics in the context of SaaS and IaaS cloud service. We would use the performance metrics to propose a performance model of SaaS cloud environment and analyze the performance of Social networking giant Facebook using the proposed model.
III. PERFORMANCE PARAMETERS
Performance analysis of large-scale cloud computing environment is a challenging task. Cloud environment involves millions of user accessing the cloud resources through cloud App. The dynamic processing requirements of the cloud users make performance evaluation of cloud environment a complex and challenging task. Performance parameters play a very important role to evaluate and optimize the cloud environment. This section will focus on various performance parameters within the context IaaS and SaaS cloud environment.
Response Time
In SaaS service model response time or round trip time is the time elapsed between sending the request by cloud user and getting back the reply from the cloud service provider. Response time is measured in seconds. It includes the latency added by the network as the request travels from the cloud user to the service provider (Forward Latency), the processing time of the request in the cloud environment and the latency added by the network as reply moves back to the user (Backward Latency). Response time is calculated as follows:
Response Time (RT) = NetworkLatency(Forward)+
ProcessingTime(Cloud)+
NetworkLatency(Backward)
NetworkLatency(Forward) Network Latency as request moves from cloud user to CSP. ProcessingTime(Cloud) Processing Time of Request in
the Cloud Environment
NetworkLatency(Backward) Network Latency as request moves from CSP to cloud user.
The network latency in the forward and backward direction is taken differently as network latency is dynamic and latency varies with the passage of time. The user enters into service level agreement (SLA) with the cloud service provider before subscribing for cloud services. The SLA mentions the
maximum response time to provide services to the user. Maximum response time is the maximum time promised by CSP in SLA to provide service to the user requests. The quality of service provided by the CSP can also be measured by using Average Response Time and Response Time Failure. Average response time is the mean response time of all user requests in the cloud environment over a stipulated period of time. Response time failure metric indicates the number of times the CSP fails to meet the promised response time. Both of the above metrics provides an excellent way to judge the performance of Cloud service provider and helps the user in making the decision. These are calculated as follows:
Average Response Time = ∑ RTi / N
RTi Response time of ith
N
user request ( i varies from 1 to N)
Total Number of users over a stipulated period of time
Response Time Failure (%) = (N1 / N2 )*100
N1 Number of Requests for
which Response time is more than promised response time
N2 Total number of Requests
In IaaS service model response time [3] indicates the time taken by CSP to service the IaaS requests of the user. E.g. IaaS request can be a request for a new virtual machine (VM). In this case, response time is the time to process the request of the user and it includes time to provision a VM, booting the VM, assigning an IP address to VM and application deployment on VM. Average response time is the mean response time of all the IaaS service requests by the users over the stipulated period of time and is calculated as given above. Response time failure metric indicates the number of times the CSP fails to serve the IaaS requests within the maximum promised response time as mentioned in SLA and is calculated as given above.
Percentage of Requests Timed Out
resources are required to process the requests of the user. This parameter is measured as follows:
Requests Timed Out (%) =
Number of Requests Timed Out *100 Total Number of Requests in Cloud Environment
In this measurement, an assumption is made that the network is excellent and requests are not timed out due to the latency of the network. This assumption would provide a measure where the requests are actually timed out waiting in the buffers of the CSP. It is also to be noted that this is dynamic measure and it would give the requests timed out at a particular instant of time. To be more accurate and precise this parameter needs to be calculated at various time intervals to get the average percentage of requests timed out.
Average Resource Capacity per Tenant
In IaaS cloud environment average resource capacity per tenant provides the average resources available to a particular tenant in the cloud environment. The higher value indicates that more resources are available to the tenant and its associated users to exploit. A cloud environment encompasses of multiple tenants, every tenant has a large number of users accessing the cloud resources by using cloud app. Hence, this parameter plays a very important role in judging the QoS provided by CSP. It is calculated as follows:
Average Resource Capacity per tenant =
Total capacity of cloud environment
Number of tenants in cloud environment
cpu*data*net*memory T
cpu total number of cpu units in cloud
environment
data total number of data storage units in cloud environment
net total number of network bandwidth units in cloud environment
memory total number of memory units in cloud
environment
T numberof tenants in cloud environment
Resource capacity per user can also be calculated. It gives the resources available per user in the cloud environment. It is calculated as follows:
Resource Capacity per user =
Total capacity of cloud environment Number of cloud users
cpu*data*net*memory Number of cloud users
Data Center Request Processing Time
In SaaS service model, Data center request processing time is the time taken by the data center to process the request of the user. The user sends the request to the cloud resources, the request waits in the queue or buffers for its turn to get processed. When the Virtual Machine (VM) is available, the request is fetched from the queue and sent to the VM for processing. The request processed by VM waits in the buffer before it is delivered to the user through the network. The data center request processing time is a good indicator to tell about the health of data center. This performance parameter varies with the load on the data center. High data center request processing time shows that the data center is overloaded. This parameter is calculated as follows:
Data Center Request Processing Time =
N
∑ (Qin (time)+VM(time)+Qout(time))
i=1 . N
Qin(time) Waiting time of user request in
queue for processing
VM(time) Time taken by virtual machine to
process the request
Qout(time) Waiting time of user request in
queue after getting processed
N Number of user requests over a
period of time
Cost
The Cost of cloud services provided to the user is an important parameter of performance. The cost of providing cloud service to clients is calculated as follows:
Total Cost = Total Virtual Machine Cost +
Total Data Transfer Cost
The application and services are placed on the infrastructure of CSP and the tenant uses the resources to provide services to its clients. Different cloud service providers like Amazon EC2, Microsoft Azure, Rackspace, and GoGrid etc. have different plans for virtual resources which are offered to tenants. It adds complexity to the process of comparing the costs of different providers and selecting a particular cloud service provider. To simplify this process, the cost of running one instance of an application on the virtual cloud resources can be worked out and total virtual machine cost can be evaluated from an average number of simultaneous running instances of an application. e.g. let say there is an application which requires cpu cpu units, net network bandwidth units, ram memory units and data storage units with weights p, q, r and s respectively such that p+q+r+s=1, then the virtual machine cost of running an instance of application is calculated as follows:
Virtual Machine Cost = cpup * netq * ramr * data
Different applications have varied requirements of execution. Some application are compute intensive and hence requires
more cpu units while some applications are data intensive and hence requires more storage and network bandwidth units. That is the reason for assigning weights to different entities. The total cost can be calculated by multiplying the average number of simultaneous app instances running with the cost of running a single instance on the cloud resources and is calculated as follows:
Total Virtual
Machine Cost =
n * Virtual Machine Cost
n Average number of simultaneous
running application instances.
Data transfer cost refers to the fees of moving data in and out of cloud service providers data centers. Generally, the inbound data transfers i.e. data going into the CSP data centers from the internet are free. The outbound data transfers i.e. data going out of the CSP data centers to the internet is charged according to the region or the zone of outbound data transfers. Data transfer cost is charged per GB of data transfer. Different cloud service providers like Amazon EC2, Microsoft Azure, and Google Cloud Computing Platform etc. have varied outbound data transfers fees and varies from region to the other.
Relationship among performance metrics
The cloud environment is a dynamic and complex environment. The environment is dynamic because millions of users are sending requests simultaneously with different requirements. During the peak hours, the demand for resources increases exponentially while in off peak hours the resources may be idle. The environment is complex because various entities interact with each other to fulfill the requests of the user. In order to improve the performance, optimization at various levels is required. The performance metrics plays a very important role in improving the health of cloud. The performance metrics discussed are not isolated but they are related with one another and they affect each other. In this section, the relationship among metrics is discussed.
Response time and Average resource capacity per tenant / user
Under SaaS cloud environment, Response time is the round trip time of the request of the user. On the other hand resource capacity per tenant/user gives the volume of resources available to a tenant or user to use. The high value of resource capacity per user would improve the response time of the cloud environment because more resources are available for the user to use. As the number of users in SaaS cloud environment increases while the resources are kept fixed, the response time of the cloud environment increases and hence affecting the performance of the cloud. In IaaS cloud environment response time provides the time to fulfill user infrastructure requests e.g. the request of the user for a new virtual machine. The high value of resource capacity per
tenant in IaaS cloud environment would improve the response time and the tenant requests are fulfilled in less time.
Response time and Percentage of requests timed out
Percentage of requests timed out gives the timed out user requests. In such scenario, the response time of processed user requests also deteriorates. The request sent by the user waits in the buffers to get processed. During overloading of cloud resources or congestion of user requests the requests timed out in buffers and the response time of cloud environment deteriorates.
Cost and Response time
Cost is an important parameter of the cloud environment. It gives the cost of using services on the cloud. It is dependent on the usage of cloud resources. In IaaS cloud environment, the tenant is offered resources by cloud service provider on rent. Depending upon the usage of the resources by the users of the tenant, the provider generates the bill of the tenant. The usage of the resources is dynamic and it varies with the passage of time. As the number of users of the tenant increases, tenant procures more resources from the provider to maintain promised response time to its users and hence the tenant pays more cost to the provider. In SaaS service model the service provider creates its own public cloud to offer SaaS services to clients. The App used by the client to interact with the provider uses resources of the cloud. In SaaS environment, multiple instances of App are executing simultaneously. The cost depends on the usage of the resources by multiple instances of running applications. As the number of users increases, the provider would have to scale up and optimize the usage of the resources to maintain the response time.
IV. PROPOSED PERFORMANCE MODEL OF
SAAS CLOUD ENVIRONMENT
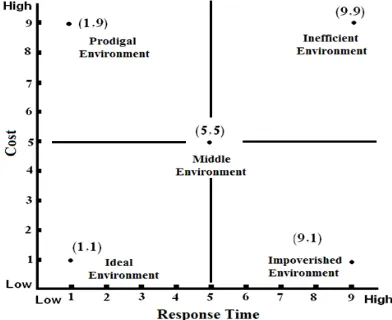
the request of the user and cost is the cost involved in providing services to the users. The scaling of both the dimensions is taken from 0 (low) to 10 (high). Zero indicates the lowest value of the metric and ten corresponds to the highest value of the metric. The placement of datacenter at various locations by the cloud service provider and the usage of appropriate resource scheduling algorithms play a very
crucial role in deciding the overall performance of the cloud.
[image:6.612.108.500.163.483.2]The π3
Figure 1: PI
performance model would be very helpful in deciding the performance of cloud. Different combinations of placement of data centers at various locations and resource scheduling algorithms would be analyzed by using the proposed performance model to find the ideal solution. The various types of cloud environment are discussed below.
3
(π
3X-axis represents response time in milliseconds (ms). On X- axis one unit represents 100 ms. Low represents 0 ms and High represents 1000 ms.
Y-axis represents cost per hour in dollars. On Y-axis one unit represents $100. Low represents $0 and High represents $1000.
Ideal Cloud Environment
) (Cloud Grid) Performance Model of SaaS Cloud Environment
The ideal cloud environment as the name indicates is the optimal cloud environment. The ideal cloud environment is indicated in the performance model by a value of (1, 1) on both the dimensions. This environment is characterized by low cost and low response time. In this scenario, cloud performance is optimized and the cloud provides excellent performance to clients at a low cost. The other performance parameters like average resource capacity per user is low or normal, percentage of requests timed out is low, and datacenter request processing time is low. In this environment, cloud performance is excellent because the usage of cloud resources is optimized by using appropriate resource scheduling algorithms and data centers are placed optimally at
various locations by the CSP. In this scenario, response time and cost varies from 0 to 5 units, so the cloud grid corresponding to (0, 0) to (5, 5) encompass ideal cloud environment.
Impoverished Cloud Environment
the impoverished cloud environment. Low performance of impoverished cloud environment can be due to various factors, such as:
a. The cloud resources are not scaled up corresponding to the number of users in the cloud environment i.e. average resource capacity per user is very less.
b. The datacenters in the cloud are to be placed according to the distribution of users in various regions. It might be possible that datacenters are not placed properly leading to overloading at some datacenters and underutilization at some other datacenters.
c. The cloud resources scheduling algorithm and user requests scheduling algorithms are not appropriate according to the prevailing conditions.
Prodigal Cloud Environment
The Prodigal cloud environment is extravagant cloud environment. It is characterized by high cost and low response time. In this environment, the response time of cloud environment is excellent but the cost of providing cloud services is high. In this scenario, response time varies from 0 to 5 units and cost varies from 5 to 10 units. The grid corresponding to (0, 5) and (5, 10) represents prodigal cloud environment. Cloud resources are not optimally used which results in resource wastage. Generally, in the prodigal cloud environment, the number of users in the cloud environment is less and abundant resources are available to use i.e. average resource capacity per user is high. Such type of cloud environment can be converted into ideal cloud environment by either populating the environment with more number of users or by scaling down the cloud resources in proportion to the number of users in the environment.
Inefficient Cloud Environment
The Inefficient cloud environment is characterized by high cost and high response time. In this scenario, the user receives low performance by paying a high cost. In this environment, response time and cost varies from 5 to 10 units. The grid
corresponding to (5, 5) and (10, 10) represents the inefficient cloud environment. The other performance metrics like data center request processing time and percentage of requests timed out is high. The various factors leading to an inefficient cloud environment are as follows:
a. The resource scheduling algorithms and user request scheduling algorithm are not optimal. b. The placement of data centers at various
locations by the CSP is not in line with the distribution of users in the cloud environment.
The efficiency of the inefficient cloud environment can be improved by using an appropriate methodology for cloud resource scheduling and user request scheduling. The appropriate placement of datacenters according to the density of users in the cloud environment can also improve the performance of inefficient cloud environment.
V. PERFORMANCE ANALYSIS OF SAAS CLOUD
USING PROPOSED PI3(Π3
In this section, we would analyze the performance of SaaS cloud using the proposed PI
) PERFORMANCE MODEL
3
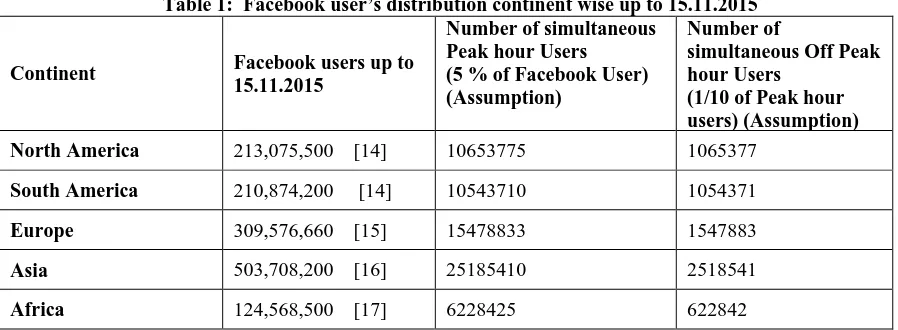
performance model. For this purpose, we choose the social networking giant Facebook cloud. We gather the information pertaining to Facebook cloud and evaluate the performance of cloud using CloudAnalyst simulation tool. We then use the proposed performance model to analyze the performance of cloud. According to socialbakers.com [13], Facebook has 1.09 billion daily active users (DAU) and 1.65 billion monthly active users (MAU). 90% of these users are mobile users and they access the Facebook services through mobile devices like smart phones and gadgets. A Facebook user, on an average, spends 20 minutes per Facebook visit. The table 1 below provides the number of Facebook users in six continents of the world up to 15th
Continent
[image:7.612.83.532.560.725.2]of November 2015. For the purpose of simulation, we assume that during peak hour’s number of simultaneous user’s are 5% of the number of users in the table given below and during off peak hours the users are taken as 1/10 of the number of users during peak hours.
Table 1: Facebook user’s distribution continent wise up to 15.11.2015
Facebook users up to 15.11.2015
Number of simultaneous Peak hour Users
(5 % of Facebook User) (Assumption)
Number of
simultaneous Off Peak hour Users
(1/10 of Peak hour users) (Assumption)
North America 213,075,500 [14] 10653775 1065377
South America 210,874,200 [14] 10543710 1054371
Europe 309,576,660 [15] 15478833 1547883
Asia 503,708,200 [16] 25185410 2518541
Australia and Oceania 18,239,110 [18] 911955 91195
Total 1380,042,170 69002108 6900209
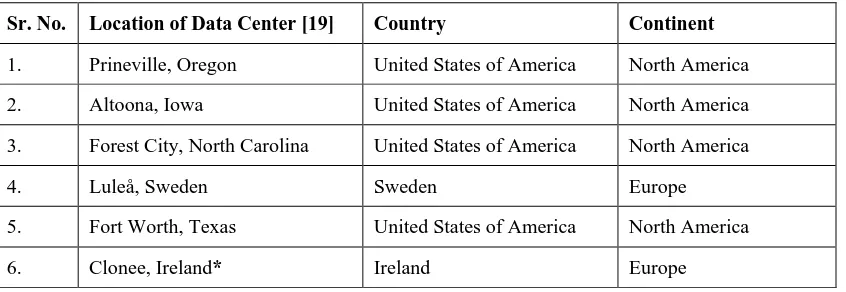
[image:8.612.98.521.186.332.2]Initially, Facebook outsources its datacenter needs and processes to its neighbors in the Silicon Valley. From 2011 onwards Facebook starts developing in-house data centers to cater the needs of its ever-increasing users. The location of various data centers of Facebook is as under:
Table 2: Location of Data Centers of Facebook
Sr. No. Location of Data Center [19] Country Continent
1. Prineville, Oregon United States of America North America
2. Altoona, Iowa United States of America North America
3. Forest City, North Carolina United States of America North America
4. Luleå, Sweden Sweden Europe
5. Fort Worth, Texas United States of America North America
6. Clonee, Ireland* Ireland Europe
*Datacenter under construction
The Internet latency is the delay added by the Internet as the request moves from user to cloud service provider and the reply comes back to the user. Internet latency is a dynamic entity and it keeps on varying with the passage of time. For the purpose of simulation,
we collect real-time network latency data from
different continents of the world.
Table 3: Internet Latency Matrix (in milliseconds)
Region Id / Region
0 1 2 3 4 5
North America South America Europe Asia Africa Ocenia
0 North America 25 222 142 266 292 184
1 South America 222 25 251 367 414 371
2 Europe 142 254 25 126 162 315
3 Asia 266 370 126 25 283 334
4 Africa 292 413 162 274 25 451
5 Ocenia 176 365 315 342 451 25
[image:8.612.40.575.660.737.2]Internet bandwidth refers to the speed at which the data is transferred from sender to receiver and vice versa. The bandwidth is measured in Mbps (Megabits per second). The Following bandwidth matrix [21] enlists the bandwidth between the various regions of the world.
Table 4: Internet Bandwidth Matrix (in Mbps) [21]
Region Id / Region
0 1 2 3 4 5
North America South America Europe Asia Africa Ocenia
1 South America 1000 800 1000 1000 1000 1000
2 Europe 1000 1000 2500 1000 1000 1000
3 Asia 1000 1000 1000 1500 1000 1000
4 Africa 1000 1000 1000 1000 500 1000
5 Ocenia 1000 1000 1000 1000 1000 2000
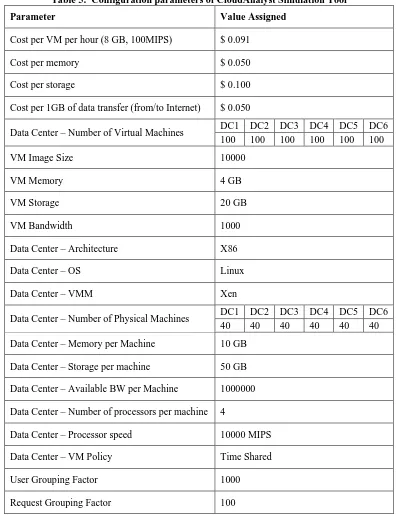
[image:9.612.107.503.220.735.2]The cost of providing cloud services is very important performance factor. The cost is configured in simulation by taking actual cost of virtual machine of MS- Azure pricing model. The VM per hour cost of a standard A2v2 machine is taken for simulation purpose. The other parameters [21] [22] used to configure the simulation are shown in table below:
Table 5: Configuration parameters of CloudAnalyst Simulation Tool
Parameter Value Assigned
Cost per VM per hour (8 GB, 100MIPS) $ 0.091
Cost per memory $ 0.050
Cost per storage $ 0.100
Cost per 1GB of data transfer (from/to Internet) $ 0.050
Data Center – Number of Virtual Machines DC1 DC2 DC3 DC4 DC5 DC6 100 100 100 100 100 100
VM Image Size 10000
VM Memory 4 GB
VM Storage 20 GB
VM Bandwidth 1000
Data Center – Architecture X86
Data Center – OS Linux
Data Center – VMM Xen
Data Center – Number of Physical Machines DC1 DC2 DC3 DC4 DC5 DC6
40 40 40 40 40 40
Data Center – Memory per Machine 10 GB
Data Center – Storage per machine 50 GB
Data Center – Available BW per Machine 1000000
Data Center – Number of processors per machine 4
Data Center – Processor speed 10000 MIPS
Data Center – VM Policy Time Shared
User Grouping Factor 1000
© 2015-19, IJARCS All Rights Reserved 935
Executable Instruction Length 250
VI. RESULTS AND DISCUSSION
CloudAnalyst, A CloudSim based simulation tool for simulating large scale SaaS application is used for simulation purpose. CloudAnalyst is a graphical user interface (GUI) based tool and it allows the user to configure simulation by configuring the various options available in the tool. In this simulation tool, service broker policy would decide the movement of the user request to a particular datacenter and load balancing policy would balance the load of all the virtual machines (VM) in the datacenter. Using the data provided in the above tables, The CloudAnalyst simulation tool is configured and the results are obtained. The results are discussed as follows:
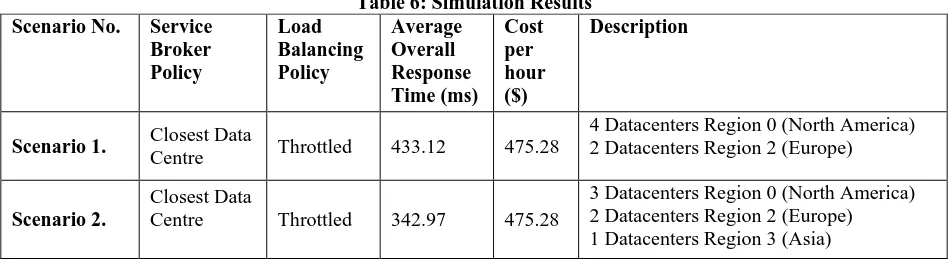
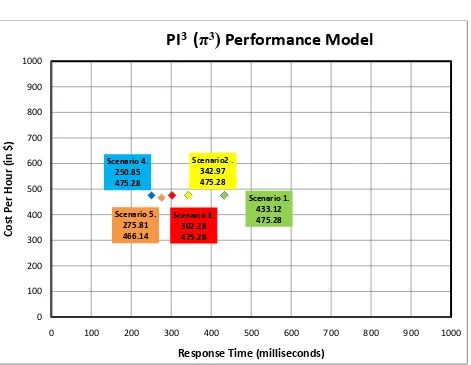
Scenario 1: In scenario1, closest datacenter service broker policy and Throttled load balancing policy is used to configure the simulation. Six datacenters are configured each with 100 physical machines. Four data centers are placed in North America and two data centers are placed in Europe. The result values of average overall response time and cost per hour obtained are 433.12ms and $475.28 respectively. The values fall in the ideal grid of PI3 performance model. The performance of the cloud is near to the middle environment, but it lies in the ideal cloud grid as shown in figure 2.
Scenario 2: In scenario2, closest datacenter service broker policy and Throttled load balancing policy is used to configure the simulation. Six datacenters are configured each with 100 physical machines. Three data centers are placed in North America, two data centers are placed in Europe and one datacenter is placed in Asia. The result values of average overall response time and cost per hour obtained are 342.97ms and $475.28 respectively. With the placement of one of the datacenter in Asia, response time shows an improvement of 90.15ms from scenario 1. Cost per hour remains the same. Bringing the application closer to the user improves the response time of the SaaS cloud environment. The values fall in the ideal grid of PI3
Scenario 3: In scenario3, the same combination of service broker policy and load balancing policy as used in scenario 1
and 2 is used to configure the simulation. Six datacenters are configured each with 100 physical machines. Two datacenters are placed in North America, two data centers are placed in Europe and two datacenters are placed in Asia. The result values of average overall response time and cost per hour obtained are 302.28ms and $475.28 respectively. With the placement of two datacenters in Asia, response time shows further improvement of 40.69ms from scenario 2. Cost per hour remains the same. Bringing the application closer to the user and distributing the data centers according to the density of users in the cloud further improves the response time of the SaaS cloud environment. The values fall in the ideal grid of PI
performance model as shown in figure 2.
3
performance model as shown in figure 2.
Scenario 4: In scenario4, Combination of closest datacenter service broker policy and throttled load balancing policy is used to configure the simulation. Six datacenters are configured each with 100 physical machines. One datacenter is placed in North America, one datacenter is placed in South America, two data centers are placed in Europe and two datacenters are placed in Asia. The result values of average overall response time and cost per hour obtained are 250.85ms and $475.28 respectively. With the placement of one of the datacenters in South America, response time shows further improvement of 51.43ms from scenario 3. Cost per hour remains the same. Rational distribution of datacenters according to the density of the cloud users improves the performance of cloud. The values fall in the ideal grid of PI3
Scenario 5: In scenario5, closest datacenter service broker policy and throttled load balancing policy is used to configure the simulation. Five datacenters are configured each with 100 physical machines. One datacenter is placed in North America, two data centers are placed in Europe and two datacenters are placed in Asia. The result values of average overall response time and cost per hour obtained are 275.81ms and $466.14 respectively. With the reduction of one of the datacenter in the cloud environment, cost per hour shows an improvement of $9.14 from scenario 1,2,3,4. The Response time shows degradation of 24.96ms from scenario 4. The values fall in the ideal grid of PI
performance model as shown in figure 2.
3
Scenario No.
[image:10.612.69.544.608.739.2]performance model as shown in figure 2.
Table 6: Simulation Results Service
Broker Policy
Load Balancing Policy
Average Overall Response Time (ms)
Cost per hour ($)
Description
Scenario 1. Closest Data
Centre Throttled 433.12 475.28
4 Datacenters Region 0 (North America) 2 Datacenters Region 2 (Europe)
Scenario 2.
Closest Data
Centre Throttled 342.97 475.28
Scenario 3.
Closest Data
Centre Throttled 302.28 475.28
2 Datacenters Region 0 (North America) 2 Datacenters Region 2 (Europe)
2 Datacenters Region 3 (Asia)
Scenario 4. Closest Data
Centre Throttled 250.85 475.28
1 Datacenters Region 0 (North America) 1 Datacenters Region 1 (South America) 2 Datacenters Region 2 (Europe)
2Datacenters Region 3 (Asia)
Scenario 5. Closest Data
Centre Throttled 275.81 466.14
1 Datacenters Region 0 (North America) 2 Datacenters Region 2 (Europe)
[image:11.612.73.544.206.571.2]2 Datacenters Region 3 (Asia)
Figure 2: PI
3(π
3) (Cloud Grid) Performance Model Result Chart
VII. CONCLUSION AND FUTURE SCOPE
Cloud computing is an emerging technology. It enables the small and medium sized organizations to leverage the benefits of information technology with minimal capital expenditure. The organizations migrate their traditional IT infrastructure to the cloud and pay as per their usage. While selecting a cloud service provider, the knowledge of performance metrics of cloud and relationship among various parameters plays a
crucial role in the decision-making process. A performance model is required to analyze the performance of the cloud.
In this article, we propose performance metrics to measure the health of cloud. We propose the methods to calculate the performance parameters. We also explore the relationship between various parameters and their affect on each other. Then we propose a performance model of SaaS cloud environment PI3and classifies cloud environment into four types: Prodigal, Ideal, Impoverished and Inefficient. Using the Scenario 1.
433.12 475.28 Scenario2 .
342.97 475.28
Scenario 3. 302.28 475.28 Scenario 4.
250.85 475.28
Scenario 5. 275.81 466.14
0 100 200 300 400 500 600 700 800 900 1000
0 100 200 300 400 500 600 700 800 900 1000
Co
st
Pe
r H
our
(i
n $)
Response Time (milliseconds)
proposed PI3
[1]
performance model, we analyze the performance of the SaaS cloud environment and the results thus obtained are discussed and improved.
In the future, we would use the proposed performance model to analyze the performance of some other popular SaaS clouds and social networking clouds.
REFERENCES
on 19th
February 2016.
[2] http://www.internetworldstats.com/emarketing.htm on 19th
[3] S. Garg, R. Buyya, and S. Verteeg, “A Framework for Ranking of Cloud Computing Services”, in Future Generation Computer Systems , pp. 1012–1023, 2013
February 2016.
[4] B. El zant and M. Gagnaire, “Towards a Unified Customer Aware Figure of Merit for CSP Selection”, in Journal of Cloud Computing: Advances, Systems and Applications, 2015
[5] M. Cunha, N. Mendonca and A. Sampaio, “A Declarative Environment for Automatic Performance Evaluation in IaaS Clouds 2013
[6] J. Gao, K. Manjula, P. Roopa. E. Sumalatha, X. Bai, W.T. Tsai, and T. Uehera, “A Cloud-Cased TaaS Infrastructure with tools for SaaS Validation, Performance and Scalability Evaluation” in Proceedings of the 4th IEEE International Conference 2012.
[7] Q. He, J. Han, Y. Yang, J. Grundy and H. Jin, “QoS-Driven Service Selection for Multi-Tenant SaaS” in Proceedings of 5th IEEE Conference on Cloud Computing, 2012
[8] E.F. Coutinho, P.A.L. Rego, D.G. Gomes, and J.N. de Souza, “Physics and Microeconomics-Based Metrics for Evaluating
Cloud Computing Elasticity” in Journal of Network and Computer applications, pp 159-172, 2016.
[9] Y. Wei, and M.B. Blake, “Proactive Virtualized Resource Management for Service Workflows in the Cloud” in Journal of Computing, pp 523-538, 2016.
[10] M. Chiregi and N. J. Navimipour “A new method for Trust and Reputation Evaluation in the Cloud Environments using the Recommendations of Opinion Leaders' Entities and Removing the Effect of Troll Entities” in Computers in Human Behavior, pp 280-292, 2016.
[11] R. Krebs, C. Momm and S. Kounev “Metrics and Techniques for Quantifying Performance Isolation in Cloud Environments” in Science of Computer Programming, pp 116-134, 2014. [12]H. Khazaei, J. Misic, and V.B. Misic, “A Fine-Grained
Performance Model of Cloud Computing Centers” in IEEE Transactions on Parallel and Distributed Systems , pp 2138-2147, 2013.
[13]
[14]
[15]
[16]
[17]
[18]
[20]
https://www.dotcom-tools.com/internet-backbone-latency.aspxon 17.07.2016 at 04:42pm.
[21]B. Wickremasinghe. R.N. Calheiros, and R. Buyya,
"CloudAnalyst: A CloudSim Based Visual Modeller for Analysing Cloud Computing Environments and Applications", in the proceedings of 24th IEEE International Conference on Advanced Information Networking and Applications, pp 446-452, 2010.