Volume 4, No. 9, July-August 2013
International Journal of Advanced Research in Computer Science
RESEARCH PAPER
Available Online at www.ijarcs.info
ISSN No. 0976-5697
Analysis of Texture Classification By Wavelet Transform And Curvelet Transform
M.Santhanalakshmi
Research Scholar, Department of computer science Manonmaniam Sundranar University
Tamilnadu, India [email protected]
Dr.K. Nirmala
Associate professor, Department of computer science
Quaid-e-millath Government College for women, Tamilnadu, India
Abstract: In this paper, the task of texture image classification is analyzed by using Discrete Wavelet Transform (DWT) and Discrete Curvelet Transform (DCT). The wavelet and curvelet coefficients are used to describe the textures in the given image. These coefficients are obtained by the decomposition process. First, the texture image is decomposed by using DWT and DCT at multiscale. As the sub-bands in the decomposed image carries diverse information about the texture, predefined number of coefficients is selected in each sub-band image. Before selecting the coefficients, sub-band coefficients are sorted in order to account high energy coefficients. The results show that the classification accuracy of DWT based features outperforms the DCT energies. The classification accuracy of DWT is 5% higher than DCT features at 2-level decomposition with 50% of coefficients used.
Keywords: Texture, texture classification, discrete wavelet transform, discrete curvelet transform, nearest neighbor classifier
I. INTRODUCTION
In the field of pattern recognition and image processing, the one of the most important task is texture classification. Extensive researches have been made for texture image classification over the last two decades. A completed modeling of the Local Binary Operator (LBP) operator is proposed and an associated Completed LBP scheme is developed for texture classification in [1]. Three operators are defined to extract the image local gray level, the sign and magnitude features of local difference, respectively. Gaussian Markov Random Field (GMRF) model is used on linear wavelets for the classification of textures in [2]. They used seven features that are extracted using least square error estimation method on third order Markov neighborhood.
Texture classification by modeling joint distributions of local patterns with Gaussian mixtures is proposed in [3]. Local texture neighborhoods are first filtered by a filter bank. Without further quantization, the joint probability density functions of the filter responses are then described parametrically by Gaussian mixture models (GMMs). A novel texture classification method using patch-based sparse texton learning is presented in [4]. The dictionary of textons is learned by applying sparse representation to image patches in the training dataset.
A novel, efficient, and effective refined histogram for modeling the Discrete Wavelet Transform (DWT) decomposed sub-band detail coefficients and a new image signature based on the refined histogram model for supervised texture classification is described in [5]. A new approach to extract global image features for the purpose of texture classification using dominant neighborhood structure is proposed in [6]. Features obtained from the local binary patterns are then extracted in order to supply additional local
texture features to the generated features from the dominant neighborhood structure.
A novel Bayesian texture classifier based on the adaptive model selection learning of Poisson mixtures on the contourlet features of texture images is proposed in [7]. The adaptive model-selection learning of Poisson mixtures is carried out by the recently established adaptive gradient Bayesian Ying-Yang harmony learning algorithm for Poisson mixtures. Texture classification using discrete cosine transform and approach for soft computing tool is described in [8]. As cosine transform works on gray level images, the color scheme of each image is transformed into gray levels. Then cosine transform is applied on the gray level images to obtain the coefficients. These coefficients are use to train the neural network.
A novel scheme is introduced for texture classification using Discrete Curvelet Transform (DCT) is explained in [9]. The features are constructed by the mean and variance of the sub-bands of curvelet decomposed image. By the group features, discrimination can be found to classify texture images. An efficient one-nearest-neighbor classifier of texture via the contrast of local energy histograms of all the wavelet sub-bands between an input texture patch and each sample texture patch in a given training set is described [10].
The rest of the paper is as follows. Section 2 describes the background of DWT and DCT. The proposed texture classification algorithm is presented in Section 3. The analysis of DWT and DCT over texture classification is given in Section 4 and finally, the conclusion is given in the last section.
II. DISCRETEWAVELETTRANSFORM
wavelet functions construct an orthogonal basis and the discrete wavelet transform is thus a decomposition of the original signal in terms of these basis functions [11]:
∑
∑
∞ = ∞ = = 0 , 0 ). ( ) ( n n m m n m x U C x f (1)Where the U , (x) 2 /2U(2 x n) m m
n
m = −
− −
are dilations
and translations of the basic filter function U(x) . Unlike Fourier bases which are composed of sines and cosine that have infinite length. Wavelet basis functions are of finite duration. The discrete wavelet transform coefficients Cnmare
the estimation of signal components centered at (2mn.2−m) in the time-frequency plane and can be calculated by the inner products of Um,n(x) and f(x). It is obvious that the wavelet transform is an octave frequency band decomposition of the original signal. The narrow band
signals then can be further down-sampled and provide a multi-resolution representation of the original signal.
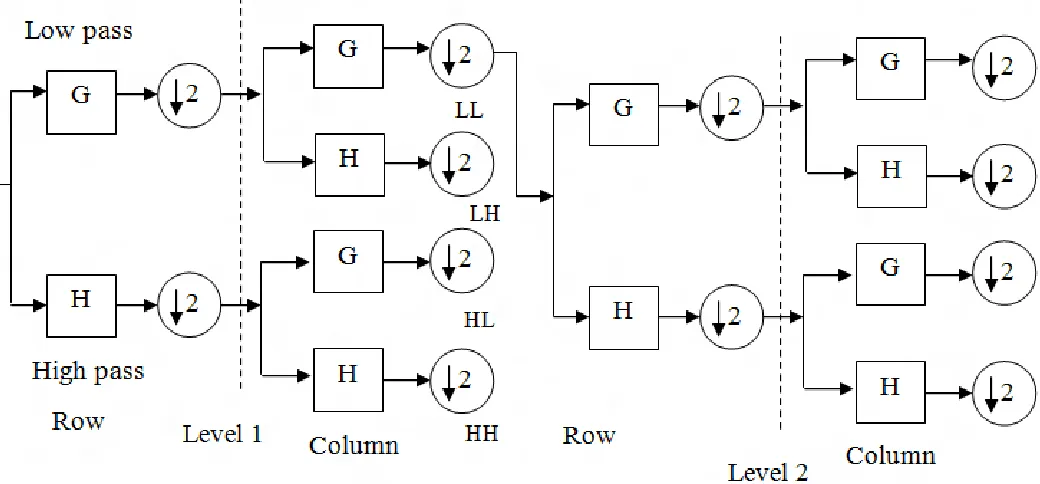
[image:2.612.53.573.284.526.2]The discrete wavelet coefficients Cnmcan be efficiently computed with a pyramid transform scheme using a pair of filters (a low-pass filter and a high-pass filter) [11]. For images which have two dimensions, the filtering and down sampling steps will be repeated in rows and columns respectively. The procedure for two levels is shown in Figure1. At each level the image can be transformed into four sub-images: LL (both horizontal and vertical directions have low frequencies). LH (the vertical direction has low frequencies and the horizontal has high frequencies). HL (the vertical direction has high frequencies and the horizontal has low frequencies) and HH (both horizontal and vertical directions have high frequencies).
Figure 1 2-level DWT of images
Times is specified, Times Roman or Times New Roman may be used. If neither is available on your word processor, please use the font closest in appearance to Times. Avoid using bit-mapped fonts if possible. True-Type 1 or Open Type fonts are preferred. Please embed symbol fonts, as well, for math, etc.
III. DISCRETECURVELETTRANSFORM
Donoho [12] introduced a new multiscale transform named curvelet transform which was designed to represent edges and other singularities along curves much more efficiently than traditional transforms, i.e., using fewer coefficients for a given accuracy of reconstruction [12-13]. The continuous curvelet transform can be defined by a pair of windows W(r)(a radial window) and V(t)(an angular
window), with variables W as a frequency-domain variable, and r and θ as polar coordinates in the frequency-domain [14].
∑
∞ ∞ − = ∈ = j j r r W 2 3 , 4 3 1 ) 2 ( 2 (2)∑
∞ ∞ − = − ∈ = − j r l t V 2 1 , 2 1 1 ) ( 2 (3)A polar ‘wedge’ represented by Uj is supported by
W andV , the radial and angular windows. Ujis defined in the Fourier domain by
= − − π θ θ 2 2 ) 2 ( 2 ) , ( 2 ) 4 3 ( j j j
j r W r V
The curvelet transform can be defined as a function of )
2 , 1 (x x
x= at scale2−j, orientationθl, and position xkj l ,
by
)) (
( )
( ( ,)
, ,
l j k l j k l
j x =ϕ Rθ x−x
ϕ (5)
Where θ R is the rotation in radians. Implementation of Curvelet transform involves the following steps: (i) Sub-band decomposition (ii) Smooth partitioning, (iii) Renormalization, (iv) Ridgelet analysis.
IV. PROPOSEDMETHOD
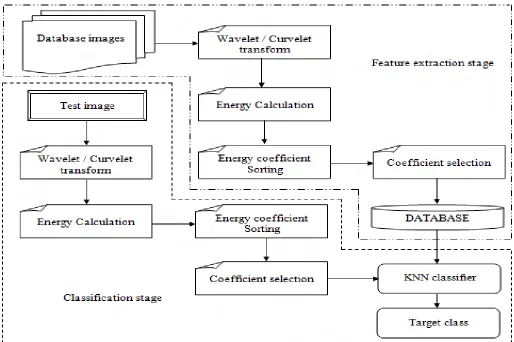
The overall block diagram of the proposed texture classification based on DWT and DCT is shown in Figure 2. The two important steps of a typical classification system are feature extraction and classification. In the first step, the features that best discriminate the textures are extracted. Then, these extracted features are used to assign the class of the unknown texture image to a known texture class. In the proposed approach, both multi resolution and
multidirectional transformation such as DWT and DCT are analyzed. In order to analyze DWT and DCT, the wavelet and curvelet coefficients are used to describe the texture image.
[image:3.612.50.564.281.623.2]The number of coefficients for an n-level DWT and DCT is varied. Hence, the coefficients used for classification are extracted from each sub-band of the decomposed image. In order to analyze efficiently, energy is used. Energies can be measured by either magnitude or squaring the coefficients in the decomposed image. In the proposed approach, the coefficients are squared to extract the energy features. To account higher energies for classification, the higher valued energy coefficients are extracted by applying sorting techniques. After sorting, predefined percentage of coefficients from each sub-band image are selected as features and stored in the database. Here 10% to 50% coefficients are used to evaluate the approach.
Figure 2 Texture classification system
In the classification stage, the robust KNN classifier is used. The proposed energy features after sorting from each sub-band are extracted for the unknown texture image. The distance between the extracted features to the feature database is calculated based on Euclidean distance metric. The minimum distance measure produced by the reference texture image is assigned to the class of unknown texture
image. The perfomance metric used to analyze the approach is classification accuracy.
V. EXPERIMENTALRESULTS
size of Brodatz texture images is 640x640 pixels. To evaluate the performance of the proposed system, the original Brodatz images are subdivided into small sized images of 128x128 pixels. The process of subdividing the original texture images is based on overlapping technique in order to capture the pattern in a texture image. The small sized images are extracted with an overlap of 32 pixels between vertical and
horizontal direction from the original image. This process produces 256 sub-images of 128x128 pixels. The classification system requires training images to train the classifier and testing images to test the ability of the classifier. Hence, among the 256 images, 81 images are randomly selected and 40 and 41 images are used for training and testing respectively.
Table 1 shows classification accuracy obtained by using DWT and DCT.
Level of Decomposition
Classification Accuracy (%)
2 3 4
% of coefficients
Wavelet Curvelet Wavelet Curvelet Wavelet Curvelet
10 93.18 84.55 93.00 84.32 89.18 85.87
20 93.68 86.05 92.87 85.80 88.12 85.80
30 94.06 88.18 92.25 87.68 87.99 86.74
40 94.81 89.24 92.75 88.68 86.74 87.74
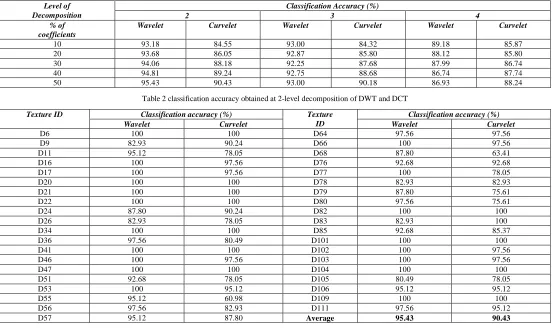
[image:4.612.31.583.155.489.2]50 95.43 90.43 93.00 90.18 86.93 88.24
Table 2 classification accuracy obtained at 2-level decomposition of DWT and DCT
Texture ID Classification accuracy (%) Texture ID
Classification accuracy (%)
Wavelet Curvelet Wavelet Curvelet
D6 100 100 D64 97.56 97.56
D9 82.93 90.24 D66 100 97.56
D11 95.12 78.05 D68 87.80 63.41
D16 100 97.56 D76 92.68 92.68
D17 100 97.56 D77 100 78.05
D20 100 100 D78 82.93 82.93
D21 100 100 D79 87.80 75.61
D22 100 100 D80 97.56 75.61
D24 87.80 90.24 D82 100 100
D26 82.93 78.05 D83 82.93 100
D34 100 100 D85 92.68 85.37
D36 97.56 80.49 D101 100 100
D41 100 100 D102 100 97.56
D46 100 97.56 D103 100 97.56
D47 100 100 D104 100 100
D51 92.68 78.05 D105 80.49 78.05
D53 100 95.12 D106 95.12 95.12
D55 95.12 60.98 D109 100 100
D56 97.56 82.93 D111 97.56 95.12
D57 95.12 87.80 Average 95.43 90.43
As DWT and DCT are multi resolution analysis, the performance is evaluated by applying various decomposition levels. Also, the number of coefficients used as features in the analysis is varied from 10 to 50 percentages of coefficients in each sub-band after sorting the coefficients in the descending order. In order to account the maximum energy coefficients the sorting technique is introduced. Table 1 shows classification accuracy obtained by using DWT and DCT.
It is observed that for both DWT and DCT, the 2 level decomposition produces better accuracy with 50% coefficients used. As the decomposition level increases, the DWT and DCT create redundant data which affects the classification accuracy. Table 2 shows the classification accuracy of each texture while using 50% coefficients at level 2.
From the Table 2, it is clearly indicates that DWT outperforms DCT in terms of average classification accuracy using minimum number of coefficients. However, in some textures the classification accuracy of DCT is higher than DWT such as D9, D24 and D83 textures.
VI. CONCLUSION
In this paper, classification of Brodatz texture images using DWT and DCT is analyzed. The decomposition level used for extracting the features is 2, 3 and 4 with selecting 10% to 50% of coefficients of each sub-band image. Experimental results show the performance of DWT over DCT in terms of classification accuracy. The maximum classification accuracy achieved by DWT and DCT based features are 95.43% and 90.43% respectively while decomposing texture images at 2-level with 50% coefficients used for classification. In future, both DWT and DCT features are fused in order to get higher accuracy than individual performance.
VII.REFERENCES
[2] B.V. Ramana Reddy, M. Radhika Mani and K.V. Subbaiah, “Texture Classification Method using Wavelet Transforms Based on Gaussian Markov Random Field”, International Journal of Signal and Image Processing, vol. 1, no.1, 2010.
[3] Henning Lategahn, Sebastian Gross, “Texture Classification by Modeling Joint Distributions of Local Patterns with Gaussian Mixtures”, IEEE Transactions on Image Processing, 2010, pp 1548-1557.
[4] Jin Xie and Lei Zhang, “Texture Classification via Patch Based Sparse Texton Learning”, IEEE 17th International Conference on Image Processing, 2010, pp 2737-2740.
[5] L. Li, C. S. Tong, “Texture Classification Using Refined Histogram”, IEEE Transactions on Image Processing, 2010, pp1371-1378.
[6] Khellah, Fakhry M. "Texture classification using dominant neighborhood structure", IEEE Transactions on image processing, Vol 20, no. 11, 2011, pp 3270-3279.
[7] Yongsheng Dong and Jinwen Ma, “Bayesian Texture Classification Based on Contourlet Transform and BYY Harmony Learning of Poisson Mixtures”, IEEE Transactions on image processing, vol. 21, no. 3, 2012, pp 909-918.
[8] Pankaj H. Chandankhede and Parag V. Puranik, “Soft Computing Tool Approach for Texture Classification Using Discrete Cosine Transform”, IEEE 3rd International
Conference on Electronics Computer Technology (ICECT), 2011, pp 296-299.
[9] Liran Shen, and Qingbo Yin, “Texture Classification using Curvelet Transform”, Proceedings of the International Symposium on Information Processing (ISIP’09), 2009, pp. 319 -324.
[10] Yongsheng Dong and Jinwen Ma, “Wavelet-Based Image Texture Classification Using Local Energy Histograms”, IEEE Signal Processing Letters, Vol. 18, No. 4, April 2011.
[11] S.G.Mallat, “A theory for multu resolution signal Decomposition: The wavelet representation”, IEEE transactions on pattern analysis and machine intelligence, Vol 11, no.7, 1989, pp.674.693
[12] David L. Donoho & Mark R. Duncan, Digital Curvelet Transform: Strategy, Implementation and Experiments, Stanford University, November, 1999
[13] J.L. Starck, E. Candes, and D.L. Donoho, The Curvelet Transform for Image Denoising, IEEE Transactions on Image Processing, 11(6), 2002, 670 -684.