R E S E A R C H
Open Access
Exploring the construct validity of the Patient
Perception Measure
–
Osteopathy (PPM-O) using
classical test theory and Rasch analysis
Jane Mulcahy
1†and Brett Vaughan
1,2,3*†Abstract
Background:Evaluation of patients’experience of their osteopathic treatment has recently been investigated leading to the development of the Patient Perception Measure–Osteopathy (PPM-O). The aim of the study was to investigate the construct validity of the PPM-O.
Methods:Patients presenting to osteopathy student-led teaching clinics at two Australian universities were asked to complete two questionnaires after their treatment: a demographic questionnaire and the PPM-O. Confirmatory factor analysis (CFA) and Rasch analysis were used to investigate the construct validity of the PPM-O.
Results:Data from the present study did not fit thea-priori6-domain structure in the CFA. Modifications to the 6-domain model were then made based on the CFA results, and this analysis identified two factors: 1) Education & Information (9 items); and 2) Cognition & Fatigue (6 items). These two factors were Rasch analysed individually. Two items were removed from the Cognition & Fatigue factor during the analysis. The two factors independently were unidimensional.
Conclusions:The study produced a 2-factor, 13-item questionnaire that assesses the patients’perception of their osteopathic treatment using the items from a previous questionnaire. The results of the current study provide evidence for the construct validity of the PPM-O and the small number of items makes it feasible to implement into both clinical and research settings. Further research is now required to establish the measures’validity in a variety of patient populations.
Background
A common concern of clinicians and clinical educators working directly with patients is the significant variance in individual treatment efficacy of patients. The pro-posed causes for this variability in patients’ experiences of their health encounters are complex and multidimen-sional. Demographic factors such as: gender, age, social gradient [1], education, ethnicity and geographic location have all been identified as factors that affect general health and disease status [2], as well as access to, and utilisation of, treatments and health services [2]. While nuances of the clinician and the clinical environment
contribute to aspects of treatment outcome such as pa-tient satisfaction [3], the papa-tients’ beliefs about their health and wellbeing, their illness or disease and expec-tations of treatment would also appear to have a signifi-cant effect [4,5].
Patient experience and expectations
Research investigating patients’ experiences during, and as a result of, their treatment has tended to focus on the: patient-therapist interaction [6,7], clinical environ-ment [8], satisfaction with treatenviron-ment [9], and, efficacy of treatment outcomes [7,10]. The patients’physical experi-ence of their treatment (i.e. sensations that the patient experiences during or after their treatment) are seldom described in manual therapy research. This aspect of the patients’ experiences of a treatment requires further ex-ploration to develop a more global picture of the patient experience during and after their consultation.
* Correspondence:[email protected]
†Equal contributors
1
Centre for Chronic Disease Prevention & Management, College of Health & Biomedicine, Victoria University, Melbourne, Australia
2
Institute of Sport, Exercise & Active Living, Victoria University, Melbourne, Australia
Full list of author information is available at the end of the article
Recently Cross et al. [4] used a qualitative approach to investigate patients’ expectations of osteopathic treat-ment in private United Kingdom practices and con-cluded these expectations are primarily related to the patient-therapist interaction. Further, patients identified professional expertise and customer service as expecta-tions of osteopathic treatment. Drawing on this work, Leach et al. [11] used a quantitative approach to identify patient expectations of their osteopathic care. The top three aspects of care highlighted by patients in this study were the ability to ask questions of the practitioner, ac-tive listening and respect. Again, the focus was very much on the patient-therapist interaction. Although, these two studies provide valuable insights into what pa-tients expect from an osteopathic treatment, papa-tients’ cognitive, emotional and sensory responses to osteo-pathic treatment have not previously been established or included in commonly utilised patient reported out-comes measures (PROMs). Previous work by Mulcahy & Vaughan [12] investigated the patient-reported sensory experiences of Osteopathy in the Cranial Field (OCF) treatment. However these sensory experiences have not been validated in patients receiving general osteopathic treatment.
The Patient Perception Measure–Osteopathy (PPM-O) was developed to enhance clinicians and clinical educators understanding of what patients perceive during osteo-pathic treatment. Items for inclusion in the PPM-O were based on those used in a previous study to explore patient perception of OCF [12,13].
Confirmatory factor analysis
The CFA was used to determine if the data fitted the 6 domains identified by Mulcahy et al. [13]. CFA produces a variety of fit statistics indicating how well the data col-lected fits the proposed a-priori factor structure [14]. A range of fit statistics should be generated because each statistic has different measurement properties [15,16]. The chi-square statistic is used to report the fit of the data to the model and p-values less then 0.05 indicate a fit [17]. Whilst there is no agreement as to which type of fit statistics should be presented, in the current study the authors present a range of statistics to provide the reader with a more comprehensive representation of the data fit. Fit statistics in the present study were in line with those suggested by DiStefano & Hess [15] and in-cluded: the goodness of fit index (GFI), comparative fit index (CFI), normed fit index (NFI), Tucker-Lewis index (TLI), root mean square residual (RMR) and the root mean square error of approximation (RMSEA). The use of these fit statistics is also supported by other authors [17,18] and ensures that a range of global fit and relative fit indices are presented [15].
Rasch analysis
Rasch analysis is part of the modern test theory (MTT) statistical technique group and is widely used in the de-velopment and analysis of questionnaires and measures. The approach was developed by Dutch mathematician George Rasch [19] and fit of the data to the Rasch model is the desired outcome of the analysis [20]. Rasch ana-lysis is independent compared to the sample-dependent analyses in classical test theory. In Rasch analysis the data is fitted to a mathematical model to de-termine if all respondents are responding to each item in a manner dictated by the Rasch model. A range of sta-tistics related to the interaction between the questionnaire items and the person responses (item-trait interaction) is generated. The item-trait statistics demonstrate the overall fit of the items and persons to the Rasch model [21]. This statistic analyses how each item on the PPM-O relates to all other items, and how each person is responding to each item on the PPM-O. These statistics indicate how the responses fit those expected by the Rasch model. A Bonferonni-adjusted non-statistically signifi-cant chi-square indicates an overall fit of all persons and items to the Rasch model [21]. Rasch model item and person fit is indicated by a fit residual standard de-viation (SD) of ± 1.5. Fit residual SDs outside of this range suggests that issues exist with the model fit of the items and/or persons. A Person Separation Index (PSI) is also generated to indicate the internal consistency of the questionnaire being analysed and is interpreted in the same way as Cronbach’s alpha [22].
Differential item functioning (DIF) is the investigation of how an item functions with respect to a person factor such as age or gender. In the present study, age, gender, satisfaction with life [12] and meaningful daily activity [12,25] were investigated to see if they had an impact on the way a person answers an item or items on the PPM-O. Each person factor is investigated separately to ascer-tain the impact of it on the fit of the data to the Rasch model. Where an item demonstrates DIF (through a statistically significant Bonferroni adjusted chi-square probability), it can be removed or recalibrated (e.g. those under 20 years of age can be split from those above 20 years of age).
Misfit of individual persons to the Rasch model is indi-cated by a fit residual of ± 2.5 [23]. A person is said to misfit when their response to each of the item on a questionnaire, in this case on items on the PPM-O, does not follow the prediction of the Rasch model for how that person should have responded to the item. Misfit-ting persons can impact on the Rasch model [21] and they will often be removed from further analysis.
The dimensionality of the measure is important be-cause this demonstrates whether it is measuring a single underlying construct [26]. Local dependency is where the response to one item dictates the response to an-other item [23,26] and this can inflate the PSI [27]. Where local dependency is identified (the PSI decreases) one of the correlating items will need to be deleted. Next, the dimensionality is assessed using a Principal Components Analysis (PCA). The PCA is used to gener-ate the‘Rasch factor’(factor 1) and display the positively and negatively loaded items. These items are then analysed using a paired t-test to examine whether the positive and negative loaded items are statistically significantly different [21]. Where no statistically significant difference exists, the questionnaire is thought to be unidimensional [21].
Study aim
The aim of the present study is to explore the construct validity of the Patient Perception Measure - Osteopathy (PPM-O) using both confirmatory factor analysis and Rasch analysis.
Methods
This study was approved by the Victoria University (VU, Melbourne, Australia) and Southern Cross University (SCU, Lismore, Australia) Human Research Ethics Committees.
Participants
Patients attending the student-led osteopathy teaching clinics at VU and SCU were invited to participate in the study. At the conclusion of their treatment, patients were invited to complete the PPM-O questionnaire by
the reception staff. An Information to Participants sheet was provided to each potential participant and consent to participate was implied by completing the naire. Completed PPM-O and demographic question-naires were placed in a secure box in the reception area and collected by one of the authors weekly. Only the authors had access to the collected data.
Measure
The Patient Perception Measure–Osteopathy (PPM-O) is based on the items from a previously developed 22-item questionnaire divided into 6 domains based on
an a-priori theoretical structure [13]. The domains
identified were Education & Information, Cognition & Fatigue, Effectiveness of Osteopathic Treatment, Perceived Emotional Responses to Osteopathic Treatment, Perceived Physical Responses to Osteopathic Treatment, and Appli-cation of Osteopathic Principles.
Participants were also asked to complete a single-page demographic questionnaire. Items on the demographic questionnaire included age, gender, employment status, current medication usage and whether the participant suffers, or suffered from, one of the seven major illnesses identified by the Australian Institute of Health and Welfare [2]. Participants were also asked about 2 global items; satisfaction with life (SWL) and meaningfulness of daily activity (MDA) [25]. These global items were rated on a Likert-type scale from 0 to 6, anchored at each end. The anchors for SWL were ‘not at all satisfied’ (0) and
‘extremely satisfied’(6), and the MDA anchors were‘not at all meaningful’ (0) and ‘extremely meaningful’ (6). Higher scores on these global items indicated greater satisfaction with life and meaningfulness of daily activity respectively. Elements of the demographic data were used to examine the differential item function in the Rasch analysis.
Data analysis
Ratio Test (p < 0.05). Graphical and numerical threshold maps, and graphical category probability curves were produced in addition to the statistical analysis. In the present study, the decision to remove items demonstrat-ing DIF was made a priorito make the PPM-O easy to administer and interpret.
Results
One hundred and eighty four questionnaires were re-ceived however 32 (18%) contained incomplete data and were subsequently removed from the CFA - 152 ques-tionnaires were analysed in the CFA. Data from all 184 questionnaires were entered into RUMM for the Rasch analysis however one questionnaire did not contain enough data to be able to analysed and was removed. One hundred and eighty three responses (n = 183) were analysed in the Rasch analysis.
The mean age of the respondents was 35.8 years (+/− 15.1 years) and 60.5% (n = 92) were female. Em-ployment status was shared between employed (n = 63, 41.4%) and students who were employed (n = 55, 36.2%). Participants were generally satisfied with their life (4.03 +/−0.73) and found their daily activity mod-erately meaningful (3.96 +/−0.78). No participant indi-cated they were not satisfied with their life or that their daily activity was not meaningful (corresponding to a score of 0). Data were collected related to the seven major Australian illnesses [2], and prevalence of these disorders were: cardiovascular disease (n = 9, 5.9%); cancer (n = 3, 2.0%); mental health disorder (n = 19, 12.5%); diabetes (n = 4, 2.6%); chronic respiratory com-plaint (n = 13, 8.6%); and the combined arthritis and musculoskeletal complaints (n = 65, 42.8%).
Descriptive statistics for the participant responses to the PPM-O are presented in Table 2.
Confirmatory factor analysis 1
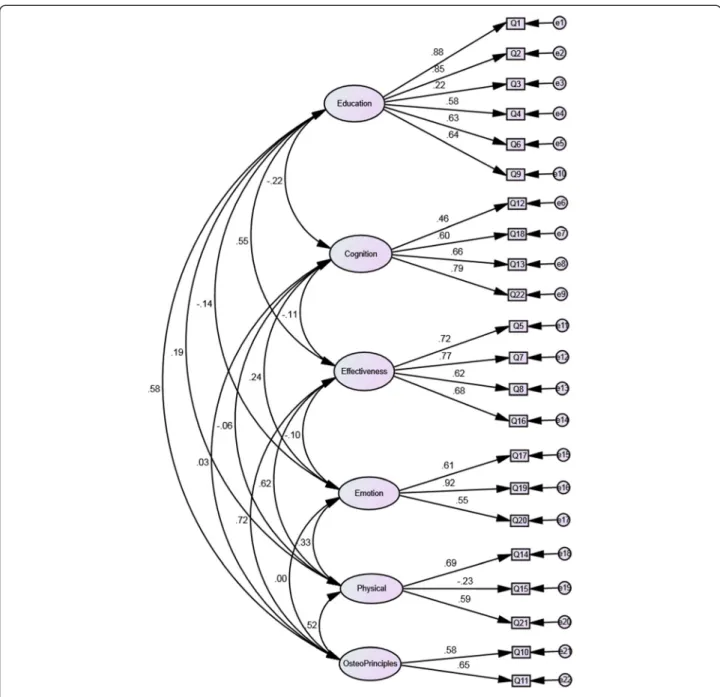
Data were initially fitted to the a-priori6 domain struc-ture proposed by Mulcahy et al. [13]. The path diagram
for this model is presented in Figure 1 and the fit statis-tics are presented in Table 1. The data did not fit the model as indicated by the statistically significant chi-square probability (p < 0.001) however the GFI was approaching the recommended value.
Rasch analysis 1
The data for the 22 item PPM-O did not fit the Rasch model (χ2 = 171.95, df = 44, p < 0.0001). The PSI was 0.783 indicating borderline internal consistency. The standard deviation fit residuals for both items (1.22) and persons (0.82) were not greater than 1.5. A poor fit re-sidual (>2.5) was identified for item 18 and statistically significant χ2 values for items 2 and 15, indicating a poor fit of these items to the Rasch model. Disordered thresholds were demonstrated for all items except 5–7, 11 and 15. The completed questionnaire from one per-son did not contain enough data and was removed, therefore 183 responses were analysed. DIF was identi-fied for SWL and MDA at item 20 (I feel alone after osteopathic treatment). Those participants with low SWL and MDA scores were more likely to endorse this item highly (agree or strongly agree). Assessment of di-mensionality indicated that the 22-item questionnaire was not unidimensional.
PPM-O Modification Confirmatory factor analysis
Given the lack of model fit in the first CFA and the multidimensional nature of the 22-item PPM-O, con-firmed through the initial Rasch analysis, the CFA model was modified to establish a multifactorial structure. Item covariances were analysed in order to modify the 22-item PPM-O. An 22-item was removed if the covariance with another item was greater than 10 or did not fit onto a factor. Figure 2 demonstrates the correlation between each of the 6 domains. Strong relationships were identi-fied between the Education, Effectiveness, Physical and Osteopathic Principles factors. The items in these
Table 1 CFA fit statistics for the two versions of the PPM-O
Statistic Recommended value 22-item PPM-O 13-item PPM-O
χ2 NA 357.23 130.46
χ2 p-value <0.05 >0.0001 >0.0001
df NA 194 64
χ2/df < or = 2 1.84 2.04
Goodness of fit index (GFI) > or = 0.9 0.828 0.879
Comparative fit index (CFI) > or = 0.9 0.841 0.855
Normed fit index (NFI) > or = 0.9 0.717 0.757
Tucker-Lewis index (TLI) > or = 0.9 0.811 0.824
Root mean square residual (RMR) As close to 0 as possible 0.048 0.054
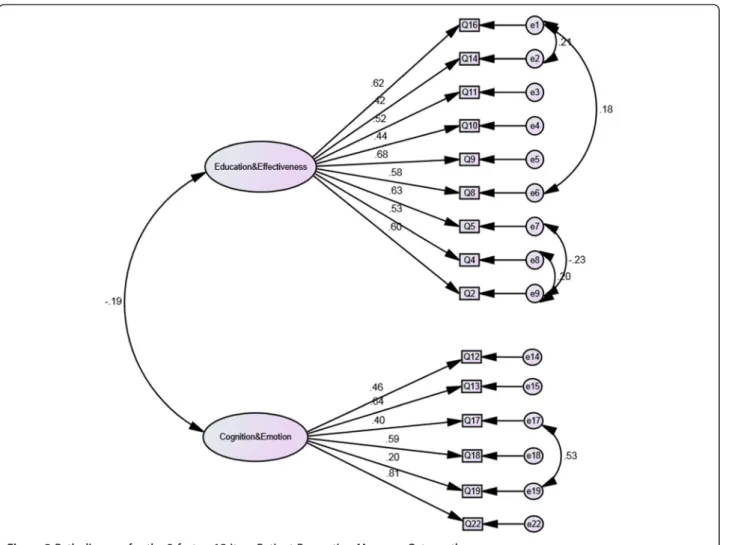
domains were combined into a single factor called Education & Effectiveness. The items remaining in the Cognition and Emotion factors were combined to form the Cognition & Fatigue factor. This process produced a 2-factor, 15 item version of the PPM-O (Figure 2).
Rasch analysis
The revised 2-factor, 15-item PPM-O was Rasch ana-lysed. As two factors had been identified, they were independently analysed in order for each factor to fit the Rasch model.
Rasch analysis of the education & effectiveness factor The Education & Effectiveness factor demonstrated fit to the Rasch model (χ2 = 35.47, df = 18, p = 0.008). The PSI was 0.763. The fit residual SD for items was 0.77 and 0.95 for persons. None of the items demonstrated statis-tically significant chi-square probabilities or fit residual SDs. Disordered thresholds were observed for all items
except 8, 9 and 16 (Additional file 1). There were 15 misfitting persons (out of 183 responses) and none of the items demonstrated DIF for any of the person fac-tors. In order to achieve model fit, a number of modifi-cations were made. Items 2, 4, 5, 9, 11, and 14 were rescored (Additional file 1) and this resolved the disor-dering for all items. Eighteen misfitting persons were re-moved from the analysis - these persons were not significantly different from the analysed persons with re-gard to demographics. All items demonstrated ordered thresholds and there was no DIF for any item. There were no residual correlations. The PCA and subsequent paired t-test of the positively and negatively loading items on the Rasch factor were statistically significant indicating the factor was unidimensional. With the item rescoring, the possible total score for this factor is 39. The mean person-item distribution for this factor is 2.35 (Figure 3). The item fit statistics are presented in Table 3.
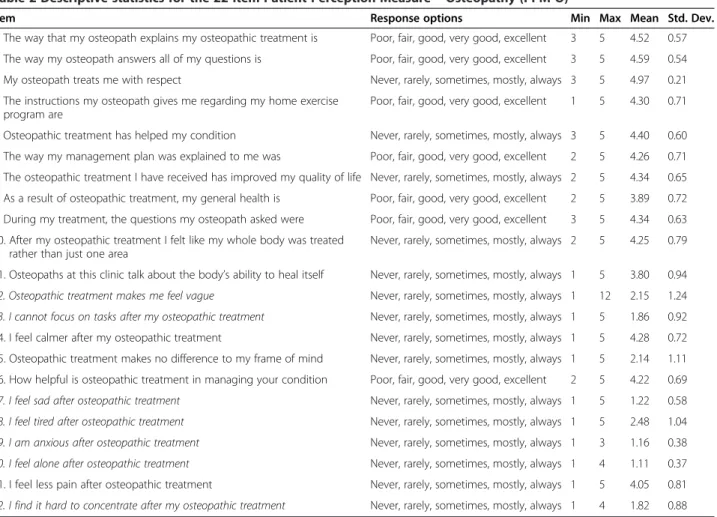
Table 2 Descriptive statistics for the 22-item Patient Perception Measure–Osteopathy (PPM-O)
Item Response options Min Max Mean Std. Dev.
1. The way that my osteopath explains my osteopathic treatment is Poor, fair, good, very good, excellent 3 5 4.52 0.57
2. The way my osteopath answers all of my questions is Poor, fair, good, very good, excellent 3 5 4.59 0.54
3. My osteopath treats me with respect Never, rarely, sometimes, mostly, always 3 5 4.97 0.21
4. The instructions my osteopath gives me regarding my home exercise program are
Poor, fair, good, very good, excellent 1 5 4.30 0.71
5. Osteopathic treatment has helped my condition Never, rarely, sometimes, mostly, always 3 5 4.40 0.60
6. The way my management plan was explained to me was Poor, fair, good, very good, excellent 2 5 4.26 0.71
7. The osteopathic treatment I have received has improved my quality of life Never, rarely, sometimes, mostly, always 2 5 4.34 0.65
8. As a result of osteopathic treatment, my general health is Poor, fair, good, very good, excellent 2 5 3.89 0.72
9. During my treatment, the questions my osteopath asked were Poor, fair, good, very good, excellent 3 5 4.34 0.63
10. After my osteopathic treatment I felt like my whole body was treated rather than just one area
Never, rarely, sometimes, mostly, always 2 5 4.25 0.79
11. Osteopaths at this clinic talk about the body’s ability to heal itself Never, rarely, sometimes, mostly, always 1 5 3.80 0.94
12. Osteopathic treatment makes me feel vague Never, rarely, sometimes, mostly, always 1 12 2.15 1.24
13. I cannot focus on tasks after my osteopathic treatment Never, rarely, sometimes, mostly, always 1 5 1.86 0.92
14. I feel calmer after my osteopathic treatment Never, rarely, sometimes, mostly, always 1 5 4.28 0.72
15. Osteopathic treatment makes no difference to my frame of mind Never, rarely, sometimes, mostly, always 1 5 2.14 1.11
16. How helpful is osteopathic treatment in managing your condition Poor, fair, good, very good, excellent 2 5 4.22 0.69
17. I feel sad after osteopathic treatment Never, rarely, sometimes, mostly, always 1 5 1.22 0.58
18. I feel tired after osteopathic treatment Never, rarely, sometimes, mostly, always 1 5 2.48 1.04
19. I am anxious after osteopathic treatment Never, rarely, sometimes, mostly, always 1 3 1.16 0.38
20. I feel alone after osteopathic treatment Never, rarely, sometimes, mostly, always 1 4 1.11 0.37
21. I feel less pain after osteopathic treatment Never, rarely, sometimes, mostly, always 1 5 4.05 0.81
22. I find it hard to concentrate after my osteopathic treatment Never, rarely, sometimes, mostly, always 1 4 1.82 0.88
Note: negatively phrased items are in italics and require rescoring prior to analysis. Legend–response option scoring.
Rasch analysis of the cognition & fatigue factor
The Cognition & Fatigue factor fitted the Rasch model (χ2 = 19.37, df = 12, p = 0.079). The fit residual SDs for both items and person were 1.15 and 0.86 respectively, indicting fit to the Rasch model. Threshold disordering was identified for items 13, 17 and 19 (Additional file 2). Twenty-two misfitting persons, of the 183 analysed, were also identified and subsequently removed from the ana-lysis. The PSI was 0.659 indicating average internal consistency of the factor. DIF was not observed for any of the person factors. Two separate analyses were under-taken in order to achieve fit to the Rasch model. Fit to the Rasch model was achieved (χ2 = 15.82, df = 8, p = 0.045)
summing the total score. The total score for this factor is 19. The person-item distribution has a mean of−1.336 reflecting the negatively worded items on this factor (Figure 4).
The lack of DIF for any of the person factors on both subscales supports the construct validity of the 13-item PPM-O [21].
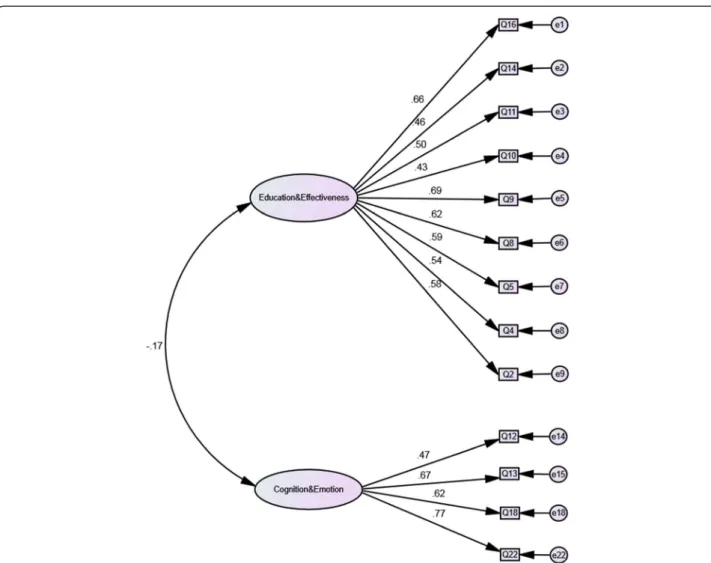
Confirming the structure of the two-factor, 13-item PPM-O The Rasch analysed two-factor PPM-O was then ana-lysed with a CFA. The path diagram for the revised 13-item PPM-O is presented in Figure 5 and the model fit statistics are presented in Table 1. The negative associ-ation between the two factors (−0.17) supports the fact Figure 2Path diagram for the 2-factor, 15-item Patient Perception Measure -Osteopathy.
the PPM-O is multidimensional and that a total score for PPM-O should not be calculated. Rather a score for each of the factors should be calculated.
Discussion
The purpose of the present study was to investigate the construct validity of the Patient Perception Measure – Osteopathy. The study used both classical test theory
(CTT) and modern test theory (MTT) to investigate the properties of the questionnaire. The focus of the discus-sion is the CTT and MTT results rather than the descrip-tive statistics derived from the completed questionnaires.
Psychometrics
The initial phase of the current research involved the analysis of the data set using confirmatory factor analysis
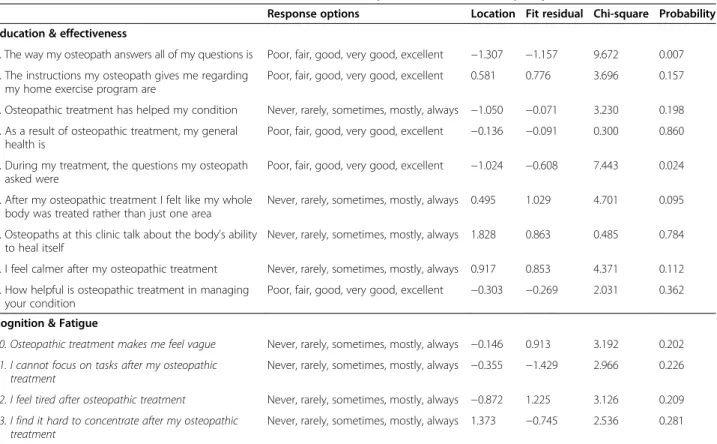
Table 3 Item fit statistics for the 2-factor, 13-item Patient Perception Measure–Osteopathy (PPM-O13)
Response options Location Fit residual Chi-square Probability Education & effectiveness
1. The way my osteopath answers all of my questions is Poor, fair, good, very good, excellent −1.307 −1.157 9.672 0.007
2. The instructions my osteopath gives me regarding my home exercise program are
Poor, fair, good, very good, excellent 0.581 0.776 3.696 0.157
3. Osteopathic treatment has helped my condition Never, rarely, sometimes, mostly, always −1.050 −0.071 3.230 0.198
4. As a result of osteopathic treatment, my general health is
Poor, fair, good, very good, excellent −0.136 −0.091 0.300 0.860
5. During my treatment, the questions my osteopath asked were
Poor, fair, good, very good, excellent −1.024 −0.608 7.443 0.024
6. After my osteopathic treatment I felt like my whole body was treated rather than just one area
Never, rarely, sometimes, mostly, always 0.495 1.029 4.701 0.095
7. Osteopaths at this clinic talk about the body’s ability to heal itself
Never, rarely, sometimes, mostly, always 1.828 0.863 0.485 0.784
8. I feel calmer after my osteopathic treatment Never, rarely, sometimes, mostly, always 0.917 0.853 4.371 0.112
9. How helpful is osteopathic treatment in managing your condition
Poor, fair, good, very good, excellent −0.303 −0.269 2.031 0.362
Cognition & Fatigue
10. Osteopathic treatment makes me feel vague Never, rarely, sometimes, mostly, always −0.146 0.913 3.192 0.202
11. I cannot focus on tasks after my osteopathic treatment
Never, rarely, sometimes, mostly, always −0.355 −1.429 2.966 0.226
12. I feel tired after osteopathic treatment Never, rarely, sometimes, mostly, always −0.872 1.225 3.126 0.209
13. I find it hard to concentrate after my osteopathic treatment
Never, rarely, sometimes, mostly, always 1.373 −0.745 2.536 0.281
Note: negatively phrased items are in italics and require rescoring prior to analysis. Legend–response option scoring.
Poor (1), fair (2), good (3), very good (4), excellent (5). Never (1), rarely (2), sometimes (3), mostly (4), always (5). NB these scores are reversed for negatively phrased items.
(CFA). CFA is appropriate given that the a-priori do-main structure of the PPM-O had previously been hypothesised by Mulcahy et al. [13]. The results of the CFA suggest that the domain structure proposed by these authors does not fit the data in the present study. Such a result would suggest that another subscale struc-ture is more appropriate. Subsequent analysis using the Rasch model indicated substantial issues with a range of items and a multidimensional structure. The MTT and CTT results challenged the construct validity of the 22-item PPM-O suggesting further analysis was required.
Drawing on the results from the first CFA, modifica-tions were made to the 22-item PPM-O in order to de-velop a subscale structure that fitted the data obtained in the present study. A two-factor, 15 item measure was produced and Rasch-analysed. To ensure that as many items as possible were retained to capture the patient ex-perience with osteopathic treatment, both the Education & Effectiveness and Cognition & Fatigue subscales were Rasch-analysed separately. In essence, this produced two
unidimensional subscales within the PPM-O. Following these Rasch analysis, a 2-factor, 13-item questionnaire was developed. It is important to note that given both sub-scales are unidimensional, they cannot be added together to form a single score for the PPM-O. This result is also supported by the CFA of the 13-item questionnaire where the data fitted the model and the correlation between the factors was negative. Support for the construct validity of the 13-item PPM-O is demonstrated by the lack of DIF for any of the items, that is, the response to an individual item was not affected by gender, age, satisfaction with life and meaningful daily activity.
The 13-item PPM-O measures two dimensions of the pa-tients’ experiences of osteopathic treatment: information, education and effectiveness of treatment; and cognitive changes and fatigue experienced post-osteopathic treatment.
Education & effectiveness factor
and education are often associated with favourable tient treatment outcomes [29-31] and meeting the pa-tient’s expectations [11]. These aspects are also strongly represented in the patient satisfaction literature in phys-ical therapy [3,6,32,33]. Given the literature identified here, the fact that information, education and effective-ness of treatment are contained in one dimension of the PPM-O in the current study is not surprising. Of note however is that previous measures have not included (i) Information, (ii) Education and (iii) Effectiveness into one dimension as has been demonstrated in the 13-item PPM-O. The items within this factor provide the practi-tioner with an overview of the effectiveness of their treatment, and suggest that there is a strong relationship between these three aspects of the patients’ perception of their treatment. Patient responses to the individual items in the Education & Effectiveness factor may assist practitioners in their future treatment and management of individual patients - if an individual patient’s ratings on a specific aspect of osteopathic care was not rated as being adequate or satisfactory by the patient, these as-pects of care may be addressed by the clinician in future treatment.
To the authors’ knowledge, the PPM-O is the first self-report measure to evaluate the patients’ perception of the influence of the osteopathic principles on their treatment. Items 6 and 7 capture two of these principles [34]: 1) The human being is a dynamic unit of function (item 6), and 2) The body possesses self-regulatory mechanisms that are self-healing in nature. Cotton [35] contends that without using the principles“…osteopathy ceases to exist as a distinctive form of healthcare.” The presence of the two PPM-O items related to the osteo-pathic principles may assist in ascertaining whether the patient perceives osteopathy to be a “…distinctive form of healthcare”.
Cognition & fatigue factor
Perceived change in cognitive function and fatigue asso-ciated with osteopathic treatment are captured in the PPM-O. Clinicians do not routinely assess cognitive ef-fects of manual therapy, and there are no valid and reli-able measures to assess these treatment outcomes. However, the PPM-O Cognition & Fatigue factor pro-vides an avenue to explore these aspects of osteopathic treatment. The concept of assessing fatigue in the PPM-O is supported by its presence in the SF-36 [36]. The PPM-O may be used, albeit with caution at this stage, to assess osteopathic patients’ perceived effect of their treatments on cognitive functioning. Changes in cogni-tive function have been demonstrated in intensive care [37,38] and anaesthesia settings [39] however there is no support in the manual therapy literature for these post-treatment responses. This may be of some interest as
the factor relates to the ability of patients to focus on tasks, concentrate, and feeling vague post osteopathic treatment, and could be the focus of subsequent studies. If patients frequently experience these cognitive re-sponses to osteopathic treatment, clinicians should con-sider them when treating and managing their patients. In particular care should be taken to ensure that a pa-tient is sufficiently alert and capable of performing their daily activities post-treatment. Consequently testing of cognitive responses to osteopathic treatment is required. To further explore cognitive responses to osteopathic treatment, future research may also include a pre- and post- treatment testing of visual or auditory attention, problem solving, or short-term memory [38].
Future opportunities
From a practical standpoint, the PPM-O is a brief 13-item measure and would take less than five minutes for patients to complete. Clinicians and educators can score and analyse the measure in less than five minutes. Sub-sequently the implementation of the questionnaire in both research and clinical practice settings is feasible. Users of the PPM-O should be aware that it is not de-signed to have a total questionnaire score calculated. Rather, the total score for each factor should be calcu-lated separately using the questionnaire interpretation provided in Additional file 3.
Prior to using the PPM-O in practice or research set-tings, the concurrent validity of the items in the Educa-tion & Effectiveness factor needs to be assessed against other patient satisfaction measures such as the measure developed by Hawthorne et al. [9]. Assessment of the concurrent validity of the Cognition & Fatigue factor items may prove more challenging, and may require a range of measures of cognitive functioning to be employed. Identifying the presence of depression, anx-iety or other conditions that may affect vitality and en-ergy is also recommended.
Limitations
incomplete questionnaires was made a priori as it was felt this would be more efficient for the CFA. The char-acteristics of the patients who did not complete all items on the PPM-O and the demographic questionnaire were analysed to ascertain whether this population differed from those who completed all items. There were no differences between these groups, however there was no record of the number of questionnaires provided to pa-tients and therefore a count of those potentially not returned for analysis was not possible. Further, no data were collected as to why any patients chose not to complete the PPM-O and this may have introduced some bias into the study.
Conclusions
The present study has modified a measure of patients’ perception of their osteopathic treatment (the PPM-O) and, in part, established the construct validity of the modified measure through the use of both CTT and MTT. The use of both of these statistical approaches has developed a measure with strong psychometric properties across the two factors in the PPM-O13. Cur-rently the PPM-O provides a measure of the patient-therapist interaction, including information, education and effectiveness, as well as a potential measure of cog-nitive functioning and fatigue experienced during, and after, osteopathic treatment. The items in the Education & Effectiveness factor are consistent with previous litera-ture, however the inclusion of items that relate to the osteopathic principles in a PROM is described in the lit-erature for the first time. The patients’ perception of osteopathy principles has not previously been explored and provides an interesting avenue for future research. The cognitive and fatigue aspects related to treatment outcomes has received little attention in the manual and physical therapy literature, and on the basis of the obser-vations made in this study warrants further investigation.
Additional files
Additional file 1:PPM-O Education & Effectiveness Factor–Category Probability Curves.
Additional file 2:PPM-O Cognition & Fatigue Factor–Category Probability Curves.
Additional file 3:PPM-O scoring guide.
Competing interests
The authors declare that they have no competing interests.
Authors’contributions
Both authors conceived and designed the study. Both authors undertook the literature, data collection, data analysis and write-up. Both authors approved the final version of the manuscript.
Authors’information
Brett Vaughan is a lecturer in the College of Health & Biomedicine, Victoria University, Melbourne, Australia and a Professional Fellow in the School of
Health & Human Sciences at Southern Cross University, Lismore, New South Wales, Australia. His interests are competency and fitness-to-practice assessments and evaluation, clinical education in allied health, and musculoskeletal rehabilitation.
Jane Mulcahy is a lecturer in the College of Health & Biomedicine at Victoria University, Melbourne, Australia. Her interests include scale development, health psychology, chronic illness and population health.
Acknowledgements
The authors wish to thank Dr Sandra Grace, Dr Keri Moore, Bridget Easdon, Amy Lawton and Courtney Lyons for their assistance with the data collection. Thanks are also extended to Tracy Morrison for her comments on the manuscript.
Author details
1Centre for Chronic Disease Prevention & Management, College of Health &
Biomedicine, Victoria University, Melbourne, Australia.2Institute of Sport, Exercise & Active Living, Victoria University, Melbourne, Australia.3School of Health & Human Sciences, Southern Cross University, Lismore, Australia.
Received: 26 April 2014 Accepted: 15 January 2015
References
1. Kosteniuk JG, Dickinson HD. Tracing the social gradient in the health of Canadians: primary and secondary determinants. Soc Sci Med. 2003;57(2):263–76. 2. Australian Institute of Health and Welfare. Australia’s health 2012. Australia’s
health series no.13. Cat. no. AUS 156. Canberra; 2012.
3. Beattie P, Pinto M, Nelson M, Nelson R. Patient satisfaction with outpatient physical therapy: instrument validation. Phys Ther. 2002;82(6):557–64. 4. Cross V, Leach CMJ, Fawkes CA, Moore AP. Patients’expectations of
osteopathic care: a qualitative study. Health Expect. 2013. doi:10.1111/hex.12084. 5. Strutt R, Shaw Q, Leach J. Patients’perceptions and satisfaction with
treatment in a UK osteopathic training clinic. Man Ther. 2008;13(5):456–67. 6. Hush JM, Cameron K, Mackey M. Patient satisfaction with musculoskeletal
physical therapy care: a systematic review. Phys Ther. 2011;91(1):25–36. 7. Hall AM, Ferreira PH, Maher CG, Latimer J, Ferreira ML. The influence of the
therapist-patient relationship on treatment outcome in physical rehabilitation: a systematic review. Phys Ther. 2010. doi:10.2522/ptj.20090245.
8. Rajendran D, Bright P, Bettles S, Carnes D, Mullinger B. What puts the adverse in‘adverse events’? Patients’perceptions of post-treatment experiences in osteopathy - a qualitative study using focus groups. Man Ther. 2012;17:305–11. 9. Hawthorne G, Sansoni J, Hayes L, Marosszeky N, Sansoni E. Measuring
patient satisfaction with health care treatment using the short assessment of patient satisfaction measure delivered superior and robust satisfaction estimates. J Clin Epidemiol. 2014;67(5):527–37.
10. Dworkin RH, Jensen MP, Gould E, Jones BA, Xiang Q, Galer BS, et al. Treatment satisfaction in osteoarthritis and chronic low back pain: the role of pain, physical and emotional functioning, sleep, and adverse events. J Pain. 2011;12(4):416–24.
11. Leach CMJ, Mandy A, Hankins M, Bottomley LM, Cross V, Fawkes CA, et al. Patients’expectations of private osteopathic care in the UK: a national survey of patients. BMC Complement Altern Med. 2013;13:122.
12. Mulcahy J, Vaughan B. Sensations experienced and patients’perceptions of osteopathy in the cranial field treatment. J Evid Based Complement Altern Med. 2014;19(4):235–46.
13. Mulcahy J, Vaughan B, Boadle J, Klas D, Rickson C, Woodman L. Item development for a questionnaire investigating patient self reported perception, satisfaction and outcomes of a single Osteopathy in the Cranial Field (OCF) treatment. Int J Osteopath Med. 2013;16(2):81–98.
14. Hurley AE, Scandura TA, Schriesheim CA, Brannick MT, Seers A, Vandenberg RJ, et al. Exploratory and confirmatory factor analysis: guidelines, issues, and alternatives. J Org Behav. 1997;18(6):667–83.
15. DiStefano C, Hess B. Using confirmatory factor analysis for construct validation: an empirical review. J Psychoeduc Assess. 2005;23(3):225–41. 16. Jackson DL, Gillaspy Jr JA, Purc-Stephenson R. Reporting practices in
confirmatory factor analysis: an overview and some recommendations. Psychol Methods. 2009;14(1):6–23.
18. Schreiber JB, Nora A, Stage FK, Barlow EA, King J. Reporting structural equation modeling and confirmatory factor analysis results: a review. J Educ Res. 2006;99(6):323–38.
19. Rasch G. Studies in mathematical psychology: I. Probabilistic models for some intelligence and attainment tests. 1960.
20. Tavakol M, Dennick R. Psychometric evaluation of a knowledge based examination using rasch analysis: an illustrative guide: AMEE Guide No. 72. Med Teach. 2013;35(1):e838–48.
21. Pallant JF, Tennant A. An introduction to the rasch measurement model: an example using the Hospital Anxiety and Depression Scale (HADS). Br J Clin Psychol. 2007;46(1):1–18.
22. Tor E, Steketee C. Rasch analysis on OSCE data: an illustrative example. Australas Med J. 2011;4(6):339.
23. Retief L, Potgieter M, Lutz M. The usefulness of the rasch model for the refinement of likert scale questionnaires. Afr J Res Math Sci Technol Educ. 2013;17(1–2):126–38.
24. Pallant JF, Miller RL, Tennant A. Evaluation of the Edinburgh post natal depression scale using rasch analysis. BMC Psychiatry. 2006;6(1):28. 25. Mulcahy JC. Meaningful daily activity and chronic pain. Melbourne, Australia:
Victoria University; 2011.
26. Edelen MO, Reeve BB. Applying Item Response Theory (IRT) modeling to questionnaire development, evaluation, and refinement. Qual Life Res. 2007;16(1):5–18.
27. Tennant A, Conaghan PG. The rasch measurement model in rheumatology: what is it and why use it? When should it be applied, and what should one look for in a rasch paper? Arthritis Care Res. 2007;57(8):1358–62.
28. Andrich D, Sheridan B, Luo G. Rasch models for measurement: RUMM2030. Perth, Western Australia: RUMM Laboratory Pty Ltd; 2010.
29. Licciardone JC, Gamber R, Cardarelli K. Patient satisfaction and clinical outcomes associated with osteopathic manipulative treatment. J Am Osteopath Assoc. 2002;102(1):13–20.
30. Licciardone JC, Herron KM. Characteristics, satisfaction and perceptions of patients receiving ambulatory healthcare from osteopathic physicians: a comparative national survey. J Am Osteopath Assoc. 2001;101(7):374–86. 31. Medina-Mirapeix F, Jimeno-Serrano FJ, Escolar-Reina P, Del Bano-Aledo ME.
Is patient satisfaction and perceived service quality with musculoskeletal rehabilitation determined by patient experiences? Clin Rehabil. 2012;27(6):1–10. 32. Monnin D, Perneger TV. Scale to measure patient satisfaction with physical
therapy. Phys Ther. 2002;82(7):682–91.
33. Beattie P, Turner C, Dowda M, Mirchener L, Nelson R. The MedRisk instrument for measuring patient satisfaction with physical therapy care: a psychometric analysis. J Orthop Sports Phys Ther. 2005;35(1):24–32. 34. Ward RC, Hruby RJ, Jerome JA, Jones JM, Kappler RE, Kuchera ML, et al.
Foundations for osteopathic medicine. Baltimore, USA: Lippincott Williams & Wilkins; 2002.
35. Cotton A. Osteopathic principles in the modern world. Int J Osteopath Med. 2013;16(1):17–24.
36. Ware JE, Sherbourne CD. The MOS 36-Item Short-Form Health Survey (SF-36): I. conceptual framework and item selection. Med Care. 1992;30(6):473–83. 37. Wolters AE, Slooter AJ, van der Kooi AW, van Dijk D. Cognitive impairment
after intensive care unit admission: a systematic review. Intensive Care Med. 2013;39(3):376–86.
38. Torgersen J, Hole JF, KvÅLe R, Wentzel-Larsen T, Flaatten H. Cognitive impairments after critical illness. Acta Anaesthesiol Scand. 2011;55(9):1044–51. 39. Nadelson M, Sanders R, Avidan M. Perioperative cognitive trajectory in
adults. Br J Anaesth. 2014. doi:10.1093/bja/aet420.
40. Burke SR, Myers R, Zhang AL. A profile of osteopathic practice in Australia 2010–2011: a cross sectional survey. BMC Musculoskel Disord. 2013;14(1):1–10.
Submit your next manuscript to BioMed Central and take full advantage of:
• Convenient online submission
• Thorough peer review
• No space constraints or color figure charges
• Immediate publication on acceptance
• Inclusion in PubMed, CAS, Scopus and Google Scholar
• Research which is freely available for redistribution