08 August, 2004
The Victorian Electronics
Industry Cluster
By
John Houghton
Centre for Strategic Economic Studies
(Victoria University)
with
Lyndal Thorburn
Advance Consulting & Evaluation
Acknowledgements
The author would like to acknowledge the support of staff at The Centre for Strategic Economic Studies (Victoria University) and Advance Consulting & Evaluation for their efforts in the preparation of this report (including Lyndal Thorburn, Jacqueline Cousins, Alison Welsh, Neelam Maharaj and Sonia Mussawir), staff of AEEMA (particularly Arif Haque and Angus Robinson) and those in the Victorian Electronics Industry who gave so generously of their time in responding to the survey and questions.
Disclaimer
While every effort has been made to ensure its accuracy, The Centre for Strategic Economic Studies (Victoria University) does not make any representations or warranties (express or implied) as to the accuracy or completeness of the information contained in this Report. The Centre for Strategic Economic Studies (Victoria University), its employees and agents do not accept any liability in negligence for the information (or the use of such information) which is provided in this report.
Copyright
Table of Contents
1
INTRODUCTION ... 1
1.1 T
HE ELECTRONICS INDUSTRY INA
USTRALIA... 1
1.1.1
Australia’s electronics industry employment and production... 1
1.1.2
Australia’s electronics equipment trade... 4
1.1.3
Australia’s electronics supply chain... 6
1.2 T
HEE
LECTRONICI
NDUSTRYA
CTIONA
GENDA... 8
1.3 C
LUSTER STUDIES AND CLUSTER MAPPING... 10
1.3.1
Why there is a growing interest in clusters? ... 13
1.3.2
What are the major insights from cluster studies? ... 14
1.3.3
Approaches to identifying and mapping clusters ... 15
1.3.4
The Product System approach... 16
1.4 T
HEV
ICTORIAN ELECTRONICS INDUSTRY CLUSTER STUDY... 18
2
INDUSTRY TRENDS AND FUTURES... 20
2.1 W
ORLDWIDE ELECTRONICS PRODUCTION AND MARKETS... 20
2.2 E
LECTRONICS INDUSTRY EVOLUTION... 23
2.3 M
ANAGING THE ELECTRONICS SUPPLY CHAIN... 26
2.4 E
NVIRONMENTAL AND REGULATORY DEVELOPMENTS... 31
2.5 E
MERGING TECHNOLOGIES,
OPPORTUNITIES AND MARKETS... 31
3
THE ELECTRONICS INDUSTRY IN VICTORIA... 35
3.1 V
ICTORIA’
S ELECTRONICS INDUSTRY EMPLOYMENT AND PRODUCTION... 35
3.2 V
ICTORIA’
S ELECTRONICS EQUIPMENT TRADE... 39
3.3 V
ICTORIA’
S ELECTRONICS PRODUCTION COSTS... 42
3.4 V
ICTORIA’
S ELECTRONICS INDUSTRYR&D
ACTIVITIES... 42
3.5 E
LECTRONICSR&D
INV
ICTORIA... 43
3.5.1
Electronics R&D in Victoria by field of research ... 43
3.5.2
Electronics R&D in Victoria by socio-economic objective ... 44
3.6 E
MPLOYMENT IN ELECTRONICS OCCUPATIONS... 46
4
THE VICTORIAN ELECTRONICS INDUSTRY CLUSTER SURVEY ... 47
4.1 E
LECTRONICS FIRMS AND ACTIVITIES... 47
4.2 L
OCATIONAL CLUSTERING OF ELECTRONICS ACTIVITIES... 50
4.3 C
HARACTERISTICS OF FIRMS IN THE ELECTRONICS CLUSTER... 54
4.3.1
Source of financing... 55
4.3.2
Barriers to growth ... 55
4.4 V
ICTORIA’
S ELECTRONICS CLUSTER CAPABILITIES... 56
4.4.1
Supply to electronics manufacturing ... 59
4.4.2
Electronics manufacturing ... 60
4.4.3
Electronics related services... 62
4.5 V
ICTORIA’
S ELECTRONICS PRODUCT SYSTEM... 64
4.5.1
Supplier linkages and locations... 64
4.5.2
Supply-side concentration ... 68
4.5.3
Customer linkages and locations... 69
4.5.4
Demand-side concentration... 73
4.5.5
Power and governance in the supply chain... 74
4.6 N
ON-
TRANSACTIONAL CLUSTER LINKAGES... 75
4.7 I
NNOVATION,
INFORMATION AND KNOWLEDGE FLOWS... 80
4.7.1
Introduction of new products and services... 80
4.7.2
Knowledge management and quality control ... 81
4.7.3
Sources of information and ideas ... 82
4.7.4
Research & development activities... 85
4.8 E
MPLOYMENT,
SKILLS AND TRAINING... 88
4.8.1
Skills profile... 90
4.8.2
Education and training practices ... 91
4.8.3
Skills supply concerns... 92
4.9 M
AIN POINTS ARISING FROM THE SURVEY... 93
5
CAPABILITIES AND EMERGING OPPORTUNITIES ... 94
5.1 V
ICTORIA’
S ELECTRONICS PRODUCT SYSTEM... 94
5.2 V
ERTICAL MARKET AND HALO CLUSTERS... 96
5.2.1
Automotive ... 97
5.2.2
Communications and IT ... 98
5.2.3
Medical Devices ... 101
5.2.4
Security ... 102
5.2.5
Industrial & process control... 103
5.2.6
Instrumentation... 104
5.2.7
Power Supplies ... 105
5.2.8
Contract manufacturing and PCBs ... 106
5.2.9
Other markets and activities... 107
5.3 T
ECHNOLOGY AND HORIZONTAL CLUSTERS... 107
5.4 S
TRUCTURE AND STRUCTURAL CHANGE... 108
5.4.1
Networks and clusters... 110
5.4.2
Shared infrastructure... 113
5.4.3
Lead projects ... 113
5.4.4
Supply chain management ... 114
5.5 K
EY POINTS... 115
APPENDIX A ELECTRONICS CLUSTERING IN VICTORIA
……...……….
117
APPENDIX B COLLECTIVE SUPPORT INFRASTRUCTURE
...………
126
List of Tables & Boxes
T
ABLE1.1 T
HE ELECTRONICS INDUSTRY INA
USTRALIA, 1996-97
TO2000-01 ... 2
T
ABLE1.2 ICT
EQUIPMENT TRADE1992-93
TO2002-03 ... 5
T
ABLE1.3 A
USTRALIA’
S ELECTRONICS MANUFACTURES SUPPLY CHAIN, 1996-97... 7
T
ABLE2.2 W
ORLD PRODUCTION BY SECTORS, 2002-2007 ... 22
T
ABLE2.2 T
OP50
CONTRACT MANUFACTURERS, 2002 ... 24
T
ABLE2.3 U
SE OF ONLINE COLLABORATION BY ELECTRONICS FIRMS, 2003 ... 27
B
OX2.1 I
MPACTS OF E-
COMMERCE IN THEUK
ELECTRONICS INDUSTRIES... 28
T
ABLE2.4 E
LECTRONICSB2B
E-
MARKETPLACES... 29
B
OX2.2 T
HE SUPPLY CHAIN AND SUPPLY CHAIN MANAGEMENT... 30
T
ABLE3.1 T
HE ELECTRONICS INDUSTRY INV
ICTORIA, 1996-97
TO1999-2000 ... 36
T
ABLE3.2 V
ICTORIA’
SICT
EQUIPMENT TRADE, 1992-93
TO2002-03 ... 40
T
ABLE3.3 V
ICTORIA’
SICT
EQUIPMENT EXPORTS AND IMPORTS, 2002-03 ... 41
T
ABLE3.4 E
XPENDITURE ONR&D
BY EQUIPMENT MANUFACTURERS, 1996-2002 .. 42
T
ABLE3.5 E
LECTRONICSR&D
EXPENDITURE BY SECTOR OF EXECUTION... 43
T
ABLE3.6 P
UBLIC SECTOR ELECTRONICSR&D
EXPENDITURE, 2000-01... 44
T
ABLE3.7 E
LECTRONICSR&D
INV
ICTORIA BY OBJECTIVE, 2000-01 ... 45
T
ABLE3.8 E
MPLOYMENT IN ELECTRONICS OCCUPATIONS, 1998
TO2002 ... 46
T
ABLE4.1 E
LECTRONICS CLUSTER FIRMS INV
ICTORIA... 47
T
ABLE4.2 V
ICTORIAN ELECTRONICS CLUSTER FIRMS BY SUB-
CATEGORY... 49
T
ABLE4.3 S
IX MAJOR CONCENTRATIONS OF ELECTRONICS FIRMS... 50
T
ABLE4.4 E
LECTRONICS FIRMS BYL
OCALG
OVERNMENTA
REA... 52
T
ABLE4.5 P
RINCIPAL EXPORT MARKETS REPORTED BY EXPORTING FIRMS... 63
T
ABLE4.6 M
ETHODS OF MANAGING EXPORTS... 64
T
ABLE4.7 L
OCATION OFT
OP3
SUPPLIERS... 64
T
ABLE4.8 P
ERCENTAGE OF SUPPLIES FROMT
OP3 S
UPPLIERS BY SECTOR... 68
T
ABLE4.9 L
OCATION OFT
OP3
CUSTOMERS... 69
T
ABLE4.10 P
ERCENTAGE OF SALEST
OP3
CUSTOMERS BY SECTOR... 74
T
ABLE4.11 P
RESENCE OF A DOMINANT PLAYER IN THE SUPPLY CHAIN... 74
T
ABLE4.12 C
OUNT OF LINKAGES BY TYPE AND PURPOSE... 77
T
ABLE4.13 C
OUNT OF LINKS BY SECTOR... 77
T
ABLE4.14 R
EGULAR LINKAGES AND INTERACTION... 78
T
ABLE4.15 P
ERCENTAGE OF SALES REVENUE BY YEAR OF INTRODUCTION&
SECTOR81
T
ABLE4.16 P
ERCENTAGE OF FIRMS WITH KNOWLEDGE&
QUALITY SYSTEMS... 81
T
ABLE4.17 S
OURCES OF INFORMATION ABOUT NEW TECHNICAL DEVELOPMENTS... 82
T
ABLE4.18 S
OURCES OF INFORMATION ABOUT NEW PRODUCT DEVELOPMENTS... 84
T
ABLE4.19 P
ERCENTAGE OFV
ICTORIAN EMPLOYEES BY CATEGORY AND SECTOR.... 90
T
ABLE4.20 Q
UALIFICATIONS OFV
ICTORIANE
MPLOYEES BYS
ECTOR... 91
T
ABLE4.21 F
ORMAL TRAINING POLICIES BY SECTOR... 91
T
ABLE5.1 S
TRENGTHS, W
EAKNESS, O
PPORTUNITIES ANDT
HREATS... 102
B
OX5.1 M
AJOR TRENDS IN ELECTRONICS MANUFACTURING... 111
List of Figures
F
IGURE1 T
HEV
ICTORIAN ELECTRONICS CLUSTER: A
N OVERVIEW...
XIVF
IGURE2 T
HE STRUCTURE OF THE ELECTRONICS INDUSTRY...
XVIF
IGURE3 D
IMENSIONS OF SPECIALISATION AND DEVELOPMENT IN ELECTRONICS.
XVIIF
IGURE4 C
OLLABORATIVE PRODUCT COMMERCE...
XXF
IGURE1.1 E
MPLOYMENT IN ELECTRONICS MANUFACTURING, 2000-01 ... 3
F
IGURE1.2 E
LECTRONICS MANUFACTURING INDUSTRY VALUE ADDED, 2000-01 ... 4
F
IGURE1.3 ICT
EQUIPMENT EXPORT SHARES, 2002-03 ... 6
F
IGURE1.4 P
ORTER'
SD
IAMOND... 11
F
IGURE1.5 A S
CHEMATICE
LECTRONICSP
RODUCTS
YSTEM... 18
F
IGURE2.1 W
ORLD ELECTRONICS MARKETS, 2000
TO2005 ... 21
F
IGURE2.2 W
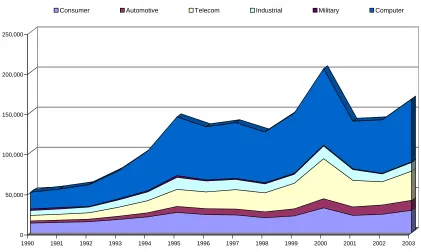
ORLDWIDE SEMICONDUCTOR MARKET BY SEGMENT, 1990
TO2003 .... 21
F
IGURE2.3 E
VOLUTION OF ELECTRONICS MANUFACTURING OUTSOURCING... 25
F
IGURE2.4 D
IMENSIONS OF SPECIALISATION AND DEVELOPMENT IN ELECTRONICS... 26
F
IGURE3.1 E
MPLOYMENT IN ELECTRONICS MANUFACTURING INV
ICTORIA... 37
F
IGURE3.2 E
LECTRONICS MANUFACTURING INDUSTRY VALUE ADDED INV
ICTORIA. 37
F
IGURE3.3 E
MPLOYMENT BY ELECTRONICS INDUSTRY SECTOR, J
UNE2000... 38
F
IGURE3.4 V
ICTORIA’
S EXPORTS OFICT
EQUIPMENT,
1992-93
TO2002-03 ... 40
F
IGURE3.5 E
LECTRONICSR&D
INV
ICTORIA BY OBJECTIVE, 2000-01... 45
F
IGURE4.1 E
LECTRONICS CLUSTER FIRMS IDENTIFIED INV
ICTORIA... 48
F
IGURE4.2 E
LECTRONICS CLUSTER FIRMS SAMPLED INV
ICTORIA... 48
F
IGURE4.3 E
LECTRONICS INDUSTRY CLUSTERING: G
REATERM
ELBOURNE... 51
F
IGURE4.4 E
LECTRONICS INDUSTRY CLUSTERING: V
ICTORIA... 53
F
IGURE4.5 L
OCATION OF REVENUE EARNINGS, 2002-03 ... 54
F
IGURE4.6 S
OURCES OF FINANCE FORV
ICTORIAN ELECTRONICS FIRMS... 55
F
IGURE4.7 B
ARRIERS TO GROWTH OFV
ICTORIAN ELECTRONICS FIRMS... 56
F
IGURE4.8 S
OURCE OF REVENUE BY ACTIVITY... 57
F
IGURE4.9 F
OCUS OF ACTIVITIES BY VALUE AND VOLUME... 57
F
IGURE4.10 V
ALUE/ V
OLUME FOCUS BY SECTOR... 58
F
IGURE4.11 S
UPPLIES INTO ELECTRONICS MANUFACTURING... 59
F
IGURE4.12 S
UPPLIES INTO ELECTRONICS MANUFACTURING... 60
F
IGURE4.13 E
LECTRONICS MANUFACTURING ACTIVITIES... 61
F
IGURE4.14 E
LECTRONICS MANUFACTURING ACTIVITIES... 61
F
IGURE4.15 E
LECTRONICS RELATED SERVICES ACTIVITIES... 62
F
IGURE4.16 L
OCATIONS OFT
OP3
SUPPLIERS... 65
F
IGURE4.17 L
OCATIONS OFT
OP3
SUPPLIERS BY SECTOR... 65
F
IGURE4.18 L
OCATION OFT
OP3
OVERSEAS SUPPLIERS... 66
F
IGURE4.19 L
OCATION OFT
OP3
SUPPLIERS BY SUPPLY COSTS... 67
F
IGURE4.20 L
OCATION OFT
OP3
OVERSEAS SUPPLIERS BY SUPPLY COSTS... 67
F
IGURE4.21 I
TEMS SUPPLIED BYT
OP3
SUPPLIERS BY COST... 69
F
IGURE4.22 L
OCATIONS OFT
OP3
CUSTOMERS... 70
F
IGURE4.23 L
OCATION OFT
OP3
CUSTOMERS BY SECTOR... 70
F
IGURE4.24 L
OCATION OFT
OP3
OVERSEAS CUSTOMERS... 71
F
IGURE4.25 L
OCATION OFT
OP3
CUSTOMERS BY SALES REVENUES... 72
F
IGURE4.26 L
OCATION OFT
OP3
OVERSEAS CUSTOMERS BY SALES REVENUES... 72
F
IGURE4.27 T
YPES OF CUSTOMERS AMONGT
OP3
BY VALUE OF SALES... 73
F
IGURE4.29 T
YPES OF LINKAGES... 76
F
IGURE4.30 P
URPOSE OF LINKAGES... 76
F
IGURE4.31 L
INKAGES BY SECTOR... 78
F
IGURE4.32 S
TANDARDS AND COMPLIANCE RELATED LINKAGES... 79
F
IGURE4.33 S
UPPORT AND DEVELOPMENT RELATED LINKAGES... 79
F
IGURE4.34 P
ERCENTAGE OF SALES REVENUE FROM PRODUCTS BY YEAR... 80
F
IGURE4.35 A
VERAGE NUMBER OF SOURCES ON NEW TECHNICAL DEVELOPMENTS... 83
F
IGURE4.36 A
VERAGE NUMBER OF SOURCES ON NEW PRODUCT DEVELOPMENTS... 84
F
IGURE4.37 P
ERCENTAGE OF FIRMS DOING FORMALR&D
BY SECTOR... 85
F
IGURE4.38 P
ERCENTAGE OF TURNOVER SPENT ONR&D
BY SECTOR... 86
F
IGURE4.39 M
AIN METHOD OFR&D
BY SECTOR... 87
F
IGURE4.40 L
OCATION OFR&D
BY SECTOR... 87
F
IGURE4.41 M
AIN SOURCE OFR&D
FUNDING BY SECTOR... 88
F
IGURE4.42 V
ICTORIAN STAFF BY SECTOR, 2000
AND2003 ... 89
F
IGURE4.43 A
VERAGEV
ICTORIAN STAFF PER FIRM BY SECTOR, 2003 ... 89
F
IGURE4.44 V
ICTORIAN EMPLOYEES BY CATEGORY AND SECTOR... 90
F
IGURE4.45 S
KILLS IN SHORT SUPPLY NOW AND IN THE FUTURE... 92
F
IGURE5.1 T
HEV
ICTORIAN ELECTRONICS CLUSTER: A
N OVERVIEW... 95
F
IGURE5.2 T
HE STRUCTURE OF THE ELECTRONICS INDUSTRY... 109
F
IGURE5.3 D
IMENSIONS OF SPECIALISATION AND DEVELOPMENT IN ELECTRONICS. 110
F
IGURE5.4 C
OLLABORATIVE PRODUCT COMMERCE... 114
F
IGUREA1 E
LECTRONICS INDUSTRY CLUSTERING: (A
LLS
ECTORS) ... 117
F
IGUREA2 E
LECTRONICS INDUSTRY CLUSTERING: (C
OMMUNICATIONS) ... 118
F
IGUREA3 E
LECTRONICS INDUSTRY CLUSTERING: (C
OMPONENTS) ... 119
F
IGUREA4 E
LECTRONICS INDUSTRY CLUSTERING: (E
QUIPMENT) ... 120
F
IGUREA5 E
LECTRONICS INDUSTRY CLUSTERING: (IT) ... 121
F
IGUREA6 E
LECTRONICS INDUSTRY CLUSTERING: (L
IGHTING) ... 122
F
IGUREA7 E
LECTRONICS INDUSTRY CLUSTERING: (M
ACHINERY) ... 123
F
IGUREA8 E
LECTRONICS INDUSTRY CLUSTERING: (S
ECURITY) ... 124
Navigating this document
Section 1: Begins with a brief look at the electronics industry in Australia. It presents a short summary of the Electronics Industry Action Agenda and the approach used to cluster mapping and then outlines the purpose and aims of this study.
Section 2: Looks at electronics industry trends and futures, including world electronics market trends, globalisation and structural change, technology futures and convergence.
Section 3: Synthesises data from a range of existing sources in order to present an overview of electronics manufacturing in Victoria and compare activities in Victoria with those elsewhere in Australia.
Section 4: Reports findings from the survey of the Victorian Electronics Cluster undertaken for this study. It focuses on underlying value chain, product system, learning and innovation linkages.
Section 5: Looks at cluster capabilities and emerging opportunities. It begins with an overview of the Victorian electronics product system, then explores the key cluster dimensions operating within the electronics industry in Victoria.
Executive Summary
This report is based on a study undertaken by the Centre for Strategic Economic Studies, Victoria University. It aims to contribute to a better understanding of the entire electronics value chain – from the design and manufacture of components and inputs to electronics manufacturing, through manufacturing and assembly, wholesale and retail distribution, installation, maintenance and repair of electrical and electronic equipment.
Electronics is a key enabling technology which underpins developments in a range of industries. In 2000-01, the electronics manufacturing industries employed around 34,750 people in Australia, realised turnover of $8.9 billion and contributed more than $2.5 billion to Gross Domestic Product (GDP).1 Over the period 1996-97 to 2000-01, employment in the industry
grew by just 0.3% per annum. Wages and salaries increased by 6.5% per annum, suggesting an increasing focus on higher-value activities.
Issues and trends
The electronics industry is being shaped by many forces. These include:
• Market trends and growth, with a return to growth in ICTs and renewed growth in automotive and consumer electronics;
• The fragmentation of the value chain, with standardisation and modularisation supporting increased outsourcing and specialisation along the value chain;
• The need to rapidly develop new business models to support increased firm and regional specialisation;
• The drive to make better use of internet-based technologies and e-business applications to support supply chain management, participation and integration;
• Environmental and regulatory demands for the removal of ‘materials of concern’ and increased whole-of-life ‘product stewardship’; and
• The emergence and cross-fertilisation of new, converging technologies (eg. nanotechnology).
Market opportunities
Following the severe downturn of 2000-01, the worldwide electronics market now appears to be returning to annual growth rates of 5% to 7%. This is slower than the historical long-term trend,
1 Following the Electronics Industry Action Agenda, the electronics manufacturing industry is defined
due to a combination of persistently slow market and production growth in developed countries. However, there is strong growth in developing countries, particularly China.2
Major world market growth areas include:
• Automotive electronics – with demands for increased comfort, enhanced features, engine efficiency and safety increasing the electronics content of vehicles;
• Consumer electronics – with the replacement of cathode ray tube displays by flat screens and new consumer products, such as DVD-writers, set-top boxes, digital TVs, home cinema, digital cameras and game consoles revitalising the sector; and
• Power electronics – with increasing demands for security and uninterruptability of supply, mobility and the emergence of an ever wider array of mobile devices, and the development of electric and hybrid vehicles.3
Structural change
Electronics industry sub-sectors vary in structure and dynamics. Whereas original equipment manufacturers (OEMs) can be vertically integrated, keeping large parts of the production and value creation process in-house, much of the electronics industry is characterised by a high degree of specialisation along the value chain, with standardisation and the modular nature of electronic products supporting high levels of specialisation and outsourcing.4
Increasingly, this fragmentation of the value chain is happening globally, with the formation of specialised production clusters participating in global production systems. At the same time there are cross-cutting trends, with labour-intensive, volume manufacturing shifting to contract equipment manufacturers in Asia, while Europe and the United States retain the high-end, knowledge intensive stages of the value chain, such as research and product development.5
However, high unit volume products evolve quickly from small scale manufacturing near design centres of gravity, to large scale manufacturing near market centres of gravity, and finally to large scale manufacturing near low cost labour centres of gravity.6 Unable to compete with
Asian locations on labour costs, and remote from major markets, Australia’s electronics industry must seek to maintain a position as a design and development ‘centre of gravity’ and/or focus on lower unit volume products.
2 Reed Electronics Research (2004) Yearbook of World Electronics Data: Volume 1, 2004. Available
http://www.instat.com/catalog/
3 Electronics.ca (2003) World Electronics Industry 2002-2007, Research Report # DE3120. Available
http://www.electronics.ca/reports/industrial/electronics_industry.html
4 E-business Watch (2003) ICT and e-business in the Electrical Machinery and Electronics Sector,
European Commission, Sector Report 11/II, p13. Available http://www.ebusiness-watch.org/marketwatch/
5 E-business Watch (2003) ICT and e-business in the Electrical Machinery and Electronics Sector,
European Commission, Sector Report 11/II, p14. Available http://www.ebusiness-watch.org/marketwatch/
Managing the supply chain
This rapid evolution of industry structures, value chain fragmentation, the emergence of new business models and increasing firm and regional specialisation are making supply chain management increasingly important. As well as offering the potential to increase productivity, the use of internet-based technologies and e-business techniques support the increasing scope of outsourced operations, which require loosely coupled business processes spanning multiple companies.7 The ability of Victorian Electronics Cluster firms to operate effectively and
efficiently within global and highly automated supply chains will be a key determinant of their ability to access and prosper on world markets. The successful implementation of supply chain management and related e-business solutions will be crucial.
Environmental and regulatory concerns
To meet regional environmental legislative requirements, manufacturers must remove ‘materials of concern’. There is increasing pressure to ensure product recyclability and even conduct recycling, and an increasing focus on lowering energy use, both in manufacturing and in product operation. There is also greater focus on ‘product stewardship’, with the electronics industry facing product end-of-life or producer responsibility legislation in some markets.
These demands raise two issues. First, how to manufacture in such a way as to comply and manufacture products that comply from a technological point of view. Second, how to establish and operate the systems to enable, support and manage conformance. Environmental legislation in various product segments will require the electronics industry to share detailed material content data on their products and components and to establish systems for product stewardship. Again, the adoption and use of sophisticated e-business applications and supply chain information systems is likely to be crucial.
Electronics futures and convergence
It has been widely noted by futurists that many of the more important technology trends of recent years have points of intersection. Indeed, convergence has been seen as a ‘mega-trend’, with cross-fertilisation of technology trends driving each other further and faster. Crucially, electronics is a vital enabler and key participant in many of these converging trends. It is, for example, becoming increasingly difficult to separate microelectronics, photonics and nanotechnology. As a result, future cluster strengths may require hitherto disparate skills, and the future of regional clusters may depend upon their combination and coordination, rather than the continued development of focused local strengths.
Electronics in Victoria
In 1999-2000, the electronics manufacturing industries employed 11,681 people in Victoria, realised turnover of $3.4 billion and contributed more than $920 million to Gross State Product (GSP). Victoria accounted for around 35% of national employment in the electronics manufacturing industry, 41% of industry turnover and 38% of industry value added – somewhat
higher than Victoria’s share of manufacturing overall. Moreover, Victoria accounts for 69% of national employment in automotive electronics manufacturing, and around 45% of national employment in cable and wire manufacturing.
These data reveal Victoria’s relative strengths in automotive electronics and professional and scientific equipment, as well as a wealth of electronics manufacturing capabilities in other areas.
Employment and skills
Since the mid 1990s there have been mixed employment trends. The strongest employment growth in Victoria’s electronics manufacturing industry has been in professional and scientific equipment. In all other areas of electronics manufacturing in Victoria employment has declined, most notably in telecommunication, broadcasting and transceiving equipment, other electronic equipment, and cable and wire manufacturing.
Because electronics is a generic technology people with electronics related skills work in a wide range of industries. At the end of June 2002, there were around 102,700 people employed in electronics occupations in Australia.8 Employment in these occupations has declined by around
7,000 over the last three years, with a decline in communications tradespersons driving the overall trend and job growth in other areas. In Victoria there were more than 23,800 people employed in these electronics occupations – 23% of the national total and around 1% of the state’s total employment.
Innovation
Across the core electronics related fields of research annual R&D expenditure in Victoria amounts to around $240 million, some 26% of total national expenditure.9 The largest field of
R&D activity in Victoria is communication technologies, which accounts for almost 70% of total electronics related expenditure in the State ($165 million).
By far the largest share of electronics R&D is conducted by the business sector, which accounts for around 93% of total R&D expenditure in these fields. By contrast, higher education accounts for just 6%, the Commonwealth Government for 1% and state and local governments for just 0.1%. The share of expenditure by the business sector is higher in Victoria than is the case nationally – emphasising the importance of policies focusing on enabling business-based R&D and forging linkages between it and R&D activity elsewhere.
The Victorian Electronics Cluster Survey
Some 2,400 electronics cluster firms were identified in Victoria, of which 23% were equipment producers, 15% components manufacturers, 10% engineers, 9% communications equipment producers, 9% were in lighting, 8% were IT producers, 6% were in security and 6% were
8 Including: electrical and electronics engineers, electronic engineering associate professionals,
electronic and office equipment tradespersons, communications tradespersons, and electrical and telecommunications trades assistants.
9 Including: electrical and electronic engineering, computer hardware and communications
machinery producers. Some 1,788 (75%) were located in cities and 409 (17%) were in rural locations. A large proportion of the electronics firms identified in Victoria are located in the eastern suburbs of Melbourne (Monash, Kingston, Whitehorse, etc.). Outside the Greater Melbourne area, Greater Geelong, Ballarat, Greater Bendigo and Wodonga are locations of significant electronics industry activity.
A questionnaire was sent to around 1,700 firms. Of those firms responding (N=98), 77% were headquartered in Melbourne and 15% in rural Victoria – there were four firms based elsewhere in Australia and four headquartered overseas.
Cluster characteristics and capabilities
Responding firms earned a total of $1.64 billion during 2002-03 – an average revenue of $17.7 million per firm, up from $7.3 million in 1998-99 or by 23% a year. Around 80% of their revenue was derived from operations in Victoria, with a further 11% from operations elsewhere in Australia and 9% from overseas.
The majority of revenue came from manufacturing their own products (37%). Wholesale and retail distribution (27%), service delivery (16%), support and after sales services (10%) and integrated systems and solutions (8%) made up the remainder. Most firms focus on relatively High Value/Low Volume activities, with product manufacturers more likely to do so than wholesale and retail distributors.
Responding firms employed around 3,100 people in 2003, of whom 2,650 (86%) were located in Victoria. They spent an average of $1.7 million on wages and salaries – suggesting an average salary in excess of $54,000 per annum. Forty-two per cent of the firms have formal education and training policies or procedures to allow employees to further their education and develop skills.
More than 80% of respondents identified skills shortages. Twenty-nine per cent of the skills shortages identified were for technical, professional and engineering skills, and 27% were for marketing and sales skills. Relatively fewer respondents were concerned about shortages of business, project management or people management skills. Concerns about possible future shortages also focused on professional and technical skills.
Most firms are financed privately, with 69% of reported financing coming from private equity, around 12% from a parent firm, 2% from public financing and 16% from debt financing. Only 1% of financing came from venture capitalist or business angel investments. Strong competition for local customers, access to capital and skilled staff, and concerns over the costs of regulatory compliance were the main barriers to growth.
Forty-one per cent reported suppling electronics manufacturers, 56% reported undertaking electronics manufacturing activities and 49% provide electronics related services.
• Among the main manufacturing production capabilities reported were: components, process and control equipment, power and battery, instrumentation, mobile and wireless, other telecommunication equipment, automotive, and cable, wire and optical fibre – suggesting local manufacturing strengths and capabilities in these areas.
• Major reported services activities included: repair and maintenance, installation, wholesale and retail, design, engineering and consulting.
Fifty-one per cent of respondents exported last year, with exports accounting for a high share of sales. The extensive use of distributors and of direct links to export customers demonstrates the importance of demand-side supply chain linkages. That almost 25% of exporting firms cited the use of internet and/or electronic delivery of their exports suggests an active adoption of new methods and a strong base capability for the development of global trading activities.
The electronics supply chain
Respondents reported on the activities of 269 suppliers and 263 customers. Fifty-six per cent of respondents’ suppliers were located in Victoria, 26% were located overseas and 16% were located elsewhere in Australia. The supply network is relatively concentrated, with the Top 3 suppliers accounting for between 14% and 98% of total supply costs. Materials and components accounted for more than 80% of all Top 3 supplier supplies by value. Machinery and equipment came a distant second, accounting for just 6%.
Fifty-one per cent of Top 3 customers were located within Victoria, with 33% located elsewhere in Australia and 15% located overseas. The Top 3 customers accounted for between 8% and 98% of sales for 80% of the respondents, while 20% reported that their Top 3 customers accounted for 100% of their sales revenue. Product manufacturers were the most likely to have customers overseas (24% of their Top 3 customers). Wholesale and retail distributors were the only firms to nominate a higher numbers of customers elsewhere in Australia than within Victoria. Not surprisingly, services providers reported a strong concentration on local customers.
By value of sales, government (20% of Top 3 customers’ average sales values), OEMs (16%), business and household end users (16%), and other public organizations (11%) were the major customer types reported by local firms.
Product system linkages, innovation and knowledge flows
Thirty-seven per cent of responding firms reported an involvement in some form of linkage with another company or organization (eg. a joint venture, alliance, partnering or cluster relationship). More than half the services firms reported such links, compared with just over one-third of the product manufacturers and almost one-third of the distributors.
reported. Product development was the second most widely cited purpose, accounting for 19% of the reported linkages.
Respondents said that 20% of their products and services (by sales revenue) had been introduced within the last year, and 57% within the last 4 years. Manufacturing and services firms had the highest proportion of revenue from products and services introduced within the last year (23%), followed by integrated systems and solutions providers (19%) and support and after sales services firms (17%).
When asked where they get information about new technical developments, respondents reported 443 sources – an average of 4.5 sources per firm (suggesting a relatively high ‘absorptive capacity’). External sources, such as professional or industry associations, professional publications and journals, trade and industry magazines, discussions at conferences and trade shows or at industry networking functions, dominated. The second most important group of sources was other firms along the supply chain (ie. suppliers and/or customers).
Respondents were also asked to rank the relative importance of the same sources of information and ideas for the introduction of new products or services. They reported 384 sources – an average of 3.9 per firm. Again, external and supply chain sources predominated, reflecting the importance of demanding customers and major suppliers as drivers of innovation through the supply chain and of external linkages throughout the electronics product system.
Two-thirds of respondents performed formal R&D last year, and they spent an average 14% of turnover doing so. Eighty-eight per cent of those conducting R&D did so in-house, 83% reported that it was conducted in Melbourne, 9% conducted their research elsewhere in Victoria, 5% conducted it elsewhere in Australia and just 2% conducted their R&D overseas. Firms rely primarily on internal resources to fund their R&D activities.
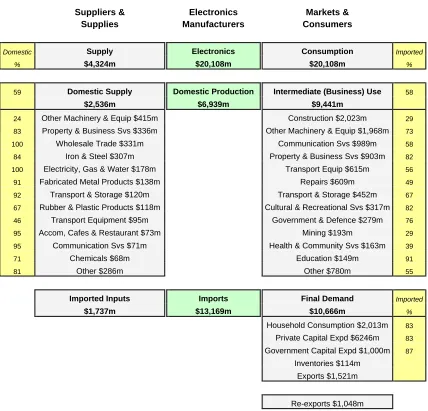
Mapping the Victorian Electronics Cluster
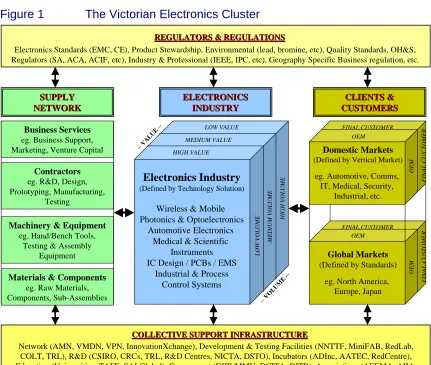
In mapping the Victorian Electronics Cluster we place electronics firms (defined by technologies, solutions and/or vertical markets) at the centre, their supply network to the left and clients, customers and markets to the right (Figure 1). These are all supported by a collective support infrastructure and operate within an overarching regulatory framework.
There are many forms of clusters and clustering. Clusters can be technology-based (eg. photonics), customer-based (eg. automotive), product-based (eg. smartcards), needs-based (eg. access to design skills) and/or resource-based (eg. energy or minerals resources). Clusters can also be characterised as:
• Verticalclusters, involving firms linked through buyer-seller relations;
• Horizontal clusters, involving firms that share a common end product market, use a common technology or science base, use common skills or require similar resources and conditions; or
In practice, clusters present a mixture of these things. All forms, as well as mixed forms, can be observed in the Victorian electronics industry.
Figure 1 The Victorian Electronics Cluster
Source: Centre for Strategic Economic Studies.
Capabilities and emerging opportunities
There are a number of key vertical markets into which Victorian-based electronics and related firms sell, and around which horizontal clusters form.10 These include:
• Automotive – with suppliers including: Robert Bosch, Siemens VDO, Australian Arrow, Denso International/Australian Automotive Air, Air International, AME Systems, Flexdrive Cables (mechanical and electronic instrumentation), PBR (Brakes), Hella Australia, Sumitomo (Connectors and Drives), etc. Automotive electronics manufacturing is a significant activity, it is experiencing growth in world markets and is an areas that is highly prospective for further local cluster development.
10 It should be noted that these lists are indicative and by no means exhaustive.
LOW VOLUME MEDIUM VOLUME HIGH VOLUME LOW VALUE MEDIUM VALUE HIGH VALUE Business Services
eg. Business Support, Marketing, Venture Capital
Electronics Standards (EMC, CE), Product Stewardship, Environmental (lead, bromine, etc), Quality Standards, OH&S, Regulators (SA, ACA, ACIF, etc), Industry & Professional (IEEE, IPC, etc), Geography Specific Business regulation, etc.
Contractors
eg. R&D, Design, Prototyping, Manufacturing,
Testing
Machinery & Equipment
eg. Hand/Bench Tools, Testing & Assembly
Equipment
Materials & Components
eg. Raw Materials, Components, Sub-Assemblies SUPPLY SUPPLY NETWORK NETWORK CLIENTS & CLIENTS & CUSTOMERS CUSTOMERS Global Markets
(Defined by Standards)
eg. North America, Europe, Japan
Domestic Markets (Defined by Vertical Market)
eg. Automotive, Comms, IT, Medical, Security,
Industrial, etc.
REGULATORS & REGULATIONS
REGULATORS & REGULATIONS
COLLECTIVE SUPPORT INFRASTRUCTURE
COLLECTIVE SUPPORT INFRASTRUCTURE
Network (AMN, VMDN, VPN, InnovationXchange), Development & Testing Facilities (NNTTF, MiniFAB, RedLab, COLT, TRL), R&D (CSIRO, CRCs, TRL, R&D Centres, NICTA, DSTO), Incubators (ADInc, AATEC, RedCentre), Education (Universities, TAFE, SAI Global), Government (DIIR/MMV, DCITA, DITR), Associations (AEEMA, AIIA,
ECAANZ, SMCBA), Transport & Logistics, Comms Infrastructure, etc.
OEM FINAL CUSTOMER OEM FINAL CUSTOMER ELECTRONICS ELECTRONICS INDUSTRY INDUSTRY Electronics Industry
(Defined by Technology Solution)
Wireless & Mobile Photonics & Optoelectronics
Automotive Electronics Medical & Scientific
Instruments IC Design / PCBs / EMS
• Communications and IT – with suppliers including: Siemens, NEC, Extel, Halipex, G&D, VPI Systems, Diamond Australia, RFS, CEOS, CommTel, InterCel, Cablex, Ipex (Volante), Aegis, Alfatron, etc. While it has been severely affected by the recent downturn in telecommunication investment worldwide, communications remains a significant area of opportunity for Victorian suppliers, and increasing build-to-order is bringing new opportunities for IT related assembly activities.
• Medical Devices – with suppliers including: GBC, Varian, Medtron, Vision Systems (BioSystems), Compumedics, Norwood Abby, etc. While relatively small and fragmented the medical and scientific devices area has a strong local user base in Victoria.
• Security – with suppliers including: Interlogix (GE Security), Inner Range, Nidac, ACD Digital, Vision Systems (Fire and Security), Intelligent Fire Systems, etc. Security is an area with strong growth potential in an era of heightened domestic and international security concern and increasingly demanding regulatory oversight of fire hazards.
• Industrial and Process Control – with suppliers including: ANCA, Datataker, IPC Global, Innovonics, Intermoco (Australon), Moonlighting, NeoProducts, Robotron, Traffic Technologies, Atco Controls, Schneider Electric, Bytecraft Automation, etc. Both industrial process control and instrumentation are areas of local strength and opportunity.
• Instrumentation – with suppliers including: Agilent Technologies, Gedge, Phasefale, Datataker, Hawk Measurement, Contrec, Kingfisher, Alfa-Tek, McVan, etc. Like industrial process control, instrumentation offers opportunities to develop and market local capabilities.
• Power Supplies– with suppliers including: Rectifier Technologies, Setec, Selectronic, Thycon, Thytec, Arlec, etc. There is a large and growing market for a wide range of power supplies, increasing focus on mobility, security and uninterruptible power supply. There is also growing interest in electric and hybrid vehicles, for which power supply technologies are crucial.
• Contract manufacturing and PCBs – with suppliers including: Precision Australia, AEMS, Labtam, Duet, Millison, Clevertronics, EDPM, Unique Micro Design, etc. The emerging trend for increased customisation and build-to-order promises to provide new opportunities for contract manufacturers.
The electronics industry reveals a complex interplay between technologies, applications and markets. Particular technologies can support a range of applications and feed into a number of vertical markets. In Victoria, wireless communications and photonics are among the leading examples of this phenomenon.
communications. This focus feeds through the entire value system, from ASIC designs, through the fabrication and integration of DSPs, etc.
Photonics has suffered from the recent downturn in telecommunication investment. Nevertheless, it remains a strong area of focus and activity in Victoria. Victoria's photonics cluster covers a number of areas that have considerable prospects for growth, including: communications, medical, bio-photonics and micro-photonics, defence, intelligent transport systems and security.
It will also be important to exploit the synergies of convergence in photonics, microelectronics and nanotechnology, and build on local strengths by fostering linkages between players in these areas.
Structure and structural change
The Victorian electronics industry structure can be represented as a pyramid. At the top are the multinationals with a strong base in Australia and linkages into global markets. In the centre are
Figure 2 The structure of the electronics industry
Source: Centre for Strategic Economic Studies.
a relatively small number of Australian SMEs. The base is made up of many hundreds of micro firms. Value is the inverse, with much of the sales and export value concentrated within the
Micro Enterprises
Australian
Small to Medium Enterprises
Multinationals
Number of Enterprises
small number of multinationals and the larger indigenous firms, and relatively little realised at the micro enterprise level (Figure 2). Consequently, there is a need to focus leverage where it is likely to be most effective, while creating linkages that suit all players, or can at least accommodate them.
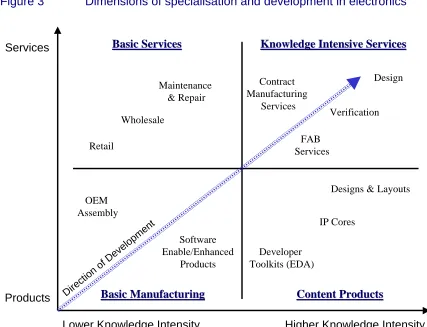
Networks and clusters
The evolution of the electronics industry can be seen as a fragmentation of the value chain, with separation of activities and increasing specialisation along a dimension running from basic manufacturing assembly to high-value, knowledge-intensive services (Figure 3). Integrated OEM design, verification, manufacturing, assembly, distribution, maintenance and repair is increasingly giving way to the fragmentation of these activities, and to firm and regional specialisation. Unable to compete with Asian locations on labour costs, and remote from major markets, Australia’s electronics industry must seek to maintain a position as a design and development ‘centre of gravity’ and/or focus on areas that are lower volume. To do so, Australia
Figure 3 Dimensions of specialisation and development in electronics
Source: Centre for Strategic Economic Studies.
must develop effective linkages between global markets and emergent high value services (eg. design and verification), IP-based products (eg. IP cores, designs and layouts) and lower volume products (eg. scientific and medical equipment, instrumentation and industrial process control),
Products
Lower Knowledge Intensity Higher Knowledge Intensity Services
Basic Manufacturing Basic Manufacturing
Basic Services Basic Services
Content Products Content Products Knowledge Intensive Services Knowledge Intensive Services
Retail
Wholesale
Maintenance & Repair
Contract Manufacturing
Services
FAB Services
Verification Design
IP Cores
Designs & Layouts
Developer Toolkits (EDA) OEM
Assembly
Direction of Development
Software Enable/Enhanced
and those linkages must take account of the very different scale and capabilities of major multinationals, local SMEs and micro services and content businesses.
Sometimes products can become so commoditised that they provoke the emergence of business models based on differentiation through customisation. One example is that of desktop PCs, which are increasingly being built-to-order. Coupled with local purchasing preferences in outsourcing contracts, this has led to the development of local (final) assembly of PCs and flexible customisation. There are now a surprisingly large number of local desktop PC assemblers in Australia. Most are small shop-front operations, but there are a handful of significant players (eg. Ipex (Volante), Optima, etc.). This suggests that fragmentation of the supply chain and commoditisation of products can come full-circle, bringing new opportunities for customised and contract assembly activities linked to distribution into local and readily accessible regional markets.
The size of the Australian market and of leading customers’ demand in local vertical markets acts as a limiter on the ability of local firms to specialise and achieve scale simultaneously. In most areas, demand in Australia does not support the level of capital expenditure, specialisation and scale required in order to thrive. Consolidation among the smaller players in the industry is likely to be necessary, with the formation of deep networks, clusters and alliances a partial alternative. Support for such networks, clusters and alliances is essential. Victoria’s microelectronics and photonics networks are a successful model for the creation of deeper horizontal linkages within the local industry. Perhaps the only danger lies in having too many such networks, thus limiting the de facto scale achievable and becoming too fragmented to generate the range of vertical and horizontal linkages required.
Shared infrastructure
The viability of local electronics SMEs and of local networks and clusters will depend, in part, upon access to shared infrastructure. In electronics, unlike other areas, both the equipment and the software for design are getting more expensive, not less. As a result, it is becoming more difficult for smaller firms to afford the latest capital equipment and to keep up with developments in design, development and production technology. Limited use testing and conformance related equipment and systems are also becoming prohibitively expensive for SMEs.
Locally in Victoria, there are a number of initiatives directed to this problem, and much progress has been made. Nevertheless, these initiatives require commitment and would benefit from further support. It might also be beneficial to learn from the experience of other fields, such as that of consortial purchasing and national site licensing of scientific and professional publications by universities and the CSIRO, and apply similar approaches and solutions to such areas as the consortial licensing of design software.
Lead projects
funding and there are many firms with innovative technologies and products, opportunities to participate in the development of solutions in lead projects are few and far between. Finding ways to support more lead/demonstration projects with deeper pockets and longer time horizons would be beneficial.
There are a number of areas of strength and promise that could benefit from the establishment of such projects. For example, it is apparent that remote monitoring and telemetry will be important in all sorts of applications and markets (eg. health monitoring of home-based patients). What is lacking is a lead project that facilitates the development of the devices needed and supports trials of them in the field, enabling clients, suppliers and researchers to work closely in translating technologies and supply capabilities into solutions.
There are also likely to be opportunities for the development of lead projects in e-science. The very nature of research is changing rapidly, due in part to the impacts of ICTs.11 There are a
number of major facilities (eg. Australian Synchrotron, Square Kilometre Array, etc.) and a number of network and grid initiatives (eg. AREN, GrangeNet, etc.) that could provide opportunities for the development and implementation of local electronics and related technologies.
Supply chain management
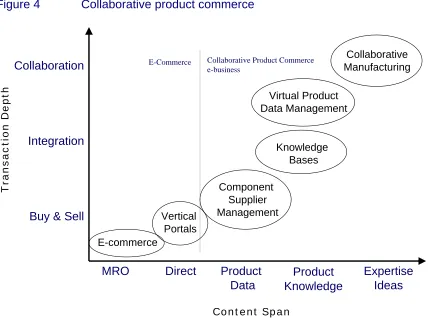
A common thread throughout analyses of the electronics industry is the need for deeper linkages, both vertically throughout the supply chain and horizontally between firms in particular markets. Collaboration and supply chain management, of a kind that goes beyond management of the supply network to support deep integration and collaboration, are crucial. Local partnering and the use of B2B e-marketplaces can be developed further, but there is also an emerging need for a shift from e-commerce (ie. electronic trading) to e-business (ie. using networked systems to manage and participate in collaborative production systems) (Figure 4).
Needs-based projects are generally more successful, and one possible approach to deepening product system collaboration would be to harness the demands for information exchange and collaboration created by emerging regulatory demands for ‘product stewardship’ and control of ‘materials of concern’. A lead project in the e-business collaboration space might involve embracing compliance demands and using them as the driver for the development and deployment of an integrated, shared knowledge management system, with suitable metadata and access management standards. Such a system might provide both the foundation for an infrastructure for greater vertical and horizontal collaboration within the industry and a process for collaborative project development and management that would be more widely applicable.
11 Houghton, J.W. Steele, C. and Henty, M. (2003) Changing Research Practices in the Digital
Figure 4 Collaborative product commerce
Source: Gartner Group. Cited by Waraniak, J. (2000) Driving Web-Enabled Market Efficiency, Federal Reserve Bank of Chicago, Detroit, MI.
Key issues
While there are many trends affecting the Victorian Electronics Cluster and many issues involved, preliminary analysis suggests a number of key points.
Structure
Firms in the local electronics industry are of three main types: multinational majors, Australian SMEs that are linked into markets and growing, and many micro businesses – some of which do not seek to grow their business, being what might be described as ‘lifestyle businesses’ rather than growth driven enterprises. This is not a criticism, but rather a call for recognition. Rather than lamenting a lack of hard-nosed entrepreneurialism, we should focus on adjusting policy approaches to the businesses we have.
The implications of this situation include: a need to focus on fostering SMEs and their links into global production systems; and a need for new policy approaches to the micro businesses (particularly the high knowledge–high value ones) that takes account of how they might better be mobilised and engaged in global production systems.
Collaboration
Integration
Buy & Sell
MRO Expertise
Ideas Direct Product
Data
Product Knowledge
Transaction Depth
Content Span E-commerce
Vertical Portals
Component Supplier Management
Knowledge Bases Virtual Product Data Management
Collaborative Manufacturing Collaborative Product Commerce
Structural change
There is increasing fragmentation of functions within the value chain and disbursement of production activities globally. This fragmentation is variously referred to as deverticalisation (ie. the decline of vertically integrated OEM production) and horizontal fragmentation. It is driven by outsourcing, facilitated by standardisation and is both a driver and consequence of globalisation.
The implications of this include: a greater need for supply chain management; moving e-commerce towards more deeply integrated e-business; enhanced ways of linking local producers into global production systems; and an increased focus on standards and on quality accreditation, prequalifying, etc. Enabling local electronics SMEs and micro businesses also depends, in part, upon access to shared infrastructure, such as design software, manufacturing, testing and conformance facilities, and upon enhanced IP management and access (eg. collective access to IP Cores, etc).
Innovation
A feature of fragmented supply systems is that they make innovation and learning difficult. Staying informed and in touch is vital.
The implications of this include: the need for increased attention to innovation and learning linkages around the system (eg. between R&D and educational institutions and SMEs); the importance of participating in R&D relationships, missions, etc.; the importance of value system linkages and close relations with buyers and suppliers, who are often important sources of ideas and demanding requirements that drive innovation; the importance of participation in the development of standards and standards monitoring; and the importance of quality management systems, accreditation, prequalification, etc. One widely noted ‘missing ingredient’ is a sufficient number of lead projects. The role of major local purchasers has changed, with fewer opportunities for high-profile, longer-term development projects. There is a need to find new ways to generate lead projects in areas in which there are opportunities to develop local technologies into market ready solutions.
Compliance
There are number of major compliance issues, including: materials of concern (eg. lead, bromine, etc.) and product stewardship issues, which are being pushed back up the supply chain to producers. It is not merely an add-on. Both materials of concern and product stewardship need to be designed in, making it a design and development issue too.
Local issues
There is also a range of more local issues, such as: skills and trade skills development, with widespread concern about shortages of trades and higher skills and the lack of training support; gaining and maintaining access to global production systems; the development of local firms within highly fragmented global production systems; a need to focus on the research, design and development end of the spectrum of industry activities; and how to effectively mobilise the many micro businesses and ‘lifestyle’ independents.
1 Introduction
Electronics is a key enabling technology which underpins developments in a range of industries, including: information technology, telecommunications, automotive and defence. Electronics also provides the foundation for a wide range of equipment and appliances which contribute to improvements in medical and scientific equipment, transport and logistics, measuring and mapping. In recognition of the importance of electronics to the Australian economy, the Commonwealth Government joined with the industry to launch the Electronics Industry Action Agenda in June 2003. The Australian Electrical & Electronic Manufacturers’ Association (AEEMA) was given the responsibility for coordinating the implementation of the Action Agenda, as a part of which AEEMA is coordinating state-based mapping of electronics industry activities and capabilities.
This report is based on a study undertaken by the Centre for Strategic Economic Studies (Victoria University) in Victoria. It aims to contribute to a better understanding of the entire electronics value chain – from the design and manufacture of components and inputs, to electronics manufacturing, through manufacturing and assembly, wholesale, retail, installation, maintenance and repair of electrical and electronic equipment.
Following a brief look at the electronics industry in Australia, this section presents an outline of the Electronics Industry Action Agenda and the approach used to cluster mapping, before outlining the purpose and aims of this study. Section 2 looks at electronics industry trends and futures, Section 3 looks at a range of statistical sources to paint a picture of the electronics manufacturing industry in Victoria, Section 4 reports findings from the survey of the Victorian Electronics Cluster undertaken for this study, and Section 5 explores capabilities and emerging opportunities. Readers wishing to focus on the Victorian survey and conclusions may wish to skip to Section 4.
1.1 The electronics industry in Australia
This section presents a brief overview of the electronics industry in Australia. It provides a backdrop to the subsequent description and analysis of the electronics industry cluster in Victoria.
1.1.1 Australia’s electronics industry employment and production
In 2000-01, the electronics manufacturing industry employed 34,745 people in Australia, realised turnover of $8.9 billion and contributed more than $2.5 billion to gross domestic product (GDP).12 Electronics accounted for 3.7% of all manufacturing employment and 3.5% of
12 Following the Electronics Industry Action Agenda, the electronics manufacturing industry is defined
manufacturing turnover and value added (Table 1.1). Over the period 1996-97 to 2000-01, employment in the industry grew by just 0.3% per annum, although wages and salaries increased by 6.5% per annum. Industry turnover increased by 2.0% per annum over the period, but value added declined by 1.4% per annum.
As at the end of June 2001, telecommunications, broadcasting and transceiving equipment manufacturing and electronic equipment manufacturing not elsewhere classified each accounted for around 25% of total employment – employing 9,114 and 8,928 people, respectively. Automotive electrical and instrument manufacturing employed 5,058 (15%), professional & scientific equipment manufacturing 4,548 (13%), computer and business equipment manufacturing 4,091 (12%) and electric cable and wire manufacturing 2,979 (9%) (Figure 1.1).
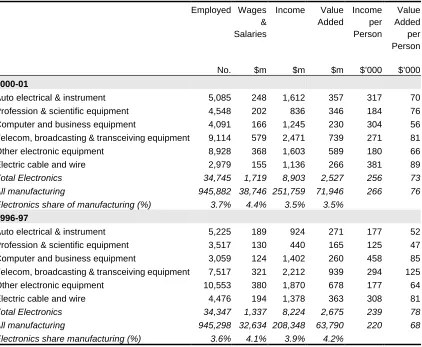
Table 1.1 The electronics industry in Australia, 1996-97 to 2000-01
Employed No. Wages & Salaries $m Income $m Value Added $m Income per Person $’000 Value Added per Person $’000 2000-01
Auto electrical & instrument 5,085 248 1,612 357 317 70 Profession & scientific equipment 4,548 202 836 346 184 76 Computer and business equipment 4,091 166 1,245 230 304 56 Telecom, broadcasting & transceiving equipment 9,114 579 2,471 739 271 81 Other electronic equipment 8,928 368 1,603 589 180 66
Electric cable and wire 2,979 155 1,136 266 381 89
Total Electronics 34,745 1,719 8,903 2,527 256 73
All manufacturing 945,882 38,746 251,759 71,946 266 76
Electronics share of manufacturing (%) 3.7% 4.4% 3.5% 3.5%
1996-97
Auto electrical & instrument 5,225 189 924 271 177 52 Profession & scientific equipment 3,517 130 440 165 125 47 Computer and business equipment 3,059 124 1,402 260 458 85 Telecom, broadcasting & transceiving equipment 7,517 321 2,212 939 294 125 Other electronic equipment 10,553 380 1,870 678 177 64
Electric cable and wire 4,476 194 1,378 363 308 81
Total Electronics 34,347 1,337 8,224 2,675 239 78
All manufacturing 945,298 32,634 208,348 63,790 220 68
Electronics share manufacturing (%) 3.6% 4.1% 3.9% 4.2%
Note: All values are current prices.
Source: ABS (various years) Manufacturing Industry: Australia, Cat No 8221.0. CSES Analysis.
Since the mid 1990s there have been mixed employment trends among electronics industry sectors. Strong employment growth in computer and business equipment manufacturing (7.5%
pa), profession and scientific equipment manufacturing (6.6% pa) and telecommunication, broadcasting and transceiving equipment manufacturing (4.9% pa) has been balanced against falls in other areas – including an almost 10% per annum decline in employment in electric cable and wire manufacturing.
Figure 1.1 Employment in electronics manufacturing in Australia, 2000-01
(per cent share)
Source: ABS, CSES Analysis.
Total electronics manufacturing industryvalue added amounted to $2.53 billion during 2000-01, and accounted for 3.5% of total manufacturing industry value added in Australia. Telecommunications, broadcasting and transceiving equipment manufacturing accounted for 29% ($739 million), electronic equipment manufacturing not elsewhere classified accounted for 23% ($589 million), automotive electrical and instrument manufacturing and professional and scientific equipment manufacturing each accounted for around 14% ($350 million), electric cable and wire manufacturing accounted for 11% ($266 million) and computer and business equipment manufacturing accounted for 9% ($230 million) (Figure 1.2).
Over the period 1996-97 to 2000-01, electronics manufacturing industry value added declined by 1.4% per annum overall (in current prices). However, there were marked differences between sectors. Industry value added increased by 20.4% per annum in professional and scientific equipment manufacturing and 7.1% per annum in automotive electrical and instrument manufacturing, while declining 7.5% per annum in electric cable and wire manufacturing and 5.8% per annum in telecommunications, broadcasting and transceiving equipment manufacturing. Value added per person employed increased by 12.9% per annum in professional and scientific equipment manufacturing and by 7.8% per annum in automotive
Auto electrical & instrument 15%
Profession & scientific equipment
13%
Computer and business equipment
12%
Telecommunication, broadcasting & transceiving
equipment 25% Other electronic equipment
26%
electrical and instrument manufacturing, while declining 10.2% per annum in telecommunications, broadcasting and transceiving equipment manufacturing and by 9.8% per annum in computer and business equipment manufacturing.
Figure 1.2 Electronics manufacturing industry value added in Australia,
2000-01 (per cent share)
Source: ABS, CSES Analysis.
Australia accounts for around 0.3% of worldwide electronics production, with somewhat higher shares of telecommunication and radiocommunication, and control and instrument production. These higher shares of world production are reflected in overall equipment category shares and suggest local strengths in control and instrumentation equipment and communications equipment. Conversely, Australia’s production of electronic components is lower than its overall average.
1.1.2 Australia’s electronics equipment trade
Australia accounts for around 0.3% of world electronics exports and 1.4% of world imports. In 1997, exports of these categories of electronics equipment realised just less than USD 2 billion, while imports cost more than USD 8.8 billion, leaving a deficit on trade of almost USD 7 billion. In 1997, EDP equipment accounted for more than 50% of Australia’s electronics exports and communication equipment accounted for more than 30% – compared with 37% and 14%, respectively, worldwide. Conversely, components accounted for 11% of Australia’s electronics exports compared with 38% worldwide.
Auto electrical & instrument 14%
Profession & scientific equipment
14%
Computer and business equipment
9%
Telecommunication, broadcasting & transceiving
equipment 29% Other electronic equipment
23%
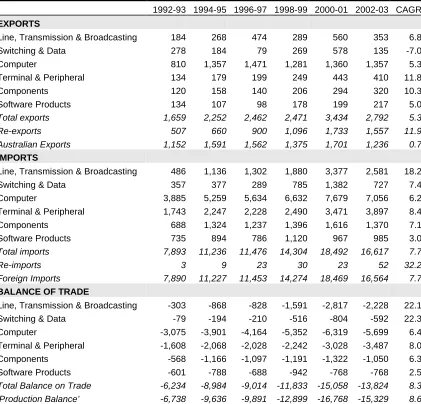
Looking in more detail at more recent data on trade in ICT and related equipment, we find that Australia achieved exports of $2.8 billion during 2002-03, with imports costing almost $16.6 billion leaving a deficit on trade of $13.8 billion (Table 1.2).13 Re-exports (things brought into
Australia and re-exported with little or no value added) account for a large and growing share of Australia’s ICT related equipment exports – almost $1.6 billion or 56% of total equipment exports during 2002-03. Comparing locally produced exports and re-exports by category reveals
Table 1.2 ICT equipment trade 1992-93 to 2002-03 (AUD millions)
1992-93 1994-95 1996-97 1998-99 2000-01 2002-03 CAGR
EXPORTS
Line, Transmission & Broadcasting 184 268 474 289 560 353 6.8
Switching & Data 278 184 79 269 578 135 -7.0
Computer 810 1,357 1,471 1,281 1,360 1,357 5.3
Terminal & Peripheral 134 179 199 249 443 410 11.8
Components 120 158 140 206 294 320 10.3
Software Products 134 107 98 178 199 217 5.0
Total exports 1,659 2,252 2,462 2,471 3,434 2,792 5.3
Re-exports 507 660 900 1,096 1,733 1,557 11.9
Australian Exports 1,152 1,591 1,562 1,375 1,701 1,236 0.7
IMPORTS
Line, Transmission & Broadcasting 486 1,136 1,302 1,880 3,377 2,581 18.2
Switching & Data 357 377 289 785 1,382 727 7.4
Computer 3,885 5,259 5,634 6,632 7,679 7,056 6.2
Terminal & Peripheral 1,743 2,247 2,228 2,490 3,471 3,897 8.4
Components 688 1,324 1,237 1,396 1,616 1,370 7.1
Software Products 735 894 786 1,120 967 985 3.0
Total imports 7,893 11,236 11,476 14,304 18,492 16,617 7.7
Re-imports 3 9 23 30 23 52 32.2
Foreign Imports 7,890 11,227 11,453 14,274 18,469 16,564 7.7
BALANCE OF TRADE
Line, Transmission & Broadcasting -303 -868 -828 -1,591 -2,817 -2,228 22.1 Switching & Data -79 -194 -210 -516 -804 -592 22.3 Computer -3,075 -3,901 -4,164 -5,352 -6,319 -5,699 6.4 Terminal & Peripheral -1,608 -2,068 -2,028 -2,242 -3,028 -3,487 8.0 Components -568 -1,166 -1,097 -1,191 -1,322 -1,050 6.3
Software Products -601 -788 -688 -942 -768 -768 2.5
Total Balance on Trade -6,234 -8,984 -9,014 -11,833 -15,058 -13,824 8.3
‘Production Balance’ -6,738 -9,636 -9,891 -12,899 -16,768 -15,329 8.6
Notes: CAGR is Compund Annual Growth Rate. ‘Production Balance’ is the difference between domestically produced exports and foreign produced imports.
Source: TradeData (http://www.tradedata.net) and Houghton, J.W. (2003) Australian ICT Trade Update 2003, Australian Computer Society and Centre for Strategic Economic Studies, Sydney and Melbourne. Available http://www.cfses.com.
13 For a detailed analysis of ICT related electronics equipment trade see Houghton, J.W. (2003)