Estimating the value and impact of
Nectar Virtual Laboratories
Report to Nectar
Dr Kim Sweeny
Dr Masha Fridman
Professor Bruce Rasmussen
Victoria Institute of Strategic Economic Studies
Victoria University
1
Contents
1. Introduction
2
2. The Nectar project
3
3. Methodology
7
4. The Virtual Laboratories
13
4.1 Biodiversity and Climate Change Virtual Laboratory
13
4.2. Characterisation Virtual Laboratory
15
4.3 Genomics Virtual Laboratory
16
4.4. Humanities Networked Infrastructure
18
5. Data on usage of Nectar Virtual Laboratories
23
6. Estimating the value and impact of Nectar Virtual Laboratories
26
7. Further assessment of the value and impact of the
Characterisation Virtual Laboratory
35
8. Qualitative valuation of Nectar Virtual Laboratories
39
9. Summary and conclusions
47
References
49
Appendices
53
1.
Virtual Laboratories funded by Nectar
53
2
1. Introduction
In 2016 the Victoria Institute of Strategic Economic Studies (VISES) at Victoria University was commissioned by the National eResearch Collaboration Tools and Resources project
(Nectar) to estimate the value and impact of Nectar Virtual Laboratories (VLs). Nectar provides an online infrastructure that supports researchers to connect with
colleagues in Australia and around the world, allowing them to collaborate and share ideas and research outcomes, which will ultimately contribute to our collective knowledge and make a significant impact on our society.
It provides support for a network of 14 VLs which are domain-oriented online environments that draw together research data, models, analysis tools and workflows to support
collaborative research across institutional and discipline boundaries.
Given the resources available and the central role of VLs in the Nectar project, it was agreed that the most appropriate approach to estimating the value and impact of Nectar was to concentrate on estimating the value and impact of 4 VLs, namely
• Biodiversity and Climate Change Virtual Laboratory (BCCVL)
• Characterisation Virtual Laboratory (CVL)
• Genomics Virtual Laboratory (GVL), and
• Humanities Networked Infrastructure (HuNI)
Most VLs funded by Nectar have only been active for a few years and are still in their growth stages. An evaluation of their overall impact and value might best be done from the
perspective of some years in the future when the VLs are in a more mature growth phase. Therefore the analysis and conclusions drawn in this study should be treated as preliminary and depend significantly on the assumptions made about future growth paths.
3
2. The Nectar project
Nectar has its origins in Commonwealth government initiatives to support national research infrastructure. The National Collaborative Research Infrastructure Strategy (NCRIS) was established by the Commonwealth Government in 2004 and currently provides funding for 27 active projects across 222 institutions employing over 1700 technical experts,
researchers and facility managers. NCRIS facilities are used by over 35,000 researchers, both domestically and internationally and also attract funding from organisations in the higher education, government, non-profit and industry sectors (Department of Education 2017). Since its establishment there have been a number of reviews and roadmaps of the NCRIS program.
The Strategic Roadmap for Australian Research Infrastructure, released in August 2008, updated a similar roadmap in 2006 but placed increased emphasis on eResearch
“in recognition of the pervasive and underpinning relevance of ICT to research. As collaborative research increases, eResearch is providing the most influential and effective way of enabling institutions to work together, using shared infrastructure, resources and policies.”1
In its 2009/10 Budget the Australian Government announced a Super Science Initiative to further support research infrastructure by addressing the priorities identified in the 2008 Strategic Roadmap. The Super Science Initiative was financed through the Education
Investment Fund. Nectar was established in 2009 by the Australian Government following a 2009/10 Budget announcement of $47 million to support Nectar as part of the Super Science initiative financed by the Education Investment Fund (EIF), and subsequently
received NCRIS funding. Nectar has received $61 million in government funding, matched by co-investment of $54 million from Australian universities and research organisations
The University of Melbourne is the lead agent for the administration of Nectar. Governance of Nectar is provided by the Nectar Project Board, chaired by Russell Yardley, with 9 other members drawn from participating research institutions.
The Nectar directorate comprises the equivalent of 6.5 full-time staff and is led by the Director, Associate Professor Glenn Moloney.
1 The roadmap further states that “ a new capability in the Humanities, Arts and Social Sciences
4
Nectar is an example of a science gateway which Shahand (2015) defines as a “web-based enterprise information systems that provide scientists with customized and easy access to community-specific data collections, computational tools and collaborative services on e-Infrastructures.”
A recent review of science gateways (Barker et al 2017) describes their benefits as follows. Science gateways are a key component of the future digital research environment, enabling researchers to utilize a global network of interacting digital platforms to access and share the leading-edge data and tools that are critical for their research. They both facilitate, and are supported by, broader movements such as open research, open science, open source software and open data. Consequently, science gateways are valuable to a range of stakeholders: individual researchers, research communities, research organizations and institutions (including industry and government) and funding agencies.
Defining science gateways in terms of common characteristics and functionality assists in identifying their value to their stakeholders. Science gateways lower barriers by hiding the complexity of the underlying digital research infrastructure and simplifying access to best-practice tools, data and resources, thereby democratizing their usage. They can enable collaboration and build communities, sharing data and analyses among multidisciplinary and geographically dispersed research groups, leading to increased openness. They can enable research to be undertaken more efficiently through the provision of modelling and other software and hardware resources through a single portal, and enable research to be undertaken that would not otherwise be conducted. Researchers no longer need to be physically co-located because resources can be globally distributed, and this also enables inclusion of less advantaged researchers/institutions. By sharing resources across multiple institutions, the costs of setting up and supporting research infrastructure is lowered, as each institution is no longer required to support a replica of data, compute and tools at their site. For gateways that are open source, their very building and evolution can be democratized. Any community member can download and use code and also contribute features, for example, via git pull requests.
Nectar provides the majority of its funding through two main investment programs in e-research infrastructure:
• Virtual Laboratories
5
Virtual Laboratories
Nectar VLs are rich domain-oriented online environments that draw together research data, models, analysis tools and workflows to support collaborative research across institutional and discipline boundaries. They are built and led by the Australian research sector and are used nationally and internationally by the research community and other stakeholders, including industry.
Data analysis is increasingly an essential aspect of research in most academic disciplines, with large amounts of data requiring more storage and computing power than most desktop environments can provide. Virtual Laboratories can provide High Performance Computing (HPC) resources to analyse and store such data and provide training in advanced analytical methods needed to analyse large datasets.
Nectar VLs are hosted on remote servers and are accessible remotely, via the internet. Researchers no longer need to be physically co-located: any resources, including people, can be globally distributed. All that is needed is an internet connection for access to
collaborators, data, computational and analytical tools.
Remote access to research resources increases the efficiency of research and expands its impact. The cost of HPC infrastructure can be shared – it no longer needs not be replicated in every research facility that requires it. The savings include costly upgrades that are needed every few years to maintain HPC. The VLs platform is well suited for delivering training in advanced analytical methods to update analytical skills and to train a new generation of researchers. Furthermore, VLs provide a platform for collaboration, enabling researchers to share ideas and research outcomes with colleagues in Australia and around the world, across institutional and discipline boundaries, ultimately expanding to our collective knowledge.
Once Nectar was established it initiated two Requests for Proposals for VLs in September 2010 and April 2012. Contracts with the institutions that proposed the successful VLs were signed from May 2012 to January2013.
Virtual Laboratories funded under Nectar recorded over 19,000 users in 2017 across 12 VLs, including, on average, users from over 20 international organizations and 30 Australian organizations (Barker et al 2017).
A complete list of VLs is given in Appendix 1.
Since their inception, access to the VLs and other services funded by Nectar has been free to users.
6
Table 2.1 Funding for four VLs to 2016-17, $
BCCVL CVL GVL HUNI
Nectar cash
to 2013-14 1,236,063 1,618,108 2,334,121 1,329,000
2014-15 220,000 320,000 445,000 193,000
2015-16 230,000 225,000 230,000 192,500
2016-17 177,000 177,000 177,000 120,000
Total 1,863,063 2,340,108 3,186,121 1,834,500
Partners
Cash 600,000
In-kind 1,315,971 1,836,740 2,917,707 2,500,000
Total 3,779,034 4,176,848 6,103,828 4,334,500
Nectar Cloud
Nectar Cloud provides computing infrastructure, software and services that allow Australia’s research community to store, access, and run data, remotely, rapidly and autonomously. Nectar Cloud’s self-service structure allows users to access their own data at any time and collaborate with others from their desktop in a fast and efficient way.
The Nectar Research Cloud is a single national cloud computing infrastructure, comprised of seven collaborating “nodes”. Nodes procure hardware necessary for running the cloud compute, storage and network services.
7
3. Methodology
3.1 Approaches to estimating value and impact
The assessment of programs such as Nectar VLs, which provide free access to a range of web-based information technology databases, analysis software, training and other services, is a relatively new field and investigators have used a variety of approaches to estimate the value and impacts of these programs.
In a recent study of the value and impact of the European Bioinformatics Institute (EBI), a centre for research and services in bioinformatics, which is part of European Molecular Biology Laboratory (EMBL)., Beagrie and Houghton (2016) review the approaches taken by studies of science facilities. They note that most of these are of large scale infrastructure facilities such as synchrotrons, and only a few of data repositories and related infrastructure and services. They quote a review of studies by the group EvaRIO (Evaluation of Research Infrastructures in Open innovation and research systems) (2013) which found that cost-benefit analysis and techniques for estimating the return on R&D expenditure were relatively rare in the estimation of the value and impact of science facilities.
Beagrie and Houghton (2016) found that three main types of analysis were used in these studies: various forms of input-output analysis, case studies and examples, and forms of cost-benefit analysis using activity costing and/or contingent valuation as the basis of the analysis.
Input-output analysis is best suited to analysis of single site facilities such as a synchrotron while cases studies are limited in the extent to which the results can be scaled up or generalised.
Beagrie and Houghton therefore use a mixed method approach to cost-benefit analysis drawing upon their experience valuing a range of data services such as the National Crystallography Service at Southampton University and the UK Data Archive at the
8
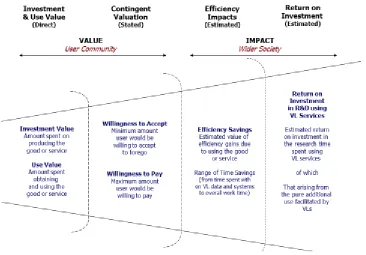
Following these authors we have approached the task of measuring the value and impact of Nectar VLs in a number of ways.
These are shown in Figure 3.1. As with most large science facilities, the VLs provides value both to the user and to the wider society. The VLs provide a service to a community of researchers which can be valued in a several ways. These are discussed in more detail below but one is given by the value of the time spent using the service and another, a contingent valuation, is an estimate of its market value i.e. the value a user would place on the service if it was offered in the market place. In measuring the contribution to GDP, services with no market value, are often simply included at cost. However even where there is no monetary transaction it is possible to estimate a ‘market’ value of a service to a consumer. This market value is, the amount the consumer would either be willing to pay (WTP) to use it or accept (WTA) not to use it.
Figure 3.1 Impact valuation methodologies
Source: Beagrie, N. & Houghton, J.W. (2016) The Value and Impact of the European Bioinformatics Institute (www.beagrie.com/publications).
This willingness to pay or accept derives from the efficiency gains either from using the VL, or forgone from not using it, respectively. These efficiency gains can be separately
estimated from data collected from VL users and provides a credibility check on the WTP and WTA estimates.
9
from new innovative products sourced in part at least from the benefits gained from using the VLs.
1. Investment and use value
The investment value of a product is the amount of resources spent on its production and delivery. The use value on the other hand is the amount of resources spent by users on obtaining and using the product. Measures of the amount of time and money used by Nectar VL users in accessing and using the VL services is an indicator of the minimum amount that the service is worth to them.
Information about the resources involved in the discovery, access, and use of Nectar VL services can be obtained by user surveys and interviews.
2. Contingent valuation
Contingent valuation involves the assignment of monetary values to non-market goods and services based on preferences (i.e., Preference Theory). It is often used in the valuation of environmental and other assets, the services of which, in contrast to goods and services traded in the market place, are provided free or at nominal prices to users.
The usual measure of economic activity is Gross Domestic Product (GDP). This provides an aggregate value of goods and services traded in the market place in currency units. The value of these transactions is largely established through a price settled by demand and supply outcomes. However, there are widely acknowledged shortcomings with GDP as a measure of economic value (Stiglitz Commission 2008). One is measuring the value of services.
Services, particularly those provided by the public sector, are often included at cost because there is no direct demand and supply interaction between buyers and sellers. In economic terms, there is no mechanism whereby the consumer is able to reveal her preferences of how much she would be willing to buy at a particular price. This often means that services are undervalued in estimating GDP, because the users would be willing to pay significantly more than the cost of production if they were given that opportunity. This is likely to be the case for the Nectar virtual labs.
The value of the services provided by the VLs will be included in GDP largely based on the salary costs of operating the labs, when in fact; the value placed on the services by users may be significantly greater. The contingent valuation methodology provides one way of estimating this value.
10
preferred good or service. Where preferences are not revealed in the market, individuals can be asked what they would be willing to pay for, or to accept in return for being without, the good or service in a hypothetical market situation (i.e., stated preference). For a public good, the value is the sum of “willingnesses”, as consumption is non-rivalrous (i.e., the same information can be consumed many times). The key difference between willingness to pay and willingness to accept is that the former is constrained by ability to pay (typically by disposable income), whereas the latter is not. Hence, willingness to pay directly measures the demand curve with a budgetary constraint, while willingness to accept measures the demand curve without a budgetary constraint (British Library 2004).
The contingent valuation approach involves asking what people would be willing to pay (to receive a benefit or remove a cost) or accept (to forgo a benefit or in compensation for a cost) if a market existed for the external effect. (Commonwealth of Australia 2006) 3. Efficiency impacts
Wider benefits and impacts can be explored by looking at the efficiency gains enjoyed by users and assigning an economic value to them, such as the value of time savings
(productivity), and the avoidance of costs for users that would otherwise be involved in the creation/collection of the data for themselves or obtaining it elsewhere. For this we
combine user survey questions about perceived efficiency impacts with activity costing. 4. Return on investment
There have been a number of studies both in Australia and overseas that have attempted to measure the returns to both public and private investment in research and development, and the contribution that R&D and technology development more broadly have made to economic growth.
The Productivity Commission has undertaken a number of large studies on the role of R&D in Australia (e.g. Industry Commission 1995, Shanks and Zheng 2006).
An analysis of the returns to health R&D by Access Economics (2008) found that health R&D provides returns to Australia of 117% per annum, with a benefit-cost ratio of 2.17. In an extension of this study in 2014. Deloitte Access Economics (2014) found that every dollar invested by the Medical Research Future Fund would generate returns of $3.39 in future health and productivity gains.
11
These and other studies of have consistently found large returns to investment in both public and private research and development.
Balanced Value Impact Model
In our discussions with the 4 VLs that are the focus of this study both HuNI and the GVL drew our attention to the Balanced Value Impact Model which is an evaluation schema developed by Professor Simon Tanner of King’s College London (Tanner 2012). This publication is a manual for users to undertake these evaluations and the methodology is complex. From a brief review of the literature it does not appear to have been implemented fully in any evaluation to date.
We discuss the Balanced Value Impact Model in more detail in Section 7 below.
3.2 Survey data
Most of the approaches outlined above depend on how users use VL services and the value that can be put on this use.
A major limitation experienced with studies of the value and impact of research
infrastructure such as Nectar VLs is the paucity of data relevant to the approaches outlined in the previous section. When commenting on these studies Beagrie and Houghton (2016) noted the variability of research infrastructure metrics and the implications for economic analysis and quoted from their review (Beagrie and Houghton 2014) as follows
It is also clear from these studies that different data centres collect financial and operational data, such as user statistics, data deposit, access and download statistics, to varying levels of detail and using different definitions. More guidance is needed on the collection of such data. Doing so would help to ensure a greater degree of
standardisation of operational records across data centres. This would be of greatest benefit to funders investing in a range of data centres, and would provide more comprehensive and reliable data for economic analysis. There would be considerable advantage to providing guidance regarding the collection of such data as it is
fundamental to the economic analysis and in making the business or funding case.
Funders will need to ensure allowance is made in budgets to enable such centres to collect adequate information so that proper evaluations can be undertaken.
To address the potential limitations of usage data collected by Nectar VLs, and to provide data relevant to the approaches outlined above, an online survey questionnaire was developed to measure aspects of the user experience with VLs using the Qualtrics on-line software tool. (https://www.qualtrics.com/homepage/)
12
developed by VISES and discussed with key Nectar and VL personnel. They were then refined iteratively over a number of discussion cycles and pilot tested.
13
4. The Virtual Laboratories
4.1 Biodiversity and Climate Change Virtual Laboratory (BCCVL)
The Biodiversity and Climate Change Virtual Laboratory was formed under an agreement in November 2012 between Nectar and Griffith University. The other main partners in BCCVL are
• James Cook University
• University of New South Wales
• Macquarie University
• University of Canberra
• Atlas of Living Australia (ALA), an e-infrastructure funded by NCRIS
• Terrestrial Ecosystem Research Network (TERN), a national observatory for
Australian ecosystems, delivering data streams that enable environmental research and management, with funding from NCRIS
• Queensland Cyber Infrastructure Foundation (QCIF) a HPC consortium of Queensland universities
Under the agreement, Nectar has provided funding of $1,863,063 to 2016-17and partners have committed to $600,000 in cash and $1,315,971 in-kind. The BCCVL web site was launched in August 2014.
The BCCVL project team of 8 people is located at Griffith University and headed by Mr Hamish Holewa. It has a Steering Committee of 17 people drawn from participating institutions and Nectar, as well as an Ecological Modelling Scientific Advisory Group of 8 people.
The Biodiversity and Climate Change Virtual Laboratory (BCCVL) is a “one stop modelling shop” that simplifies the process of biodiversity-climate change modelling. Its mission is to connect the research community to Australia’s national computation infrastructure by integrating a suite of tools in a coherent online environment where researchers can access data and perform data analysis and modelling.
Previously, the lines of inquiry into biodiversity and climate change impacts were stymied due to researchers’ inability to access a standardised set of tools for analysis and requisite data sources, and computational limitations.
The goal of the BCCVL is to integrate these tools and datasets with high-performance
14
Central to the modelling facilitated by BCCVL is species distribution modelling, alternatively known as environmental niche modelling, (ecological) niche modelling, predictive habitat distribution modelling, or climate envelope modelling. It refers to the process of using computer algorithms to predict the distribution of species in geographic space on the basis of a mathematical representation of their known distribution in environmental space (= realised ecological niche). The environment is in most cases represented by climate data (such as temperature, and precipitation), but other variables such as soil type, water depth, and land cover can also be used. These models allow for interpolating between a limited number of species occurrence and they are used in several research areas in conservation biology, ecology and evolution.
Developing a species distribution model begins with observations of species occurrences: these are places where we know a species has been found. These occurrences are mostly point-based and come from sources such as museum records and observations of experts in the field. BCCVL users can upload their own species distribution data or access one or more of the many datasets provided by BCCVL.
To calibrate a correlative species distribution model two types of input data are needed: species occurrences, and measurements of a suite of environmental variables, such as temperature and rainfall. These two types of data are then put into an algorithm to find associations between the known occurrences of a species and the environmental conditions at those sites, to identify the environmental conditions that are suitable for a species to survive. This provides information about where species occur and something about the environmental conditions of those places. The algorithm uses these two types of
information to estimate the probability of a species occurring in a place as some function of the environmental conditions of that place.
BCCVL currently supports 17 different types of species distribution algorithms.
BCCVL also offers a range of climate change models that can be used in conjunction with species distribution modelling to estimate the impact of climate change on species distribution.
The BCCVL web site offers a Knowledge Base which can guide users through the modelling process by providing information about the steps involved in modelling and the databases and other resources available.
The web site also offers a training course of 10 modules explaining SDM, the choice of algorithms and how to interpret modelling results.
15
change impacts, biology, flora and fauna, animal behaviour, planning and development, and conservation.
4.2 Characterisation Virtual Laboratory (CVL)
The Characterisation Virtual Laboratory (CVL) was formed under an agreement in May 2012 between Nectar and Monash University. Founding partners in CVL are
• Australian Microscopy and Microanalysis Research Facility
• Australian Nuclear Science and Technology Organisation
• Australian Synchrotron
• National Imaging Facility
• Australian National University
• University of Sydney
• University of Queensland
Through its life, a number of project partners have joined the CVL and engaged directly through project funding:
• CSIRO
• Deakin University
• Intersect, and its partners
• QCIF, and its partners
• RMIT
• The Pawsey Supercomputing Centre
• The Terrestrial Ecosystem Research Network
• University of Melbourne
• University of New South Wales
• University of Western Australia
• VicNode, and its partners
Under the agreement, Nectar has provided funding of $2,340,108 to 2016-17 and partners have committed to $1,836,740 in-kind.
The CVL web site was launched in March 2013.
The predominant practise of the CVL project is to work with instrument facilities to provide data capture, analysis and visualisation services and thereby underpin the facility user community.
16
The Characterisation Virtual Laboratory (CVL) aims to integrate Australia’s imaging equipment with specialised High Performance Computing capabilities and with data collection nodes and provide scientists with a common environment for analysis and collaboration. It initially developed four research application (‘drivers’) in multi-modal or large-scale imaging in neuroscience, structural biology, atom probe and X-ray science, and through partnership, this has been extended to cytometry, neutron-beam imaging, light microscopy, and bioinformatics.
Each driver is led by a world-class research group, is supported by an Australian research consortium and is in a national research priority area. The results from this development are distributed to the community through CVL “Workbenches”.
CVL users have the option of using the computing resources on the Nectar research cloud or accessing MASSIVE (Multi-modal Australian ScienceS Imaging and Visualisation
Environment) the HPC facility joint venture between Monash University, CSIRO and the Australian Synchrotron
An important role for CVL has been to establish the capability within imaging sites for
automatic capture and storage of imaging data to the cloud. This enables users to be able to access their imaging data through the CVL web site and to perform analysis using the
software tools provided by CVL based around the MyTardis and Store.Monash tools (Ceguerra et al 2013).
CVL has developed a number of applications that are reused across a range of Australian facilities. These include: extensions to the MyTardis data management platform to support instrument facilities; an instrument integration app, called MyData to make integration quicker, simpler and less reliant on specialist IT support; and Strudel, a tool that makes accessing remote analysis environments easier.
4.3 Genomics Virtual Laboratory (GVL)
The Genomics Virtual Laboratory was formed under an agreement in May 2012 between Nectar and the University of Queensland. The other main partner in GVL is the University of Melbourne. The following organisations are partners or collaborators with GVL
• The University of Queensland
• QFAB Bioinformatics
• Queensland Cyber Infrastructure Foundation
• Melbourne Bioinformatics (formerly Victorian Life Sciences Computation Initiative) Victorian eResearch Strategic Initiative
• The University of Melbourne
• Baker IDI Heart and Diabetes Institute
17
• The Garvan Institute of Medical Research
• Victor Chang Cardiac Research Institute
• CSIRO
• Bioplatforms Australia
• Monash University
• The University of Sydney
• The University of Western Australia
• Australian Bioinformatics Network
• EMBL Australia
• Australian Genome Research Facility
• Australian National Data Service
Under the agreement, Nectar has provided funding of $3,186,121 to 2016-17 and partners have committed to $2,917,707 in-kind.
The GVL is administered by Melbourne Bioinformatics. It has a staff of 8 led by Associate Prof Andrew Lonie, as Director of Melbourne Bioinformatics.
The Genomics Virtual Laboratory provides a cloud-based suite of genomics analysis tools for life science research and training.
Biologists without computer science training can go straight to a user-friendly platform which hosts a suite of tested bioinformatics tools and pipelines for fast, consistent, data analysis. The platform is constantly updated to have the latest features in use by expert bioinformaticians. Adopted both locally and overseas, the GVL has already been recognised as a quality platform to help address the shortage of bioinformatics expertise around the world and manage the complex, multiple-layered data analysis tasks confronting life scientists today.
Nationally and internationally it is being used both by life scientists working with genomic data and academics teaching bioinformatics at undergraduate and post-graduate levels. Life scientists without access to bioinformatics expertise are the primary users of the GVL. Practising bioinformaticians who know how to find the right tool for the data analysis job, find that the GVL is working for them in other ways. Small bioinformatics groups or lone practitioners use the GVL to train their local teams to do their own simple bioinformatics tasks on the GVL, freeing up capacity to work on more complex research problems or to collaborate more broadly.
18
Users of GVL have the option of launching their own private server on a public or private cloud, with the GVL pre-installed, or accessing it through one of the public GVL services on the GVL web site managed by GVL. Most users without relevant IT skills use one of three main public services namely
• Galaxy Melbourne
• Galaxy Queensland
• Galaxy Tut
Galaxy Tut is used for training purposes. As well, the GVL provides on-line basic and advanced Galaxy tutorials and command line tutorials which give step by step instructions for an example analysis. Protocols outline the analysis methods and suggest and compare tools for each step rather than prescribe them.
GVL users typically load genomic sequences that are then manipulated and analysed using a comprehensive suite of tools.
Aside from the public services managed by the GVL, a number of other institutions such as CSIRO and La Trobe University have downloaded the GVL to their servers to locally manage access for their institutional users.
4.4 Humanities Networked Infrastructure Virtual Laboratory (HuNI)
The Humanities Networked Infrastructure Virtual Laboratory (HuNI) was formed under an agreement with Deakin University in May 2012. Nectar has contributed funding of
$1,834,500 to 2016-17 and partners have committed to $2,500,000 in-kind. The partners in HuNI have included
• Australian Institute of Aboriginal and Torres Strait Islander Studies (AIATSIS)
• Australian National University
• Deakin University
• Flinders University
• Intersect Australia
• Macquarie University
• RMIT University
• University of Melbourne
• University of New South Wales
• University of Queensland
• University of Sydney
• University of Western Australia
• V3 Alliance
19
• Australian Centre for the Moving Image (ACMI)
The Project Director of HuNI is Professor Deb Verhoeven at Deakin University.
Google Analytics data provided by HuNI indicates around 4,600 users of HuNI during 2016. HuNI (Humanities Networked Infrastructure) combines data from many Australian cultural websites into a large humanities and creative arts database. HuNI data covers all disciplines and brings together information about the people, works, events, organisations and places that make up the country's rich cultural landscape.
HuNI combines information from 32 of Australia’s most significant cultural datasets. These datasets comprise more than 17 million authoritative records relating to the people, organisations, objects and events that make up Australia's rich cultural heritage. HuNI also enables researchers to work with and share this large-scale aggregation of cultural
information. HuNI has been developed as a partnership between 16 public institutions, led by Deakin University.
Access to the HuNI web site was first available in July 2012 and was officially launched in October 2014.
As Verhoeven and Burrows 2015 suggests this places HuNI
‘somewhere between a “data warehouse” in which the incoming data are first cleaned and organised into a consistent schema and a “data lake” in which the incoming data are ingested in their raw form and the responsibility or making sense of the data lies entirely with the end user’ p418
The constituent databases, have been reconfigured by HuNI so that the records are mapped to six core entities: Person, Organization, Event, Work, Place, and Concept. (Verhoeven and Burrows 2015).
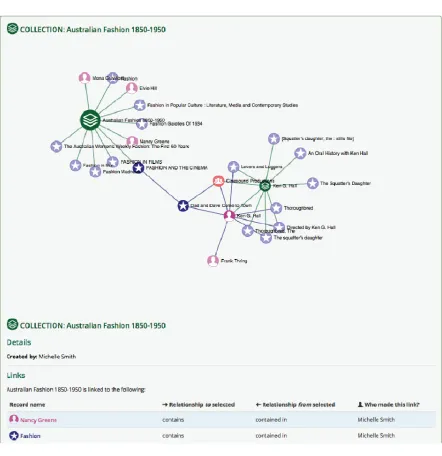
The user begins their search for an item of interest in one of these entities. That could be a name of a person or a particular organisation or a concept (topic) of interest. The power of HuNI is to retain as data within HuNI the connections discovered between items in the entities, such as a connection linking a person to others and/or an organisation and a concept etc. made by the user. These are saved by the user and may be placed in the public domain and thus made available for other users. Subsequent users may dispute the links made or supplement the links, creating a richer set of networks connected to one or more of the entities.
An example of such a network (a HuNI Knowledge Graph) is shown in Figure 4.1.
20
film with a fashion theme, Dad and Dave Come to Town to a collection generated by a different HuNI user investigating works directed by Ken Hall and produced by Cinesound Productions. There are further links made to other films directed by Ken Hall. By tracing the pathway of these visual links a HuNI user is able to expand their discovery opportunities through the serendipitous connections provided by a multitude of HuNI users.
Figure 4.1 An example of a HuNI Knowledge Graph
Source Verhoeven 2016, p 23
21
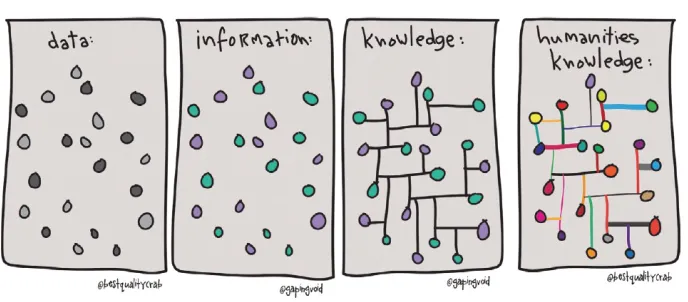
knowledge created by these connections is further enriched through the collaboration of other humanities users of the website.
Figure 4.2 Connections between data and information using HuNI
Source Verhoeven 2016, p 13
This facilitation of an unstructured approach to knowledge creation within the database encourages a serendipitous relationship search process. This is seen as a major added value of the VL, one that is particularly applicable to the humanities style of research and one that is not catered for by conventional archival databases.
‘HuNI moves beyond thinking of serendipity as only a technical problem and instead treats it as a matter of social, philosophical, and political significance’ (p23 Verhoeven 2016).
HuNI has been established with the idea that valuable knowledge and new perspectives are buried in traditional archival databases, which can be released by the partly unanticipated search processes supported and used by HuNI users (Verhoeven 2016). Perhaps this creation of new connections is HuNI’s highest value. It not only facilitates the creation of new networks through links with multiple databases, but also has the software that allows the connections made in the search process to be recorded, stored and made available to other researchers. Over time that archive of these HuNI Knowledge Graphs will add significant value to the HuNI project.
At this stage the resources available to the project have been largely devoted to the
22
23
5. Data on usage of Nectar Virtual Laboratories
The methodologies for measuring the value and impact of Nectar’s VLs depend on being able to describe the extent to which the VLs have been able to attract users of their services. In the evaluations we rely on data provided by the VLs on usage and on the responses to the on-line surveys of users.
Although the VLs differ in the extent and type of data they capture about usage of VL services, they readily provided usage data based on the regular collections they make for monitoring purposes and in response to further requests for different or more detailed data. Their ability to provide this data was limited for some because it was not data that was usually collected in the course of their operations.
The tables and figures below summarise the usage of VL services generally from when they became active to the present. For some, very early data was not available and the most recent data was for early 2017.
It is clear that the number of users for a particular VL increases rapidly in the first few years and has continued to grow over the past year.
This study on the value and impact of VLs is therefore occurring relatively early in their lifetimes, presenting challenges in assessing the likely number of users over the next few years and the potential maximum number of users. It is difficult to assess what percent of the current research base represents the maximum achievable by each VL and when this will occur. It would be expected that once this occurred, the future rate of growth would be lower and just reflect the numbers of new researchers entering the research fields of relevance to the VL.
BCCVL
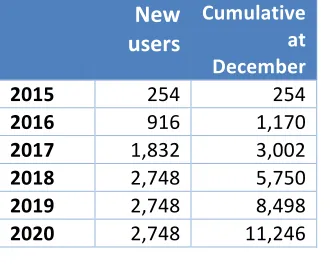
BCCVL provided monthly usage data from June 2015 to March 2017. From this data we show in Table 5.1 the numbers of new users for each calendar year and the cumulative number of users at December of each year. To this we add estimates of the new users and cumulative users calculated as follows.
Over the 11 months to March 2017, the number of users increased by 3.75 times compared to the previous 11 months. If it is assumed that the number of new users in 2017 will be 2.0 times that in 2016, and the value in 2018 will be 1.5 times 2017, and with the same number of new users in 2019 and 2020 as in 2018, then the number of new users and the cumulative number of users for 2017 to 2020 will be as in Table 5.1.
24
Table 5.1 BCCVL activity measures
New
users Cumulative at December
2015 254 254
2016 916 1,170
2017 1,832 3,002
2018 2,748 5,750
2019 2,748 8,498
2020 2,748 11,246
CVL
CVL consulted with a range of imaging facilities partners and provided estimates of the number of users. To August 2017 this amounted to 2558, so we assume that the number at December 2016 was 2400. Based on an initial cohort of 101 at December 2012, we
interpolated the number of new users from 2012 to 2016 and estimated that this would grow by 10% in the years to 2020. This resulted in an estimate of the cumulative total of 6,485 by the end of December 2020 (Table 5.2).
Table 5.2 CVL activity measures
New
users Cumulative at December
2012 101 101
2013 300 401
2014 500 901
2015 700 1,601
2016 800 2,401
2017 880 3,281
2018 968 4,249
2019 1,065 5,314
2020 1,171 6,485
GVL
GVL has provided usage data for the three major public service portals. It has not been possible to obtain and activity data for those organisations and individuals that have downloaded the data and launched their own private server on a public or private cloud, with the GVL pre-installed.
25
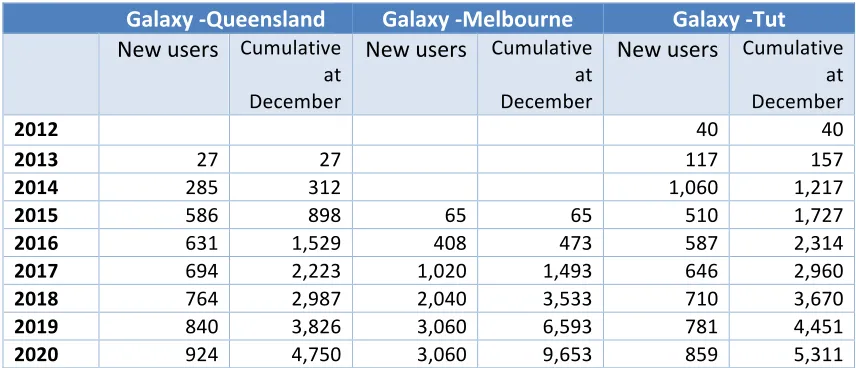
The numbers of new users and the cumulative numbers of users at December for the three portals is shown in Table 5.3. In a similar manner to that used for BCCVL, we estimate the number or new users and cumulative users to 2020 but recognise that the 3 portals have been operating for different lengths of time.
For Galaxy– Queensland and Galaxy– Tut we assume a 10% growth in new users for each of the years 2017 to 2020. For Galaxy– Melbourne the number of new users in the 9 months to February 2017 was 2.6 times that of the previous 9 months. We assume that the number of new users in 2017 will be 2.5 times that of 2016, the numbers in 2018 will be 2.0 times that of 2017, the numbers in 2019 will be 1.5 times that of 2018 and the numbers in 2020 will be the same as 2019. The estimated new users and cumulative users at December each year are shown in Table 5.3.
Table 5.3 GVL activity measures
Galaxy -Queensland Galaxy -Melbourne Galaxy -Tut
New users Cumulative at December
New users Cumulative at December
New users Cumulative at December
2012 40 40
2013 27 27 117 157
2014 285 312 1,060 1,217
2015 586 898 65 65 510 1,727
2016 631 1,529 408 473 587 2,314
2017 694 2,223 1,020 1,493 646 2,960
2018 764 2,987 2,040 3,533 710 3,670
2019 840 3,826 3,060 6,593 781 4,451
26
6. Estimating the value and impact of Nectar Virtual Laboratories
Most of the calculations reported in this section rely on estimates of the time spent by users accessing VL services and the salaries of these users.6.1 Cost data
For academic users we have calculated the hourly rate for different academic positions by obtaining salary data from Monash University and calculating the value for 2017. The annual salaries shown in Table 6.1 are averages of the levels within each academic grade for these positions. We have checked these levels with those in a number of other universities and other sources of information and regard the Monash University values as representative of salaries within Australian universities. For comparison purposes, the salaries are around 5% higher than those for Victoria University. To obtain an hourly costs equivalent we divide the annual salaries by the average number of working days in a year (225) and by the number of hours worked per day (7.35).
Following Beagrie and Houghton (2016) we add 30% to this to account for non-wage labour costs. This is also in line with current Australian university guidelines. The indicative hourly costs calculated in this way are shown in Table 6.1.
For student and other users the starting point is the median starting salaries of bachelor degree graduates in 2015 published by Graduate Careers Australia Ltd. Their most recent data is for 2015. To estimate the values for 2017, we add a further 4.4%, being the estimated two year increase in average weekly earnings for full-time adults (ABS 2017). Hourly costs are calculated in the same way as for academic hourly costs and these are shown in Table 6.2. From this we assume that the hourly cost for students is the hourly graduate cost of $44.52
Table 6.1 Academic salaries, and hourly costs
Level Salary, 2017 Hourly salary,
2017 Hourly costs, 2017
$,000 $ $
Academic A 77,819 47.06 61.17
Academic B 102,469 61.96 80.55
Academic C 123,546 74.71 97.12
Academic D 145,211 87.81 114.15
27
Table 6.2 Annual graduate salaries and hourly costs
Qualification Salary, 2015 Salary, 2017,
est. Hourly salary, 2017, est. Hourly costs, 2017, est.
$,000 $,000 $ $
Agricultural Science 50.0 52.2 31.56 41.03
Biological Sciences 50.0 52.2 31.56 41.03
Computer Science 54.0 56.4 34.09 44.32
Earth Sciences 60.0 62.6 37.88 49.24
Engineering 60.0 62.6 37.88 49.24
Mathematics 60.0 62.6 37.88 49.24
Physical Sciences 50.0 52.2 31.56 41.03
Veterinary Science 50.0 52.2 31.56 41.03
Average 54.3 56.6 34.25 44.52
TOTAL (all
qualifications) 54.0 56.4 34.09 44.32
Source: Table 1: Median starting salaries of bachelor degree graduates in first full-time employment and aged less than 25, by field of education and sector of employment, 2015 ($,000, n)¤†, Graduate Careers Australia Ltd, Graduate Salaries Report 2015, Graduate Careers Australia Ltd, 2016 at
http://www.graduatecareers.com.au/research/researchreports/graduatesalaries/
In the on-line survey of users, participants were asked about their position within their organisation. Allocating both academic and graduate level to these positions and using the distribution of answers from respondents, we calculated a mean hourly cost of users based on the hourly costs in Tables 6.1 and 6.2.
For BCCVL, CVL and GVL the hourly cost of users were $74.82 (or $63,127 annually), $66.39 ($56,015 annually) and $71.02 ($59,925 annually) respectively.
Investment value
In their study of EBI, Beagrie and Houghton were unable to estimate the total value of all the components of EBI’s investment value, such as data acquisition, depositing data,
collaboration cost and adding value to the data. They relied therefore on an estimate of the average annual operating expenditure as a proxy.
The set up and operating costs of each VL to the year 2016-17 were described in Table 2.2 in Section earlier.
28
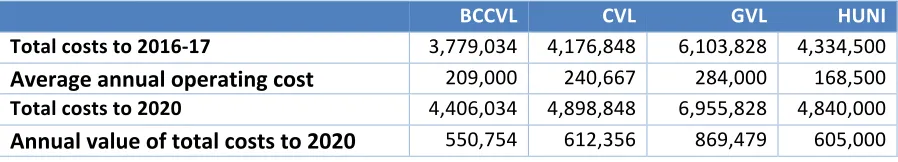
Dividing this by the number of years from VL inception to 2020, we can calculate the annual value of the overall investment made in each VL. As can be seen from Table 6.3 this is in the range $550,000 to $600,000 for BCCVL, CVL and HuNI and is somewhat higher at about $870,000 for GVL.
Table 6.3 Estimated total and annual cost for Virtual Laboratories
BCCVL CVL GVL HUNI
Total costs to 2016-17 3,779,034 4,176,848 6,103,828 4,334,500
Average annual operating cost 209,000 240,667 284,000 168,500
Total costs to 2020 4,406,034 4,898,848 6,955,828 4,840,000
Annual value of total costs to 2020 550,754 612,356 869,479 605,000
Contingent valuation
The contingent value of a non-market good or service is the amount users are willing to pay for it and/or are willing to accept in return for giving it up. For a public good the value is the sum of willingnesses, as consumption is non-rivalrous (e.g., the same information can be consumed many times). The key difference is that the amount that users are willing to accept in return for giving up access is typically higher than the amount they would be willing to pay, primarily because the latter is constrained by what they can afford (e.g., by disposable income, limited research grants, etc.).
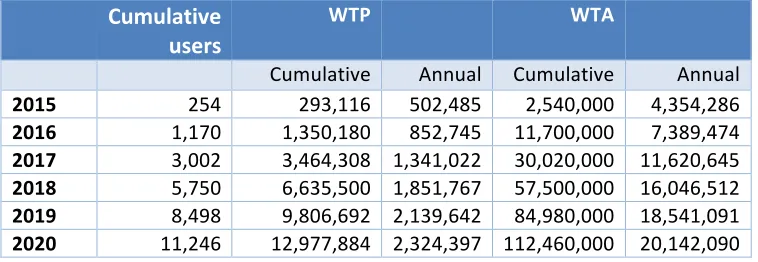
BCCVL
For BCCVL, the mean amount that users were willing to pay for access to BCCVL services was $1,154 (median value $250). On the other hand the mean amount users would be willing to accept to forego BCCVL services was $10,005 (median value $5,000). Users naturally put a higher value on BCCVL services when they are not subject to an income constraint. As a comparison, Beagrie and Houghton found the mean willingness to pay for EBI was around $2,800 (GBP 1628).
Using the mean willingness to pay value of $1,154, the contingent valuation of BCCVL by users would therefore have been $1,350,180 in the period to December 2016, or an annual equivalent of $852,745, rising to $13.0 million by December 2020, or $2.3 million per year. (Table 6.4). The annual equivalent for each year is calculated by dividing the cumulative value to that point by the number of months elapsed since inception of the VL and multiplying by 12. As usage of BCCVL began in June 2015, the annual value estimated for 2015 is higher than the cumulative value.
29
Table 6.4 BCCVL contingent valuation
Cumulative
users WTP WTA
Cumulative Annual Cumulative Annual
2015 254 293,116 502,485 2,540,000 4,354,286
2016 1,170 1,350,180 852,745 11,700,000 7,389,474
2017 3,002 3,464,308 1,341,022 30,020,000 11,620,645
2018 5,750 6,635,500 1,851,767 57,500,000 16,046,512
2019 8,498 9,806,692 2,139,642 84,980,000 18,541,091
2020 11,246 12,977,884 2,324,397 112,460,000 20,142,090
CVL
The mean amount that CVL users were willing to pay was $1,524 (median $900), while their mean willingness to accept was $14,130 (median $20,000).
Using the mean value of $1,524 and the estimates of CVL users above, suggests that by December 2020 the contingent value of CVL would be $9.9 million or an average annual value of $1.2 million. Using the willingness to accept value this would be $91.6 million by December 2020, or $11.5 million annually (Table 6.5).
Table 6.5 CVL contingent valuation
Cumulati
ve users WTP WTA
Cumulative Annual Cumulative Annual
2013 301 611,124 611,124 5,666,130 5,666,130
2014 601 1,373,124 686,562 12,731,130 6,365,565
2015 1,051 2,439,924 813,308 22,622,130 7,540,710
2016 1,550 3,659,124 914,781 33,926,130 8,481,534
2017 2,100 5,000,244 1,000,050 46,360,530 9,272,106
2018 2,705 6,475,476 1,079,246 60,038,370 10,006,395
2019 3,371 8,098,231 1,156,890 75,083,994 10,726,286
2020 4,103 9,883,262 1,235,410 91,634,180 11,454,271
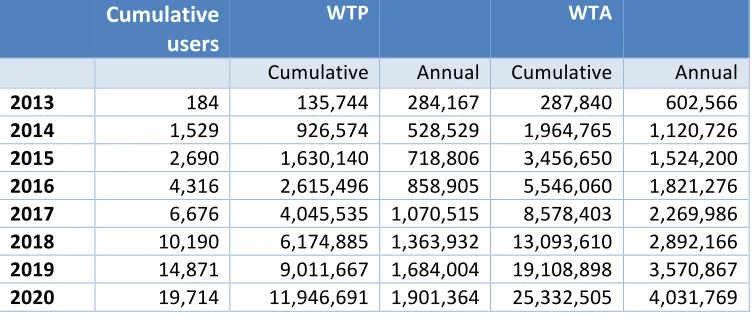
GVL
The mean amount that Galaxy - Melbourne users were willing to pay was $606 (median $100), while their mean willingness to accept was $1285 (median $800).
30
Table 6.6 GVL contingent valuation
Cumulative
users WTP WTA
Cumulative Annual Cumulative Annual
2013 184 135,744 284,167 287,840 602,566
2014 1,529 926,574 528,529 1,964,765 1,120,726
2015 2,690 1,630,140 718,806 3,456,650 1,524,200
2016 4,316 2,615,496 858,905 5,546,060 1,821,276
2017 6,676 4,045,535 1,070,515 8,578,403 2,269,986
2018 10,190 6,174,885 1,363,932 13,093,610 2,892,166
2019 14,871 9,011,667 1,684,004 19,108,898 3,570,867
2020 19,714 11,946,691 1,901,364 25,332,505 4,031,769
Efficiency impacts
In the on-line surveys, users were asked the following questions about the amount of time they spent doing research, the share of that time working with data and their estimates of the time savings from using the VL.
Over the last twelve months, on average how many hours per week did you spend on research?
Can you estimate the approximate share of your total research working time spent with data during the last twelve months (e.g. creating, manipulating and analysing data)?
All data:
approximate percent of my total research working time
Data from GVL:
approximate percent of my total research working time
To what extent, if any, has your use of GVL services and resources changed your research efficiency (i.e. the time saved compared to the situation if GVL did not exist?
31
Applying these values to the cumulative number of users for each VL we estimate that the efficiency improvement due to each VL is as shown in Table 6.9. More conservatively, if we apply these values just to the number of new users each year for each VL, the calculated values are as shown in Table 6.10.
Whichever method is used demonstrates that there are substantial benefits in research efficiency arising from the VLs.
Table 6.7 Survey responses on research and efficiency
BCCVL CVL GVL
Time spent on research, hours per week mean 22.8 28.5 37.9
median 20.0 30.0 40.0
Share of research time working with data, % mean 65.1 59.9 66.4
median 70.0 50.0 75.0
Share of research time working with VL, % mean 11.8 28.0 11.4
median 5.0 23.0 7.0
Increase in research efficiency, % mean 31.0 31.1 39.1
median 30.0 30.0 50.0
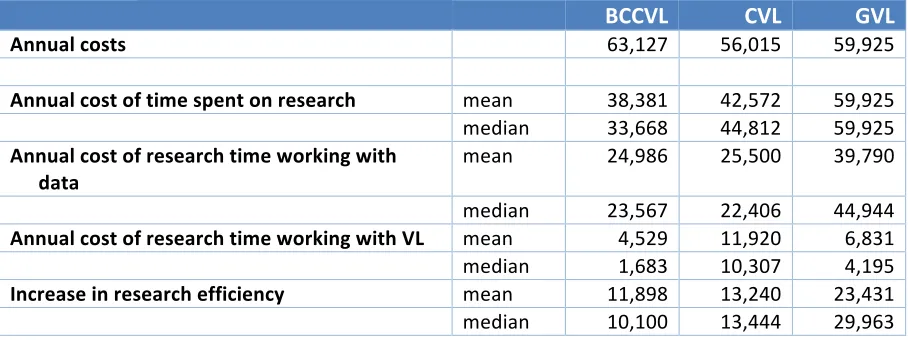
Table 6.8 Average annual value of efficiency impact per user
BCCVL CVL GVL
Annual costs 63,127 56,015 59,925
Annual cost of time spent on research mean 38,381 42,572 59,925
median 33,668 44,812 59,925 Annual cost of research time working with
data mean 24,986 25,500 39,790
median 23,567 22,406 44,944
Annual cost of research time working with VL mean 4,529 11,920 6,831
median 1,683 10,307 4,195
Increase in research efficiency mean 11,898 13,240 23,431
median 10,100 13,444 29,963
Table 6.9 Value of Virtual Laboratories on research efficiency, using
cumulative users, $
Cumulative Annual average
BCCVL CVL GVL BCCVL CVL GVL
2013 0 5,309,154 4,311,244 0 5,309,154 4,311,234
2014 0 11,929,046 35,825,502 0 5,964,523 17,912,707
2015 3,022,137 21,196,896 63,028,516 1,007,386 7,065,632 21,009,454
2016 13,920,867 31,788,724 101,126,793 3,480,241 7,947,181 25,281,636
2017 35,718,327 43,439,735 156,423,186 7,143,715 8,687,947 31,284,560
2018 68,414,518 56,255,846 238,758,578 11,402,498 9,375,974 39,792,999
32
2020 133,806,898 85,861,065 461,912,327 16,725,977 10,732,633 57,738,899
Table 6.10 Value of Virtual Laboratories on research efficiency, using new
users, $
Cumulative Annual average
BCCVL CVL GVL BCCVL CVL GVL
2013 0 3,971,935 3,374,009 0 3,971,935 3,374,009
2014 0 6,619,892 31,514,180 0 3,309,946 15,757,090
2015 3,022,158 9,267,849 27,202,947 1,007,386 3,089,283 9,067,649
2016 10,898,805 10,591,828 38,098,184 2,724,701 2,647,957 9,524,546
2017 21,797,610 11,651,011 55,296,257 4,359,522 2,330,202 11,059,251
2018 32,696,415 12,816,112 82,335,190 5,449,402 2,136,019 13,722,532
2019 32,696,415 14,097,723 109,678,720 4,670,916 2,013,960 15,668,389
2020 32,696,415 15,507,495 113,474,480 4,087,052 1,938,437 14,184,310
Additional research made possible by Virtual Laboratories
The on-line survey asked users the following question (or an equivalent variant) about how important the VL was to their research
If GVL had not existed, would you have been able to obtain the resources you last used from another source?
For BCCVL, CVL and GVL the proportion of users who answered “No” to this question was 55.26%, 29.03% and 34.3% respectively. It is clear therefore that the VLs are important agents enabling research in their fields. Again by way of comparison, about 45% of EBI users also indicated that they could not have proceeded in their research without EBI.
33
Table 6.11 Value of Virtual Laboratories in enabling additional research,
using cumulative users, $
Cumulative Annual average
BCCVL CVL GVL BCCVL CVL GVL
2013 0 6,520,762 3,781,977 0 6,520,762 3,781,977
2014 0 14,651,388 31,427,409 0 7,325,694 15,713,705
2015 8,860,592 26,034,265 55,290,864 2,953,531 8,678,088 18,430,288
2016 40,814,537 39,043,267 88,712,033 10,203,634 9,760,817 22,178,008
2017 104,722,428 53,353,169 137,220,003 20,944,486 10,670,634 27,444,001
2018 200,584,264 69,094,061 209,447,547 33,430,711 11,515,677 34,907,925
2019 296,446,101 86,409,042 305,661,872 42,349,443 12,344,149 43,665,982
2020 392,307,937 105,455,522 405,205,981 49,038,492 13,181,940 50,650,748
Table 6.12 Value of Virtual Laboratories in enabling additional research,
using new users, $
Cumulative Annual average
BCCVL CVL GVL BCCVL CVL GVL
2013 0 4,878,376 2,959,808 0 4,878,376 2,959,808
2014 0 8,130,626 27,645,432 0 4,065,313 13,822,716
2015 8,860,592 11,382,877 23,863,455 2,953,531 3,794,292 7,954,485
2016 31,953,945 13,009,002 33,421,169 7,988,486 3,252,250 8,355,292
2017 63,907,891 14,309,902 48,507,970 12,781,578 2,861,980 9,701,594
2018 95,861,836 15,740,892 72,227,545 15,976,973 2,623,482 12,037,924
2019 95,861,836 17,314,981 96,214,325 13,694,548 2,473,569 13,744,904
2020 95,861,836 19,046,480 99,544,109 11,982,730 2,380,810 12,443,014
Returns to research activities made possible by Virtual Laboratories
Because technology is important in the continuing development of new products and improved productivity, the role of research and development and its contribution to the economy has been studied widely. A review of these studies has been provided in Section 3 above which concluded that a 40% annual return on investment is a conservative estimate of the value of research.
34
value by dividing by 30. Both the total NPV and the annualised value are shown for each VL in Table 6.13.
Table 6.13 Returns to additional research made possible by Virtual
Laboratories $m.
30 year benefit Annualised benefit
BCCVL 2,277.8 75.9
CVL 609.5 20.3
35
7. Further assessment of the impact and value of the
Characterisation Virtual Laboratory
Different Virtual Laboratories (VLs) share the same purpose, which is to facilitate data analysis, provide researchers with IT resources and promote collaborative research. Where the VLs differ is in their scope and implementation. A major point of difference for CVL is its method of operation because it works primarily with instrument facilities rather than end users. By developing data capture, analysis and visualisation workflows directly with instrument facilities, CVL aims to underpin the entire facility user community. This
integration enables seamless transfer of data from the instruments for storage and analysis. The CVL method of operation and ease of transfer means that users are not always aware that they are using CVL, and many consider the capabilities provided by CVL as a component of the instruments, rather than as a separate service. Low awareness of CVL among its users raises concerns about the representative nature of responses from the CVL user survey. In collaboration with Dr Wojtek Goscinski, the manager of CVL, the current study used an additional approach to evaluate CVL from the perspective of managers from a number of imaging facilities. Imaging facilities house and maintain advanced imaging instruments, and they represent considerable national investment in Australia’s research infrastructure. A list of imaging facilities that utilise CVL services is given in Appendix 2. To date, CVL has been integrated with 69 instruments in 26 imaging facilities.
The interviews conducted with facility managers provided a glimpse into diverse aspects of CVL value. Much of that value is additional to the direct benefit of CVL to individual users. The additional benefits included economies of scale, the potential for scaling up CVL
application and the intrinsic value of CVL as a digital resource. These different types of value are outlined below.
(i) A centralised HPC capability cuts costs by reducing HPC replication across research organisations
Imaging instruments can generate vast amounts of data that requires extensive HPC capabilities for analysis. Dr Georg Ramm (Clive and Vera Ramaciotti Centre for Structural Cryo-Electron Microscopy, Monash University) manages an electron microscopy facility that contains many such instruments, most notably the Titan Krios cryo-electron microscope, which is used typically for 2D and 3D characterization of cellular or molecular structures and it is particularly data intensive. There are around 100 users at the centre, of whom
approximately half rely on the HPC capability of CVL on MASSIVE for data storage, while the remainder require the analytical capacity of CVL for data processing.
36
• A small computing cluster would cost around $200,000 and it would need to be updated within 5 years. Salary costs for part-time PhD-level staff to manage the cluster would add around $50,000 per year to the outlay, bringing the total to around $90,000 per year.
• Dr Andrew Janke (Centre for Advanced Imaging, University of Queensland) estimated CVL replacement cost at $250,000. The amount was based on the cost of setting up an in-house platform for the centre.
• Prof Sampson (Centre for Microscopy, Characterisation and Analysis, UWA) estimated that when implemented at full capacity, the value of CVL services to the centre could well be worth $50,000 per year. At this stage, flow and mass cytometer is the only instrument integrated with CVL, although integration with other instruments is being rolled out.
• Dr Ian Harper from Monash Micro Imaging (MMI) estimated the cost of replacing the access to HPC through CVL at $20,000 per year.
Using Dr Harper’s most conservative estimate, it would cost over $500,000 per year to replace HPC services currently provided by CVL to 26 facilities. This figure is well above the CVL running cost of $177,000-$320,000 per year (Table 2.2). The estimated replacement cost is for HPC alone; it does not take into account the value of all other services provided by CVL, which are outlined below.
(ii) Potential for scaling up the CVL platform
CVL has been adopted widely in a relatively short time. In less than four years since its inception, it has been integrated with 69 instruments across 26 imaging facilities. The expansion of CVL is ongoing. In addition, CVL integration with commonly used technology has the potential for scaling up. For example, the integration of the flow cytometer at the Centre for Microscopy, Characterisation and Analysis in UWA, is expected to be replicated widely. Flow cytometry is increasingly used for cell counting and sorting not only in
research, but also in major hospitals. There are over 20 machines and around 100 users of flow cytometry in WA, over 100 machines in Australia and around 5,000 worldwide. Integration with CVL has the potential to be replicated in other centres, attracting more users to the platform.
37
(iii) Increasing the efficiency of research and the impact of research investment In providing access to secure storage for experimental data, CVL contributes to improved research outcomes. Dr Ian Harper from Monash Micro Imaging (MMI) described problems with data loss prior to integration with CVL, when USB data transfer was used. Dr Ramm (Centre for Structural Cryo-Electron Microscopy) also recalled prolonged periods of
downtime when users brought their own hard drives to download data, making instruments vulnerable to attack by computer viruses.
The ability to store all experimental data securely allows researchers to interrogate old data in subsequent years to answer new research questions. The ability to share data with collaborators through the CVL platform also means that the same data can be interrogated by other researchers. Reusing experimental data in this way and improves the efficiency and impact of each experiment; it also reduces the need to repeat experiments
Increasing reproducibility of research findings is another way to improve the efficiency and impact of experimental research. Dr Andrew Janke (Centre for Advanced Imaging, UQ) emphasised that one of the main benefits of CVL to his facility is that it facilitates reproducibility. Dr Janke used the example of “quarantining” superseded versions of analytical software, such as FSL, a package of image analysis tools used for MRI brain imaging data. After a release of updated FSL older versions are no longer available. This often means that results of earlier experiments cannot be replicated. A recent study
estimated that fewer than 16% of neuroimaging results are reproducible (Russell et al 2017). CVL preserves all releases of the software.
Dr Ceguerra (Australian Centre for Microscopy & Microanalysis, University of Sydney) noted that in the absence of CVL, the return on the $5 million investment in the Atom Probe would be greatly diminished in terms of research outcomes. The Atom Probe enables 3D imaging and chemical composition measurement. Because of the novelty of this technology, there are few analytical tools available and users are required to develop their own methods and software. The Atom Probe workbench developed by CVL acts as a repository of analytical software that is developed by users. This repository represents a significant investment in research time – over 14 years of effort from multiple people. According to Dr Ceguerra, without CVL some projects would be set back by as much as five years, with the researchers having to develop the tools they need by themselves. CVL is also critical for disseminating research outcomes in the Atom Probe research community.
(iv) Value of CVL as a digital resource
38
close to one hundred such instruments worldwide2 with around 500-600 researchers trained to use them, 34 of them at the facility in Sydney. Despite its small size, this community represent an important field of research that has produced far-reaching discoveries in materials engineering.
As already mentioned, the atom probe is novel technology without a canon of well-established analytical methods. It has fallen to users to develop the methods they need. The repository of user-generated software on the CVL Atom Probe workbench has no equivalent and has become the key platform for Atom Probe research worldwide. CVL is also critical for disseminating research outcomes in the Atom Probe research community. The valuation of the intrinsic value of VLs as a digital resource is outlined in more detail in Section 8 of this report.
Dr Andre Janke said that CVL provided novice users with an easy to navigate mechanism for to rapidly get up to speed with their analysis without the need to install or configure
software, something that previously took a large investment of time. Dr Janke estimated the saving in time as approximately three months. That time is valued at over $19,000 junior for a postdoctoral fellow (commencement level Academic level A salary is $77,819, Table 6.1) or $6,670 for a PhD student (Monash University PhD annual stipends are $26,682) Interviews with imaging facilities managers provided an insight into far-reaching benefits of CVL, which would not be apparent from survey responses of individual users. The categories of value identified in this way would be equally applicable to the other VLs. In a similar way, BCCVL, GVL and HuNI offer economies of scale through centralising IT resources; and aim to develop value as digital resources, to improve the efficiency and impact of research and to expand their services outside the host organisations and outside