c
Owned by the authors, published by EDP Sciences, 2012
Isolation of kinetic and spatial properties of uni-axial dynamic tensile
loading of OFHC copper
D. Dennis-Koller, J.P. Escobedo-Diaz, E.K. Cerreta, C.A. Bronkhorst, B. Hansen,
R. Lebensohn, H. Mourad, B. Patterson, and D. Tonks
Los Alamos National Laboratory, Los Alamos, NM 87545, USA
Abstract. Materials performance is recognized as being central to many emergent technologies. Future technologies will place increasing demands on materials performance with respect to extremes in stress, strain, temperature, and pressure. In this study, the dynamic ductile damage evolution of OFHC Cu is explored as a test bed to understand the role of spatial effects due to loading profile and defect density as well as the role of the kinetics of tensile pulse evolution. Well-characterized OFHC Cu samples of 30µm, 60µm, 100µm, and 200µm grain sizes were subjected to plate impact uniaxial strain loading in spall geometry to produce early stage (incipient damage. Using 2D metallographic techniques, soft recovered samples were studied to statistically link mesoscale processes to continuum level observations of free surface particle velocity measured with VISAR. Based on these findings, mechanisms for the void nucleation/growth and coalescence are proposed.
1 Introduction
Materials are recognized as being central to many emer-gent technologies. Future technologies will place increas-ing demands on materials performance with respect to ex-tremes in stress, strain, temperature, and pressure. Hence, it is not surprising that material failure and property degra-dation is a critical problem. This type of damage and failure is often linked to defects within the material and determines service lifetime. Dynamic material damage develops through an evolution of microstructural changes from the atomic scale to the macroscale damage event and is affected significantly by defects such as grain boundaries and inclusions within structural metals which typically serve as failure initiation sites. While for some defect types, their mere presence is enough to cause failure, for others, spatial considerations such as distribution or density can be critical [1]. Shock compression via plate impact is used to investigate dynamic damage processes because of the ability to control global one-dimensional, planar strain loading conditions and to recover the sample for metallurgical analysis. In a plate impact experiment, dynamic tensile damage occurs when rarefaction (de-compression) waves within the target material interact to produce tensile stresses in excess of the yielding threshold required for damage initiation.
Extensive work to date has established that spall is a complex process strongly influenced by the dynamic load-ing profile or shock wave shape imparted to the specimen and microstructure [2–5]. However, while this is now gen-erally accepted, the evolution of the tensile stress leading to yielding in the material is not well understood. Most of the cited work has focused on the effects on particle velocity pull-back measurements in experiments in which the sample experienced complete failure. This precludes any significant conclusion about the individual contribu-tions of material characteristics from these measurements. The evolution of the tensile stress leading to damage is controlled by shock rise time, pulse duration, peak shock stress (compressive and tensile) and release rate. In
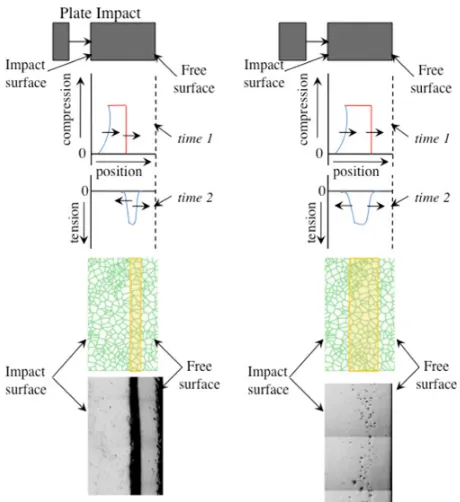
addi-tion, as the shock wave shape is altered experimentally, one important parameter that is frequently unaddressed is the coupling of that changing shock wave shape to the changes in the volume of material that is subjected to tension during a dynamic experiment. Figure 1 illustrates the effect of changes in shock wave shape (resulting from changes in impactor and target geometry) on the characteristics of the region of tension developed in the material leading to dam-age. Changes in pulse shape that significantly effect the volume of material being sampled in tension are believed to couple with microstructural length scales in a specimen to yield changes in the damage observed in soft recovered flyer plate experiments.
Incipient spall experiments are performed on high-purity copper samples with a known grain boundary den-sity/distribution (grain size) to examine the relationship between these defect characteristics and void growth. Soft recovery of samples provides characterization of the end state, quantification of microstructural state and insipient damage.
2 Experimental procedure
2.1 Initial material characterization
Fig. 1.Time evolution of the stress profile in a material during a plate impact experiment in spall geometry. The effect of changing the expermental geometry results in a tensile region of different size forming in the material. Microstructural considerations in-clude number of defect sites subjected to the tension evolved in the volume defined by a given geometry.
consistent with those typically obtained in recrystallized copper.
Subsequent characterization of the damage in the re-covered samples included optical and EBSD microscopy. In preparation for the optical and EBSD analyses, each recovered specimen is diametrically sectioned. They are subsequently mounted in an epoxy resin and prepared fol-lowing standard metallographic techniques up to a 0.05µm colloidal silica final polish, performed on a vibratory polisher. Finally, they are electrochemically polished using a solution of two parts of phosphoric acid to one part water at∼1.9 V for∼10 sec. A similar procedure is followed on the undeformed, as-annealed samples. Optical microscopy was performed on a Zeiss microscope equipped with an automated stage. Image processing is done using Image J. EBSD is performed on a Phillips XL30 FEG SEM using a voltage of 20 kV and a spot size of 4.
2.2 Plate impact experiments
Plate impact experiments have been conducted using a smooth bore 78 mm or a 50 mm light gas gun. For the spatial effect study, a single well characterized loading condition is chosen for all experiments to ensure the kinetic aspects of the tensile stress profile evolution remain consis-tent for all experiments. The microstructural length scale is altered by changing the number of grain boundaries subjected to the tensile volume evolved by a given shock wave profile (controls defect density per unit volume). This is accomplished by using different grain sizes and identical
shock loading profile (identical experimental geometry). Quartz impactors (z-cut, 2 mm nominal thickness) are mounted on brass sabots and launched using Ar gas. Quartz impactors ensure that a single, elastic shock wave is produced in the stress range of interest to this study. Table 1 lists the experimental details. To ensure that the recovered samples are subjected to only a known uniax-ial loading/unloading history, significant radial release is minimized through the use of momentum trapping rings (technique described elsewhere [6]).
The kinetic study is accomplished by altering exper-imental geometry. When two rarefactions (the unloading portion of a shockwave) travelling in opposite directions collide inside the target material, a region of tension is formed. As rarefactions propagate through the material they decrease in slope (or the unloading rate decreases). These experiments utilize this property by interacting rar-efactions that have propagated through material to achieve controlled rates at which tension is produced within the target material. This manipulation of geometry also alters the volume of material sampled in tension for each rate and requires us to control defect density per unit volume in similar fashion to what is shown in the microstructural length scale study.
After assembly, the parallelism, of the sample to the target plate, and the height of each pin with respect to the target plate is measured. Velocimetry profiles are obtained using a VISAR [7] system (spot size∼0.5−1 mm diameter) mounted 90◦ off of the shock direction axis to prevent the target from impacting the probe. In all cases shots are performed between two and four times to test repeatability as well as generate statistically accurate measurements of damage distributions.
3 Results and discussion
Figure 2 shows the free surface velocity (FSV) histories for the microstructural length scale experiments. Experimental parameters are listed in Table I along with calculated spall strength. The peak free surface velocities range from 82–84 m/s, corresponding to peak compressive stresses of 1.50–1.56 GPa. These values are calculated using the Mie Gr¨uneisen equation of state for copper:ρo=8.924 gr/cm3 (density), Co=3.94 mm/µs (bulk sound speed), s=1.489 andγ=1.96. The spall strength (σspall) is calculated using the relationship for a material that exhibits an elasto-plastic behavior [8]:
σspall≡ρ0CL∆FS V
1+ CL
Co −1
(1) where CL = 4.77 mm/µs is the longitudinal sound speed and∆FSV is the difference in free surface velocity from the peak state to the minima after release. The measured and calculated experimental parameters are listed in Table 1. It is found that by holding the loading profile constant (i.e peak stress and experimental geometry identical for each experiment), the calculated spall strength is ∼1.31– 1.38 GPa with no clear influence of the grain size.
Table 1.Experimental parameters for OFHC Cu experments and calculated values from velocimetry measurements.
Experiment Grain size,µm Impactor UDkm/s Target Spall Strength, Vsp-pk/vcomp
thickness, mm thickness, mm Gpa
ls-1430 30 2.027 0.134 3.998 1.38 0.214
ls-1440 60 2.027 0.133 4.030 1.36 0.349
ls-1476 100 2.056 0.138 4.034 1.31 0.345
ls-1434 200 2.025 0.131 3.899 1.38 0.231
56-11-35 100 1.595 0.090 3.038 1.21 0.434
56-11-36 100 1.041 0.090 3.046 1.31 0.218
56-11-39 60 1.564 0.091 4.027 1.47 0.211
56-11-41 60 1.048 0.091 1.996 —-
—-56-11-42 150 2.517 0.091 5.017 1.43 0.561
Fig. 2.VISAR results for the free surface velocity of OFHC Cu of 4 different grain sizes. While all shock wave shapes agree through the release, the response after the pullback shows differences in the yielding response and can be correlated to microstructural features in the recovered samples.
back and the rate at which the velocity rises to the first peak (i.e. spall peak) after the release minima are indicative of the mechanisms involved in the yielding process. Figure 3 shows the pull back signals for each experiment (from the minima reached after release to the spall peak velocity reached in the pull back). The times and velocities are shifted so that the minima coincides with the origin in the plot.
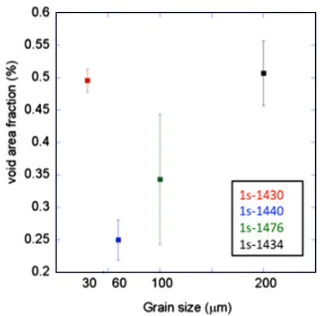
In a qualitative manner, Cochran and Banner [9] showed that the ratio of the peak particle velocity after the release minima (Vsp-pk) with respect to the peak particle velocity on compression (Vcomp) is indicative of the observed void density in the recovered sample. Essentially, they observed that as the pull back signal increases in magnitude (as the difference between Vcomp and Vsp-pk gets smaller) the amount of observed damage in also increased. Ta-ble II lists the ratio of these velocities for the current experiments. Figure 4 shows observed void area fraction from the recovered samples in these experiments plotted against grain size and it follows a trend similar to that expected by Cochran and Banner. The larger the diff er-ence between Vcomp and Vsp-pk; the larger the void area fraction observed in the recovered sample. The void area fraction in these experiments is calculated as the area of voids divided by the tensile area calculated using LASLO (a 1-D hydrocode developed at Sandia National Labora-tory). In ductile materials, the rate at which the velocity
Fig. 3. VISAR pull back where all minima after the release have been normalized to 0. In all experiments the initial particle acceleration is similar. A mechanism change from nucleation dominated processes to gowth dominated processes leads to a regime where microstructural length scale (grain size) controls growth mechanism (coalescence dominated results in high par-ticle accceleration and individual void growth results in lower particle acceleration).
Fig. 4. Void area function measured from recovered samples indicates that identical loading for the cases of large grain size and small grain size the void field is larger or more developed, whereas for mid size grains the void field is smaller or less developed.
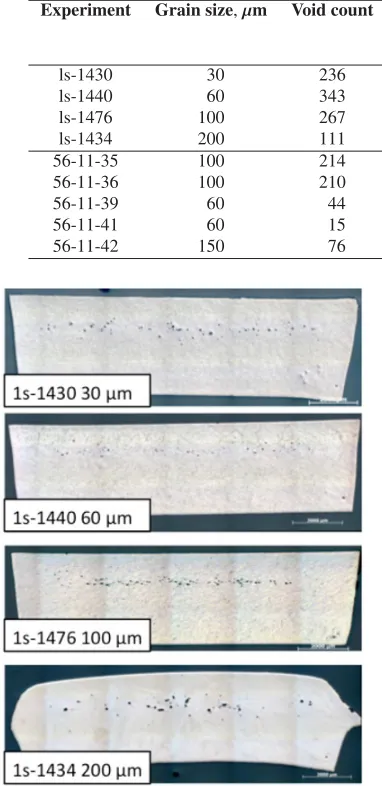
Table 2.Experimental data for soft recovered OFHC Cu measured with 2D metallographic techniques.
Experiment Grain size,µm Void count Void area Avg. void Tensile area, Tensile rate,
fraction, diameter,µm mm2 Gpa/µs
%
ls-1430 30 236 1.134 38.1 23.72 16.81
ls-1440 60 343 0.585 22.7 23.72 16.81
ls-1476 100 267 0.964 33.0 23.72 16.81
ls-1434 200 111 1.118 55.2 23.72 16.81
56-11-35 100 214 1.306 37.3 17.89 27.50
56-11-36 100 210 0.819 28.3 16.09 22.94
56-11-39 60 44 0.629 63.5 22.10 22.74
56-11-41 60 15 0.148 41.5 13.67 28.68
56-11-42 150 76 0.698 63.2 34.18 11.47
Fig. 5. Optical micrographs of the cross sections taken from the recovered Cu samples shows qualitatively the obeserved difference in damage field due only to differences in grain size under identical loading conditions.
rapid fracture process; to C0 in the cases where there is a stress relaxation due to a resistance in void growth which leads to lower damage rates [10]. Thus, shorter rise times to the spall peak correlate with a more rapid completion of the damage. In the microstructural length scale experiments, the 30 and 200µm samples exhibit a monotonic rise from the minima to the spall peak, indicative of a fast damage evolution process. Conversely, 60 and 100µm samples experience a fast rise time initially, which subsequently displays a distinctive change in slope. This response indicates the dominate damage evolution mechanism undergoes a change. Figure 5 shows the optical micrographs of cross sections taken from the recovered samples. Figure 6 shows EBSD images from those same cross sections. Table 2 lists the void area fraction which is in agreement with the ratio of ratio of particle velocity for the compressive peak (Vcomp) to the spall peak particle velocity after the minima (Vsp-pk). The statistics relating to the character of the damage indicates the dominate
mech-Fig. 6.EBSD images of the cross sections of the Cu show that for small and large grain sizes larger coalesced voids are obeserved. In the cases of the mid grain sizes voids are largely isolated no significant coalescence is observed.
anisms. For intermediate grain sizes of 60 and 100µm, measurements reveal a larger count of primarily smaller sized voids which indicates a largely nucleation dominated damage growth mechanism with growth of individual iso-lated void (minimal coalescence). However, in the largest and smallest grain sizes of 30 and 200µm, measurements reveal a smaller void count of primarily larger sized voids which is indicative of more rapid void coalescence and growth (minimal nucleation).
Fig. 7.VISAR free surface velocity measurements for tensile pulse rate experiments.
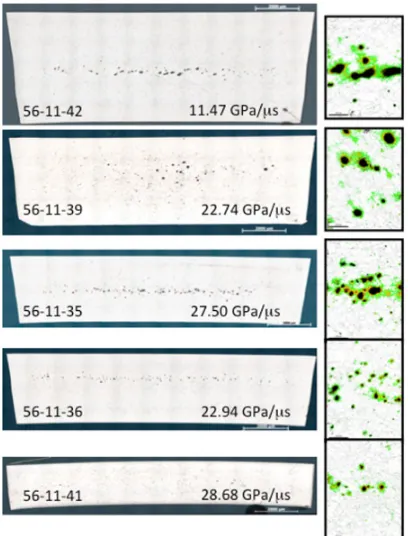
Fig. 8. Optical micrscopy images of tensile pulse rate experi-ments with EBSD misorientation maps indicating retained plastic deformation in the microstructure due to yielding processes.
the spall peak after the minima (Vcomp/Vsp-pk) does not go with void area fraction as it did in the microstructural length scale study. It is also observed that given different loading paths for tensile pulse evolution the transition from nucleation to growth dominated regimes as reflected in the spall peak after the minima may seem obvious for all experiments except 56-11-39 where the nucleation region is not obvious. As tensile rate increases (as seen in Fig. 9) a transition is observed from a small number of large voids (growth dominated) to a large number of small voids (nucleation dominated) to a rate at which both nucleation and growth appear to be overdriven (experiment 56-11-41, the small number of voids was not sufficient enough for
Fig. 9.Spall peak after the release minima is indicative of growth mechanism (rate of growth) as well as total damage content. The dotted red line indicates a possible nucleation dominated regime for all experiments except 56-11-39, which appears to be purely growth dominated.
VISAR to detect a significant wave reflection and thus does not detect any damage in this experiment).
4 Conclusions
In the tensile pulse rate experiments, relationships between statistical observations of the resultant damage and the particle velocity begin to break down. This may be indicative of mechanisms active during compressive pulse duration having a significant effect on yielding processes during tension. However, metallographic analysis indicates that tensile pulse rate significantly influences the mech-anisms dominating the damage evolution. For very low strain rates a growth dominated mechanism is present with very few voids which have significantly grown and coalesced. This is also observed in the monotonic rise to the spall peak after the minima. As tensile rate increases a transition to nucleation dominated mechanisms is observed where there are a large number of smaller voids present and the rise to the spall peak after the minima display two clear slopes. Interestingly, the highest rate experiments appear to overdrive both nucleation and growth mechanisms, resulting in almost no resultant voids. Further exploration into the mechanisms dominant in these regimes is ongoing.
Acknowledgements
The authors would like to thank Frank Cherne for his help running the LASLO calculations which have provided a critical design tool for this work. This work was carried out under
the auspices of U.S. DOE at LANL under contract DE-AC52-06NA25396. LDRD DR project 20100026DR.
References
1. C. Reid, Metal. Trans. A 12, (1981), pg. 371–377. 2. M. Kumar, AlChE Annual Meeting, Conference
Pro-ceedings (2005), pg. 2541.
3. D. R. Curran, L. Seaman and D. A. Shockey, Phys Today30(1), 46 (1977).
4. T. W. Barbee, L. Seaman, R. Crewdson and D. Curran, J Mater7(3), 393–401 (1972).
5. J. N. Johnson, G. T. Gray and N. K. Bourne, J Appl Phys86(9), 4892–4901 (1999).
6. D. D. Koller, R. S. Hixson, G. T. Gray, P. A. Rigg, L. B. Addessio, E. K. Cerreta, J. D. Maestas and C. A. Yablinsky, J Appl Phys98(10), (2003). 7. W. F. Hemsing, Rev Sci Instrum50(1), 73–78 (1979). 8. Kanel, GI. distortion of the wave profiles in an elasto-plstic body upon spalling. Journal of Applied Mech. and tech. Phys. 2001, 42(2) p. 358–362.
9. S. Cochran and D. Banner, J Appl Phys48(7), 2729– 2737 (1977).