Analysis of Phase Noise Influence on Micro-Doppler Feature
Extraction of Vibrating Target
Zihao Liu, Bo Peng*, and Xiang Li
Abstract—It is generally considered that increasing the carrier frequency of radar is an important
way to improve the precision of micro-motion measurement. However, the increase of the center
frequency may raise the phase noise intensity of the radar transmitting signals and make the extraction more difficult; therefore, it is particularly necessary to study the influence of phase noises on the extraction of micro-motion characteristics. In this paper, a specific study about the effect of phase noises on the extraction of m-D features is carried out. The effect of phase noises on the extraction performance of the m-D features is evaluated based on the parameter of MSCR. The results of simulation experiments indicate that increasing the carrier frequency will not improve the extraction performance of micro-motion features in the case of using both the classic time-frequency analysis method and the new developed sinusoidal frequency modulation Fourier transform (SFMFT) method. Increasing the frequency of the vibration will not help to improve the extraction performance of the m-D features when using the SFMFT method. However, increasing the vibration frequency can have an improvement effect through the time-frequency method with the increase of Doppler frequency. At last the empirical formula is put forward based on which the exact value of the estimation accuracy can be calculated.
1. INTRODUCTION
The extraction of m-D features is an important means to find the characteristics of targets [1, 2]. Micro-Doppler features have been widely used to recognize the targets, and there are decades of work on the extraction of micro-Doppler features. Many studies aim at the m-D effect of ballistic targets [3–6]. In addition, most analysis methods are based on time-frequency distribution method [4–9], as some of them use the generalized Hough transform [6], Hilbert-Huang transform [7] and inverse Radon transform [8]. Micro-motion induces phase modulation in radar echo signals and is reflected in the change of the instantaneous frequency. Moreover, phase noises are the characterization of the random phase jitter of the signals and a random phase modulation which will cause the change of the instantaneous frequency of radar signals. Phase noises directly affect the extraction performance of m-D features, and current research on this is not very abundant.
Garcia-Rubia et al. have studied the moving human micro-Doppler signature in forest environments, while two continuous-wave radars at 1 GHz and 5 GHz are used to detect human motion and a time-frequency transform is applied to analyze the echo signals. The paper finally draws the conclusion that the responses from the different body parts are not easily distinguished for the 1 GHz case, and higher frequencies are preferable to identify human motion in a Doppler signature. However, with higher carrier frequency, it does not achieve the corresponding improvement effect [9]. Gu carries out an experiment based on two Doppler radars with the carrier frequencies of 2.4 GHz and 24 GHz, respectively, and the results show that when using the Doppler radar to measure the vibration target, the radar input signal-to-noise ratio (SNR) does not rise with the increase of the carrier frequency. The study explains the
Received 21 March 2018, Accepted 29 May 2018, Scheduled 21 July 2018
* Corresponding author: Bo Peng ([email protected]).
phenomenon in theory; however, the significant difference in phase noises of two carrier frequency radars should also be taken into account [10]. Yan and Wang report on the frequency stability constraints of radar target on m-D feature extraction. In the study the inverse Radon transform is used to process the time-frequency curve, and preliminary conclusions are obtained [11]. Zhou and Wang have studied the effect of phase noises on the extraction of micro-motion characteristics and concluded that the near-end phase noise within 1 kHz offset from carrier frequency has greater effects on the extraction of m-D features than that out of 1 kHz offset from carrier frequency [12].
The last two studies have been performed from the point of view of the measured data and simulation results, but lack a quantitative relationship between the model and intensity of phase noises and the micro-motion measurement, and also lack a detailed comparison of the typical micro-motion estimation methods in the respect of the sensitivity to phase noises
In this article, the oscillator phase noise model and single target micro-motion model are studied first. In order to analyze the effects of factors such as vibration amplitude and sampling rate on the extraction performance of micro-motion features, the simulation of micro-motion feature extraction is carried out using both the time-frequency analysis method and SFMFT method [13, 14]. At last, the experimental results are summarized, and the conclusion is provided.
2. METHODOLOGY OF RADAR ECHO SIGNAL ANALYSIS
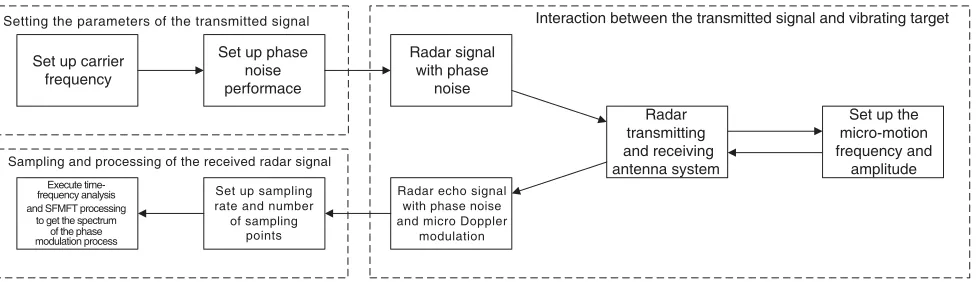
In the following text, a radar detection model which consists of a single vibrating point as a target and a single frequency continuous-wave (SFCW) radar will be set up to study the relationship between the extraction of micro-motion features and phase noises. As shown in Fig. 1, the radar observation model consists of several steps: parameters setting of the transmitted signals, interaction between the transmitted signals and vibrating targets, sampling and processing of the received radar signals. Suppose that the radar target is a single scattering point which is acting sinusoidal vibration with
vibration frequencyfV, amplitudeDV, origin phaseφ0, and distance between the vibration center and
the Radar R0, then the real-time distance between the target and radar R(t) can be as follows:
R(t) =R0+DV sin(2πfvt+φ0) (1)
Set up carrier frequency
Set up phase noise performace
Radar signal with phase
noise
Radar echo signal with phase noise and micro Doppler
modulation Set up sampling
rate and number of sampling
points
frequency analysis
Set up the micro-motion frequency and
amplitude Radar
transmitting and receiving antenna system
Setting the parameters of the transmitted signal Interaction between the transmitted signal and vibrating target
Sampling and processing of the received radar signal
Execute time-and SFMFT processing
to get the spectrum of the phase modulation process
Figure 1. Radar observation model of a single vibrating point target.
If not noted specially, the default simulation parameters in the following text will be as listed in Table 1 below.
Table 1. Default simulation parameters.
fV (Hz) 20 φ0 (rad) 0
DV (mm) 5 R0 (m) 20
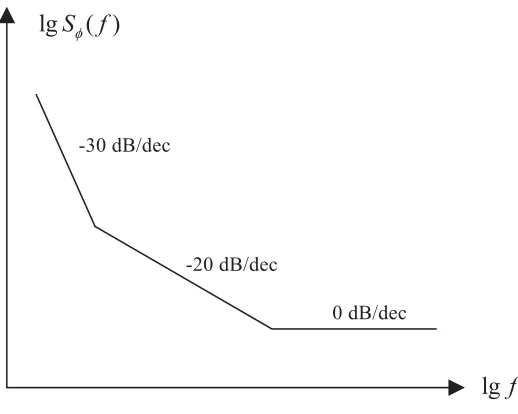
It is known from [11, 15] that in the frequency domain, the phase noise of the highly stable crystal oscillator can be described by the single side band (SSB) power spectrum density model as follows:
Sϕ(f) =k0+k2/fm2 +k3/fm3 (2)
wherefm indicates the frequency offset from the carrier frequency,k0the phase modulation white noise,
k2/fm2 the frequency modulation white noise, andk3/fm3 the frequency modulation glint noise. As shown
in Fig. 2, the SSB power spectrum density curve consists of three sections with different slopes. These characteristics can be used as references when designing the phase noise model in the remainder of this article.
lg
f
lg
S f
φ( )
-30 dB/dec
-20 dB/dec
0 dB/dec
Figure 2. A typical phase noise power spectrum model for crystal oscillator.
In addition, the slope of phase noise in the range of 100 Hz< f <1000 Hz is −20 dB/dec. It can
be concluded that as to a certain frequency source, if there are two frequency points offset from carrier
frequency fm1 and fm2, then the power of phase noise Ppn(fm) at these two frequency points of fm1
and fm2 has the following relationships:
Ppn(fm2)=Ppn(fm1)−20 (fm2= 10·fm1)
Ppn(fm2)=Ppn(fm1)−6 (fm2= 2·fm1)
(3)
As shown in Table 2, according to the rules above, the characteristics of phase noise can be defined by specifying several phase noise intensity values which decay exponentially at several specific frequencies offset from the carrier frequency.
Table 2. An example of phase noise intensity.
Offset from carrier frequency (Hz) 10 50 100 500 1000 5000 9999
Phase noise performance (dBc/Hz) −30 −54 −60 −74 −80 −94 −100
2.1. Micro-Doppler Analysis Methods for the Study of the Phase Noise Influence
Fr e q ue nc y ( H z ) Time (s)
0.1 0.2 0.3 0.4 0.5 0.6 0.7 0.8 0.9 1 -600 -400 -200 0 200 400 600 Fr e que nc y ( H z ) Time (s)
0.1 0.2 0.3 0.4 0.5 0.6 0.7 0.8 0.9 1 -600 -400 -200 0 200 400 600
0 0.2 0.4 0.6 0.8 1 1.2 1.4 1.6 1.8 2 x 10⁴
-1 -0.8 -0.6 -0.4 -0.2 0 0.2 0.4 0.6 0.8 1 Fr equ enc y U n it s
Time (×5e-5 s)
0 0.2 0.4 0.6 0.8 1 1.2 1.4 1.6 1.8 2 x 10⁴
-1 -0.8 -0.6 -0.4 -0.2 0 0.2 0.4 0.6 0.8 1 Fr equ e nc y U n it s
Time (×5e-5 s)
0 10 20 30 40 50 60 70 80 90 100 0 2000 4000 6000 8000 10000 12000 14000 16000 18000 Po w e r Frequency (Hz)
0 10 20 30 40 50 60 70 80 90 100 0 2000 4000 6000 8000 10000 12000 Po w e r Frequency (Hz)
0 10 20 30 40 50 60 70 80 90 100 0 1 2 3 4 5 6 7 8 Po w e r Frequency (Hz)
0 10 20 30 40 50 60 70 80 90 100 0 1 2 3 4 5 6 7 8 9 Po w e r Frequency (Hz)
(a) (b) (c) (d)
(e) (f) (g) (h)
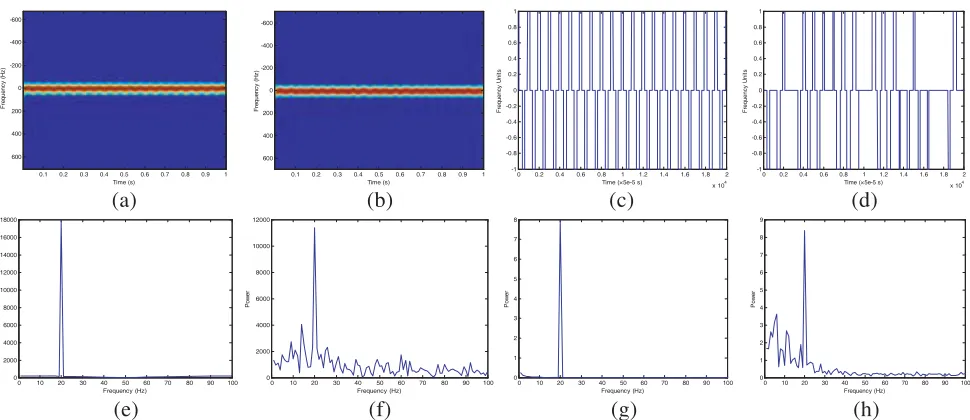
Figure 3. The analysis results include: (a) frequency analysis result without phase noise; (b) time-frequency analysis result with phase noise; (c) curve extraction result of time-time-frequency distribution without phase noise; (d) curve extraction result of time-frequency distribution with phase noise; (e) Fast Fourier transform (FFT) result of (c); (f) FFT result of (d); (g) SFMFT analysis result without phase noise; (h) SFMFT analysis result with phase noise.
A common way to practice time-frequency analysis is peak detection algorithm, which extracts the time-frequency curve and estimates the parameters on the basis of the curve. This algorithm will fail to achieve the desired effect when the amplitude of vibration is too small, which may make the extracted curve a straight line.
The SFMFT method adopts the summation of a series of sinusoidal frequency modulation
orthogonal basis to represent sinusoidal frequency modulation signals. Digital signal x(n) can be
analyzed by the SFMFT method to get the frequency spectrum of the phase modulation:
X(k) =SF MF T[x(n)] = 1
N
N−1
n=0
ln[x(n)]·(jWNnk) (4)
where the twiddle factor can be calculated by WNnk= exp(−j2Nπ). Using the SFMFT method the
parameters of the vibration target can be accurately measured even if the vibration amplitude is very small.
An experiment is carried out to validate the two methods mentioned above. The experimental conditions are listed in Tables 1 and 2, and the results of the time-frequency analysis and the SFMFT method are given in Fig. 3.
As shown in Figs. 3(a) and 3(b), the vibration of the target adds frequency modulation to the radar signal. Figs. 3(c) and 3(d) show the results of the time-frequency curve extraction, and it can be seen that there is an error in curve extraction result when the noise exists. Figs. 3(e) and 3(f) suggest the FFT results of Figs. 3(c) and 3(d), respectively, and an obvious clutter can be seen in Fig. 3(f). Figs. 3(g) and 3(h) provide the results when utilizing the SFMFT method to analyze the received radar signals. A distinct peak can be seen where the abscissa value is equal to 20 Hz in Fig. 3(e) and Fig. 3(g). Fig. 3(f) and Fig. 3(h) are obtained under the condition of phase noise, and a peak can still be seen, but there is a fading clutter which may make the extraction of the vibration frequency more difficult.
2.2. Parameter MSCR
The parameter can be calculated based on the formula below:
MSCR=10·[ln(H1)−ln(H2)] = 10·lnHH1
2
(5)
where MSCR is the micro-motion signal-to-clutter ratio (MSCR),H1 the vertical ordinate value where
the horizontal ordinate is the vibration frequency, and H2 the maximum peak value whileH1 is in the
spectrum of analysis results by FFT and SFMFT methods. Therefore, it is obvious that:
If parameter MSCR > 0, it means that the vertical ordinate value at the vibration frequency is
larger than any other peak values. For instance, the MSCR can be calculated equal to 2.29 in Fig. 3(h). In this situation the vibration frequency can be extracted from the frequency spectrum diagram without
difficulty. On the contrary, if parameter MSCR<0, the micro-motion features will not be extracted.
Because the phase noise is a kind of random noises which have a random effect on the estimation of micro-motion parameters, it should be reasonable to use the Monte Carlo method to analyze the effect of phase noise.
3. RESULTS AND DISCUSSION
3.1. Different Intensities of Ordinary Phase Noise
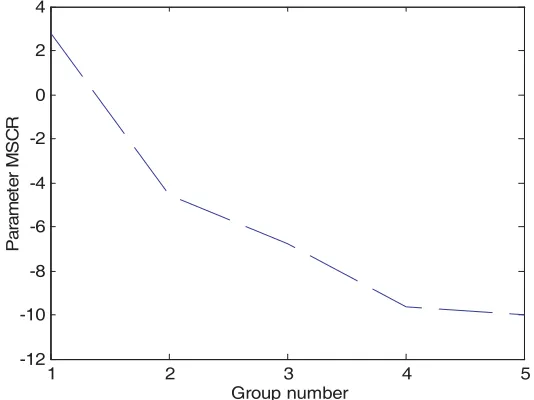
In this experiment, five different intensities of phase noise are listed in Table 3. Under each condition, the experiment is executed 1000 times, and the MSCR’s mean values in the case of using the SFMFT method are shown in Fig. 4. In addition, the experimental parameters are as listed in Table 1.
1 2 3 4 5
-12 -10 -8 -6 -4 -2 0 2 4
Group number
P
a
rame
te
r MS
C
R
Figure 4. Average values of MSCR in each group.
Table 3. Phase noise intensity performances (dBc/Hz).
Group 10 Hz 50 Hz 100 Hz 500 Hz 1000 Hz 5000 Hz 9999 Hz
1 −30 −54 −60 −74 −80 −94 −100
2 −25 −49 −55 −69 −75 −89 −95
3 −20 −44 −50 −64 −70 −84 −90
4 −15 −39 −45 −59 −65 −79 −85
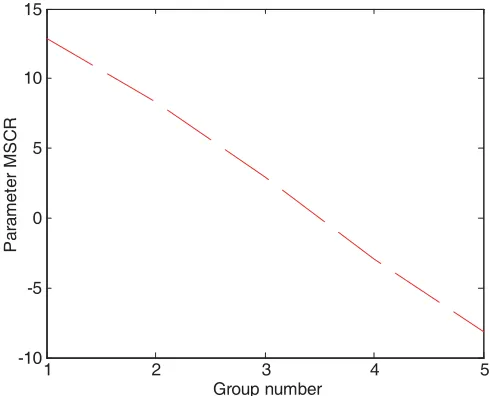
The time-frequency analysis of the received signals is also executed, and the peak extraction method is adopted to extract the time-frequency curve. Then the FFT method is applied to the curve to get the vibration frequency of the target, and the same method is also used to calculate the parameter MSCR. The trend of parameter MSCR is displayed as in Fig. 5.
1 2 3 4 5
-10 -5 0 5 10 15
Group number
P
a
ra
m
e
te
r M
S
CR
Figure 5. Average values of MSCR in each group.
As shown in Fig. 4 and Fig. 5, a decrease of the parameter MSCR along with the increase of phase noise intensity can be observed, which means that the greater the intensity of the phase noises is, the more difficult the estimation of the vibration parameters will be. Increasing the phase noise intensity can reduce the effect of micro-motion feature extraction.
3.2. Different Carrier Frequencies
According to the theories mentioned above, if a low noise frequency multiplier is used to double the frequency of the signal, the doubled signal will take some changes in the performance of phase noise
compared to the original signal. Specifically, the phase noise at the same frequency point fm will be
increased by 6 dBc/Hz.
Two independent experiments are carried out, and both have 4 different carrier frequencies, which are 1 GHz, 2 GHz, 4 GHz and 8 GHz. Parameters of these two experiments are exactly the same except the phase noise performance, and the phase noise performances in the experiments are listed in Tables 4 and 5, respectively. The vibration amplitude is 0.5 mm for experiments 1 and 2 and 5 mm for experiments 3 and 4.
Table 4. Phase noise performance of experiment 1 and 3.
Offset from carrier frequency (Hz) 10 50 100 500 1000 5000 9999
Phase noise performance of all
4 carrier frequencies (dBc/Hz) −40 −64 −70 −84 −90 −104 −110
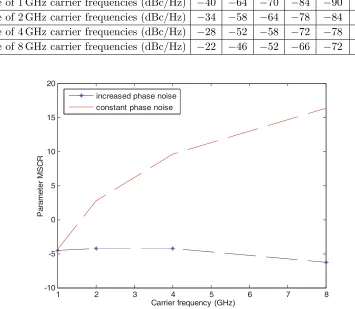
After adopting the SFMFT method to analyze the radar echo signals and execute the calculation of parameter MSCR, the experimental results of experiments 1 and 2 are shown in Fig. 6.
Table 5. Phase noise performance of experiment 2 and 4.
Offset from carrier frequency (Hz) 10 50 100 500 1000 5000 9999
Performance of 1 GHz carrier frequencies (dBc/Hz) −40 −64 −70 −84 −90 −104 −110
Performance of 2 GHz carrier frequencies (dBc/Hz) −34 −58 −64 −78 −84 −91 −104
Performance of 4 GHz carrier frequencies (dBc/Hz) −28 −52 −58 −72 −78 −85 −98
Performance of 8 GHz carrier frequencies (dBc/Hz) −22 −46 −52 −66 −72 −79 −92
1 2 3 4 5 6 7 8
-10 -5 0 5 10 15 20
Carrier frequency (GHz)
P
a
ra
m
e
te
r M
S
C
R
increased phase noise constant phase noise
Figure 6. Parameter MSCR of experiment 1 and 2 using the SFMFT method.
phase noise is constant, the extraction performance of micro-motion parameters can be improved. It also illustrates that when the carrier frequency of the signal is doubled and the phase noise performance increased according to formula (3), the value of MSCR changes little. This confirms the correctness of the phase noise mathematical model proposed previously and the assumption that as for the signal generated by the same oscillator, more frequency doubling cannot make it easier to extract the micro-motion features. Considering that the frequency multiplier will introduce new noises, the frequency doubling may even make extracting micro-motion features more difficult.
In experiments 3 and 4, the radar echo is processed by time-frequency analysis method, and the influence of the phase noise is obtained by analyzing the trend of the parameter MSCR.
In Fig. 7, the red dashed line and blue dashed line with asterisks represent the conditions of constant and increased phase noises, respectively. It can be seen from Fig. 7 that the parameter MSCR increases with the rising of carrier frequency in the case of a constant phase noise. There is little difference between the later three parameters MSCR when the phase noise increases. Even when the carrier frequency is increased up to 8 GHz, the parameter is still around 25. The result indicates that because of the increasing phase noise, more frequency doubling will not make it easier to extract the micro-motion features using the time-frequency analysis method.
3.3. Different Amplitudes of Vibration
1 2 3 4 5 6 7 8 10
15 20 25 30 35 40 45
Carrier frequency (GHz)
Pa
ra
me
te
r MS
C
R
increased phase noise constant phase noise
Figure 7. Parameter MSCR of experiment 3 and 4 using the time-frequency analysis method.
-180 -160 -140 -120 -100 -80 -60 -40 -20 0 -20
0 20 40 60 80 100 120
P
a
rame
te
r M
S
C
R
Phase noise performance (-dBc/Hz)
0.05 μm 0.5 μm 5 μm 0.05 mm 0.5 mm 5 mm
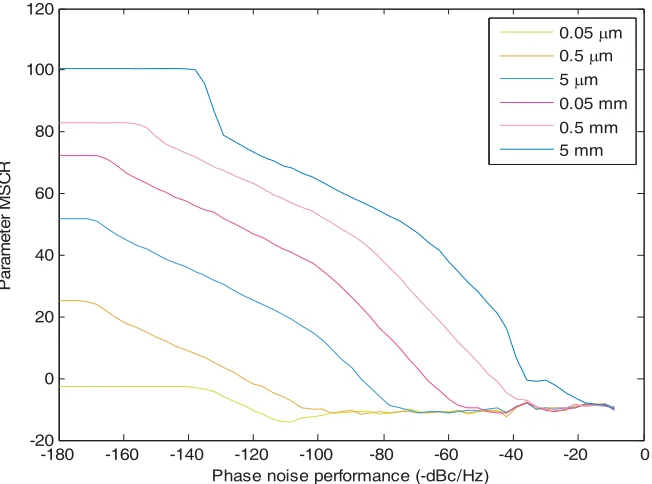
Figure 8. Phase noise intensity — parameter MSCR in each vibration amplitude using the SFMFT method.
the near end plays a major role, so the intensity of phase noise is in the form of rectangle: firstly a
boundary frequency value F is determined, then the intensity of the phase noise is set as a constant
value −AdBc/Hz in the interval from 0 to FHz offset carrier frequency, and there is no phase noise
outside this interval. The amplitudes of the target vibration are 5 mm, 0.5 mm, 0.05 mm, 5µm, 0.5µm
The figure suggests that the greater the amplitude of the vibration is, the greater the parameter MSCR is under the same phase noise intensity. It should be noted that each time the amplitude of the vibration increases by 10 times, the corresponding tolerable phase noise (intensity under which the extraction can be carried out successfully) will increase by around 20 dBc/Hz.
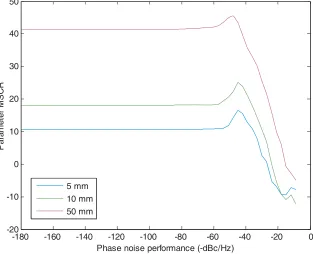
After applying the time-frequency analysis and FFT method, the analysis result can be obtained. The vibration amplitudes are set to 5 mm, 10 mm and 50 mm due to the precision constraint of the time-frequency analysis method, and the changing trend of parameter MSCR is shown in Fig. 9.
-180 -160 -140 -120 -100 -80 -60 -40 -20 0 -20
-10 0 10 20 30 40 50
Phase noise performance (-dBc/Hz)
P
a
ra
me
te
r MSC
R
5 mm 10 mm 50 mm
Figure 9. Phase noise intensity — parameter MSCR in each vibration amplitude using the time-frequency analysis method.
As shown, when the amplitude of the vibration rises, the parameter MSCR increases. This suggests that increasing the vibration amplitude can help improve the extraction performance of the micro-motion features under the same phase noise intensity.
According to the results in Fig. 8 and Fig. 9, it can be observed that the analysis performance of the SFMFT method will decrease along with the increase of phase noise intensity, and the characteristic curve shows a linear decline, but the result of the time-frequency analysis method may still keep
a constant level until the phase noise intensity is raised to a high level. This indicates different
characteristics of the two analysis methods.
3.4. Different Frequencies of Vibration
To verify the assumption that increasing the frequency of vibration can also improve the extraction performance of micro-motion, a comparison simulation with different vibration frequencies is conducted. The intensity of the phase noise is in the form of rectangle. The boundary frequency is set to 100 Hz, and the sampling frequency is 40 kHz to ensure no phase ambiguity. The result of the experiment is shown in Fig. 10.
One unanticipated finding is that when the phase noise intensity is between −80 dBc/Hz and
−40 dBc/Hz, the vibration frequency has very little effect on the trend of MSCR. It can be concluded
-120 -100 -80 -60 -40 -20 0 -40
-20 0 20 40 60 80
Phase noise performance (-dBc/Hz)
P
a
ramet
e
r M
S
C
R
10 Hz 20 Hz 40 Hz 80 Hz 160 Hz
Figure 10. Phase noise intensity — parameter MSCR under different vibration frequencies using the SFMFT method.
After applying the time-frequency analysis and FFT method, the analysis result can be obtained. The vibration frequencies are set to 10 Hz, 20 Hz, 30 Hz and 40 Hz for the resolution limitation of the time-frequency analysis method, and the trend of parameter MSCR is provided in Fig. 11.
-120 -100 -80 -60 -40 -20 0
-10 0 10 20 30 40 50
Phase noise performance (-dBc/Hz)
Pa
ra
m
e
te
r M
S
C
R
10 20 30 40
It can be seen from Fig. 11 that when the vibration frequency increases, the parameter MSCR also increases. According to the formula of Doppler frequency
fd=A·
4πfmf0cos(α)
c (6)
where fd indicates the Doppler frequency, A the amplitude of vibration, fv the vibration frequency,
and f0 the radar carrier frequency. The Doppler frequency increases along with the increase of
vibration frequency, and Doppler frequency can be detected in the time-frequency distribution results. Therefore, the increase of vibration frequency can help to improve the extraction performance of micro-motion parameters. Instead, when using the SFMFT method the difference between different vibration frequencies will not be obtained because the peak value in the spectrum will not increase with the rising of vibration frequency.
3.5. Different Numbers of Sampling Points, Sampling Rates and Time Lengths
Because the time length of observation is equal to the number of sampling points multiplied by the sampling rate, one of the variables can be controlled to be constant, and the other two variables can be changed. Three controlled experiments were set up to clarify if different sampling points, sampling rates or time lengths have any influence on the extraction performance of vibration parameters.
Notably, the intensity of phase noise is in the form of rectangle. The boundary frequency is 100 Hz,
and the power of phase noise is set to −50 dBc/Hz. The vibration amplitude is set to 0.5 mm.
Experiment 1: the sampling rate is set to a constant of 20 kHz, and the numbers of sampling points are 1000, 2000, . . . , 25000, respectively.
Experiment 2: the time length is set to 1 second, and the sampling rates are 1 kH, 2 kHz, . . . , 25 kHz, respectively.
Experiment 3: the number of sampling points is set to 10000, and the sampling rates are 1 kHz, 2 kHz, 4 kHz, 8 kHz, 10 kHz, 20 kHz, 25 kHz, 100 kHz, and 200 kHz, respectively.
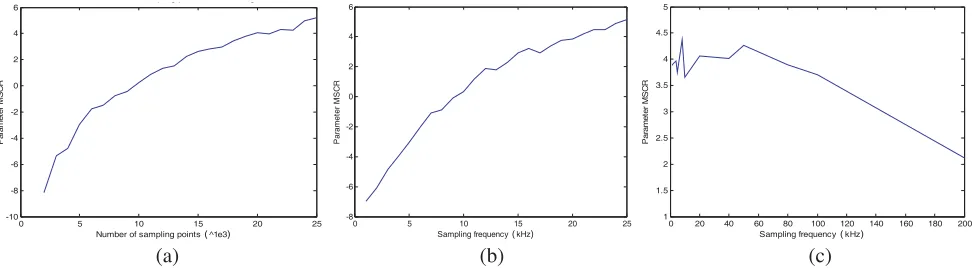
The simulation results are as shown in Fig. 12.
0 5 10 15 20 25
-10 -8 -6 -4 -2 0 2 4 6
Number of sampling points (^1e3)
P
a
rame
te
r MS
C
R
p g p g
0 5 10 15 20 25
-8 -6 -4 -2 0 2 4 6
Sampling frequency (kHz)
Pa
ra
m
e
te
r MSC
R
0 20 40 60 80 100 120 140 160 180 200 1
1.5 2 2.5 3 3.5 4 4.5 5
Sampling frequency (kHz)
P
a
ra
m
e
te
r MS
C
R
(a) (b) (c)
Figure 12. Variation tendency of MSCR using the SFMFT method.
A conclusion can be obtained through analyzing Fig. 12(a) that in the case of a constant sampling rate, increasing the number of sampling points can effectively improve the extraction of micro-motion parameters. Fig. 12(b) illustrates that regarding the constant length of time, improving the sampling rate can effectively improve the extraction performance. Fig. 12(c) suggests that when the number of sampling points is fixed, increasing the sampling rate has no contribution to the extraction performance and may even cause decrease of the parameter MSCR because of the shortening of time.
0 5 10 15 20 25 15
16 17 18 19 20 21 22 23 24
Number of sampling points (^1e3)
Pa
ra
m
e
te
r M
S
C
R
5 10 15 20 25
-5 0 5 10 15 20 25 30
Sampling frequency (kHz)
P
a
ra
m
e
te
r M
S
C
R
5 10 15 20 25 30 35 40
0 2 4 6 8 10 12 14 16 18 20
Sampling frequency (kHz)
P
a
ra
me
te
r MS
C
R
(a) (b) (c)
Figure 13. Variation tendency of MSCR using the time-frequency analysis method.
It can be seen from Fig. 13 that the same conclusion can be reached as the simulation results in Fig. 12. In a word, increasing the sampling rate when the time length is constant and increasing the time length when the sampling rate is constant could be effective to improve the extraction performance of micro-motion parameters.
3.6. Empirical Formula
In the following text, the empirical formula will be put forward. Based on this empirical formula, the exact value of the estimation accuracy under any given experimental conditions can be calculated. Since the experimental results of the time-frequency analysis and the SFMFT method differ significantly, two empirical formulas are proposed respectively.
3.6.1. Empirical Formula in the Condition of Using the SFMFT Method
When utilizing the SFMFT method to analyze the estimation accuracy, the empirical formula can be expressed as follows:
MSCR=−0.8258P + 8.3361 ln(fc) + 2.9203 ln(A)−0.0288fs+ 7.6361 ln(ps)−53.83489 (7)
where P represents the intensity of rectangular phase noise (dBc/Hz), fc the carrier frequency (GHz),
A the vibration amplitude (mm), fs the sampling frequency (kHz), and ps the sampling points (one
thousand points). Because the vibration has no effect on the analysis results of the SFMFT method,
the vibration frequency fm does not appear in the formula. Due to the logarithmic operation during
the calculation of MSCR, the parameters that have a linear promoting effect on the estimation have a
natural logarithmic symbol, such asfc,Aand ps.
When the phase noise intensity is in the ordinary form, assuming that the demarcation point of the descent rate is 100 Hz and that the rate of descent is 30 dB/dec within the points and 20 dB/dec outside the points, the empirical formula is shown as follows:
MSCR=−1.0548P + 9.8742 ln(fc) + 9.8603 ln(A)−0.0262fs−10.6114 ln(ps) + 12.7354 (8)
3.6.2. Empirical Formula in the Condition of Using the Time-Frequency Method
The empirical formula is similar to the formula of the SFMFT method except that the vibration
frequencyfm has a significant influence on the estimation results (Hz)
MSCR = −0.5819P+11.7627 ln(fc)+12.9514 ln(A)+1.2285fm−0.4456fs+10.0939 ln(ps)−76.243 (9)
MSCR = −0.509P + 9.246 ln(fc) + 7.263 ln(A) + 0.294fm−0.549fs+4.324 ln(ps)−3.196 (10)
It is challenging to define the definite boundary of the experimental parameters, but the error between the fitting value and the true value can reflect the relationship between the absolute value of the error between the parameter MSCR’s fitting value and the true value and these experiment parameters.
By analyzing the absolute value of the MSCR deviation value, we can determine the application range of the experimental parameters as follows:
Table 6. The range of the experimental parameters that make the empirical formula effective.
Terms
SFMFT method (rectangle phase noise)
SFMFT method (normal phase noise)
Time-frequency method (rectangle
phase noise)
Time-frequency method (normal
phase noise) Sampling
frequency 2–400 kHz 2–50 kHz 8–50 kHz 8–20 kHz
Carrier
frequency 0.125–16 GHz 0.125–16 GHz 0.5–32 GHz 1–32 GHz
Vibration
frequency – – 10–50 Hz 10–50 Hz
Vibration
amplitude 0.00005–0.5 mm 0.005–5 mm 5–100 mm 5–100 mm
Time frequency
window
– – Hamming,
512 points
Hamming, 512 points
Number of frequency
bins
– – 4000 4000
Phase noise intensity
−120∼ −21 dBc/Hz
−104∼ −2 dBc/Hz
−78∼ −3 dBc/Hz
−50∼ −2 dBc/Hz Number of
Sampling points
5 k–200 k 5 k–100 k 8–60 k 5–60 k
The use of experimental parameters which are far too different from the experimental conditions listed in Table 6, such as radar carrier frequency and sampling frequency, may cause invalidation of the empirical formula.
4. CONCLUSIONS
REFERENCES
1. Chen, V. C., “Micro-Doppler effect in radar: phenomenon, model and simulation study,” IEEE
Transactions on Aerospace and Electronic Systems, Vol. 42, No. 1, 2–21, 2006.
2. Chen, V. C., “Doppler signatures of radar backscattering from objects with micro-motions,” IET
Signal Processing, Vol. 2, No. 3, 291–300, 2008.
3. Gao, H. W., L. G. Xie, S. L. Wen, et al., “Micro-Doppler signature extraction from ballistic target
with micro-motions,” IEEE Transactions on Aerospace and Electronic Systems, Vol. 46, No. 4,
1969–1982, 2010.
4. Liu, L. H., D. Mclernon, M. Ghogho, et al., “Micro-Doppler extraction from ballistic missile
radar returns using time-frequency analysis,” 2010 7th International Symposium on Wireless
Communication System, 780–784, 2010.
5. Xia, S. H. and L. Zheng, “Nutation feature extraction of ballistic missile warhead,” Electronics
Letters, Vol. 47, No. 13, 770–772, 2011.
6. Pan, X. Y., W. Wang, J. Liu, et al., “Features extraction of rotationally symmetric ballistic targets
based on micro-Doppler,” Progress In Electromagnetics Research, Vol. 137, 727–740, 2013.
7. Cai, C. J., W. X. Liu, J. S. Fu, et al., “Radar micro-Doppler signature analysis with HHT,” IEEE
Transactions on Aerospace and Electronic Systems, Vol. 46, No. 2, 929–938, 2010.
8. Li, K. L. and W. D. Jiang, “Feature extraction of cone with precession based on micro-Doppler,”
2009 IET International Radar Conference, 1–5, 2009.
9. Garcia-Rubia, J. M., O. Kilic, V. Dang, Q. M. Nguyen, and N. Tran, “Analysis of moving human
micro-Doppler signature in forest environments,”Progress In Electromagnetics Research, Vol. 148,
1–14, 2014.
10. Gu, C. Z., “Analysis and experiment on the modulation sensitivity of Doppler radar vibration
measurement,”IEEE Microwave and Wireless Components Letters, Vol. 23, No. 10, 566–568, 2013.
11. Yan, H. H. and W. S. Wang, “Frequency stability constraints on micro-Doppler feature extraction
of radar target,” Chinese Journal of Radio Science, Vol. 29, No. 4, 644–652, 2014.
12. Zhou, W. G. and Q. C. Wang, “Effect of the phase noise on the characteristic of micro-motion,”
Modern Radar, Vol. 34, No. 8, 81–84, 2012.
13. Peng, B., X. Z. Wei, B. Deng, et al., “A sinusoidal frequency modulation Fourier transform for
radar-based vehicle vibration estimation,” IEEE Transactions on Instrument and Measurement,
Vol. 63, No. 9, 2188–2199, 2014.
14. Peng, B., X. Z. Wei, B. Deng, et al., “Sinusoidal frequency modulation Fourier transform and
micro-Doppler spectrum estimation of vibration vehicles,” IEEE China Summit & International
Conference on Signal & Information Processing, 626–630, 2013.
15. Staszewski, R. B., C. Fernando, and P. T. Balsara, “Event-driven simulation and modeling of phase
noise of an RF oscillator,” IEEE Transactions on Circuits and Systems, Vol. 52, No. 4, 723–733,