TABLE OF CONTENTS:
Vol. 39, No. 4, July 1986
ARTICLESPublic Lund Grazing
290 A Comparison of Average Variable Costs of Private vs. Public Land Ranches in Southeastern Montana by John R. Lacey and John P. Workman
Guard Dogs, Feral Horses, and Prairie Dogs
293 Causes and Economic Effects of Mortality in Livestock Guarding Dogs by Jay R. Lorenz, Raymond P. Coppinger, and Michael R. Sutherland
2% Foaling Rate and Survival of Feral Horses in Western Nevada by Donald B. Siniff, John R. Tester, and Gregory L. McMahon
298 Efficacy of Zinc Phosphide and Strychnine for Black-tailed Prairie Dog Control by Daniel W. Uresk, Rudy M. King, Anthony D. Apa, and Raymond L. Linder
Germination and Plant Development 300
303
310
Cold-temperature Gem&ration of Elytrigia repens X Pseudoroegneria spicata Hybrids by James A. Young, Raymond A. Evans, Douglas A. Johnson, and Kay H. Asay
Biomass Partitioning in ‘Caucasian’and ‘WW-Spar’ Old World Bluestems by P.I. Coyne and J.A. Bradford
Effects of Temperature and Presowing Treatments on Showy Menodora Seed Germination by Timothy E. Fulbright and Kay S. Flenniken
Brush Manaeement 314
320
321
An &Year Comparison of Control Methods for Wyoming Big Sagebrush in Southwestern Montana by Carl L. Wambolt and Gene F. Payne
Some Impacts of 2,4,5-T on a Mesquite Duneland Ecosystem in Southern New Mexico: A Synthesis by R.P. Gibbens, C.H. Herbel, H.L. Morton, W.C. Linde- mann, J.A. Ryder-White, D.B. Richman, E.W. Huddleston, W.H. Conley, C.A. Davis, J.A. Reitzei, D.M. Anderson, and A. Guiao
Threshold Requirements for Burning Downed Honey Mesquite by Guy R. McPherson and Henry A. Wright
331
334
338
Velvet Mesquite Seedling Development in Three Southwestern Soils by John H. Brock
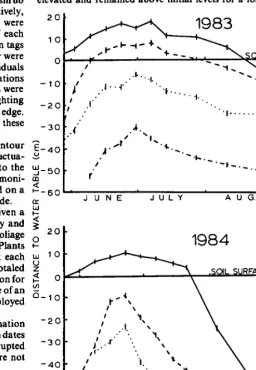
Tolerances of Sagebrush, Rabbitbrush, and Greasewood to Elevated Water Tables by David C. Ganskopp
Estimating Leaf Area of Big Sagebrush from Measurement of Sapwood by David Ganskopp and Richard Miller
Poisonous Plants
341 Toxic Nitro Compounds in Species of Astragafus (Fabaceae) in Argentina by M. Coburn Williams and Edith Gomez-Sosa
344 Utilization of White Locoweed (Oxytropis sericea Nutt.) by Range Cattle by M.H. Ralphs, L.F. James, and J.A. Pfister
Ecology
Published bimonthly-January, March, May, July, September, November
Copyright 1986 by the Society for Range Manage- ment
INDIVIDUAL SUBSCRIPTION is by membership in the Society for Range Management,
LIBRARY or other INSTITUTIONAL SUBSCRIP- TIONS on a calendar year basis are $56.00 for the United States postpaid and $66.00 for other coun- tries, postpaid. Payment from outside the United States should be remitted in US dollars by interna- tional money order or draft on a New York bank. BUSINESS CORRESPONDENCE, concerning sub- scriptions, advertising, reprints, back issues, and related matters, should be addressed to the Manag- ing Editor, 2760 West Fifth Avenue, Denver, Colo. 60204.
EDITORIALCORRESPONDENCE. concerning manu- scriptsorothereditorial matters, should beaddressed to the Editor, 2760 West Fifth Avenue, Denver, Colo. 80204.
IkSTRUCTlONS FOR AUTHORS appear on the inside back cover of each issue. A Style Manual is also available from the Society for Range Manage- ment at the above address @$1.25 for single copies; $1 .OO each for 2 or more.
THE JOURNAL OF RANGE MANAGEMENT (ISSN 0022-409X) is published six times yearly for $56.00 per year by the Society for Range Management, 2760 West Fifth Avenue, Denver, Colo. 80204. SECOND CLASS POSTAGE paid at Denver, Colo. POSTMASTER: Return entfre journal with address change-RETURN POSTAGE GUARANTEED-to Society for Range Management, 2760 West Fifth Avenue, Denver, Colo. 80204.
The Journal of Range Management serves as a forum for the presentation and discussion of facts, ideas, and philosophies pertaining to the study, management, and use of range- lands and their several resources. Accord- ingly, all material published herein is signed and reflects the individual views of the authors and is not necessarily an official position of the Society. Manuscripts from any source- nonmembers as well as members-are wel- come and will be given every consideration by the editors. Submissions need not be of a technical nature. but should be germane to the broad field of range management. Editor- ial comment by an individual is also welcome and subject to acceptance by the editor, will be published as a “Viewpoint.”
354 Weather Factors Affecting 22 Years of Tallgrass Prairie Hay Production and Quality by J. Powell, S.J. Stadler, and P.L. Claypool
Animal Nutrition
361 Cubed Alfalfa Hay or Cottonseed Meal-Barley as Supplements for Beef Cows Grazing Fall-Winter Range by R.C. Cochran, D.C. Adams, P.O. Currie, and B. W. Knapp
Soil- Water Studies
365 Short Duration Grazing in Central New Mexico: Effects on Infiltration Rates by Mark Weltz and M. Karl Wood
369 Changes in Bacterial Populations in Wyoming Mountain Streams After 10 Years by Michael R. Hussey, Quentin D. Skinner, and John C. Adams
371 Comparative Infiltration Rates and Sediment Production on Fertilized and Grazed Blue Grama Rangeland by M. Karl Wood, Gary B. Donart, and Mark Weltz 375 A Hand-Portable Single Nozzle Rainfall Simulator Designed for Use on Steep
Slopes by Bradford P. Wilcox, M. Karl Wood, John T. Tromble, and Timothy
J.
WardRanch Economics
378 Optimal Timing of Investments to Control Honey Mesquite by L. Allen Tore11 and Kirk C. McDaniel
BOOK REVIEWS
383 Systems Ecology, an Introduction by Howard T. Odum; Range Economics by John P. Workman; Physiological Ecology of North American Plant Communities, B.F. Chabot and H.A. Mooney (eds.)
Miscellaneous
326 Call for Nominations for Associate Editors 382 Position Announcements
Managlng Editor PETER V. JACKSON Ill
2760 West Fifth Avenue Denver, Colorado 80204 Edltor
PATRICIA G. SMITH
Society for Range Management 2760 West Fifth Avenue Denver, Colorado 80204 Book Ravlew Edltor GRANT A. HARRIS
Forestry and Range Management Washington State University Pullman, Washington 99164-6410 ASSOCIATE EDITORS
E. TOM BARTLETT Dept. of Range Science Colorado State University Fort Collins, Colorado 80523 G. FRED GIFFORD
Dept. of Range Wildlife, and Forestry University of Nevada
Rena, Nev. 89506 THOMAS A. HANLEY
Forestry Sciences Lab. Box 909
Juneau, Alaska 99802 RICHARD H. HART
USDA-ARS 8408 Hildreth Rd. Cheyenne, Wyoming 82009 N. THOMPSON HOBBS
Colorado Div. of Wildlife 317 W. Prospect
Fort Collins, Colorado 80526 W.K. LAUENROTH
Department of Range Science Colorado State University Fort Collins, Colorado 80523
LYMAN MCDONALD Statistics Department
College of Commerce and Industry University of Wyoming
Laramie, Wyoming 82071 HOWARD MORTON
2000 E. Allen Road Tucson, Arizona 85719 ROBERT MURRAY
US Sheep Experiment Station Dubois, Idaho 83423 DARRELL UECKERT
Texas Agricultural Experiment Station 7887 N. Highway 87
San Angelo, Texas 76901 LARRY M. WHITE
USDA ARS
S. Plains Range Research Station 2000 18th St.
Woodward, Oklahoma 73601 JAMES YOUNG
USDA ARS
A Comparison of Average Variable Costs of Private vs.
Public Land Ranches in Southeastern Montana
JOHN R. LACEY AND JOHN P. WORKMAN
Abstract
A study was conducted in southeastern Montana to determine the effects of federal range grazing on cattle ranch average variable operating costs per animal unit. Data were obtained through per- sonal interviews in 1980 with 68 ranches in six southeastern Mon- tana counties. T-tests were used to determine if the average varia- ble costs per animal unit were less on ranches that rely on federal ranges than on ranches that do not. Annual variable costs per animal unit averaged S158 and S144, respectively, for ranches obtaining O-4% and 541% of total forage from federal lands. However, this difference was not statistically significant. Regres- sion analysis did indicate that variable costs per animal unit were significantly affected by the percentage of total ranch income from crop sales.
It has been estimated that 45% of Montana’s ranchers will be out of business by 1990 and 1 in 10 is not expected to survive through 1986 (Governor’s Council on Economic Development 1985). Ranch production costs commonly exceed gross revenues.
Both ranchers and agricultural lenders need a better understand- ing of the factors that influence livestock production costs. Federal rangelands in the western US are one potentially important factor. More than half of the total land area in several western states is in federal ownership and livestock grazing has long been a major use of much of this land. A number of studies have compared grazing fees on private land with those on public land (Nielsen 1982) but little effort has been devoted to determining the effects of public land grazing on average variable costs of livestock production. If federal land grazing fees are significantly lower than private land fees, it seems likely that total variable costs per animal unit (AU) would be less on ranching operations that rely on federal ranges for a significant percentage of their total forages.
The purpose of this analysis was to determine if the average variable cost per AU is less on ranches that rely heavily on federal ranges than on ranches where federal range supplies only a small percentage of the total forage requirement. Results should be helpful to ranchers and agricultural lenders by providing addi- tional insight into the factors affecting livestock production costs.
Methods
Six counties in southeastern Montana were selected as the study area (Fig. 1). These 6 counties represent the main range livestock area served by Agricultural Research Service, Sidney, Montana, sponsor of the study (Lacey et al. 1985). Cash receipts from the sale of livestock accounted for 79% of the total agricultural earnings in that region in 1979.
Bureau of Land Management lands in southeastern Montana are generally “Section 3” lands intermingled in a checkerboard pattern with private holdings. Although FS lands in the study area are blocked into units, most National Forest permittees border the respective forests. Thus, in the study area, little livestock trucking is required by federal permitees.
Possible respondents were identified by reviewing personal Authors are extension range specialist, Cooperative Extension Service, Montana State University, Bozeman 59717; and professor of range economics, Range Science Deoartment. Utah State Universitv. Lonan 84322. At the time of the research. the senior author was graduate researc~&sisbnt, Range Science Department, Utah State University.
Manuscript accepted 16 December 1985.
Fig. 1. Map of Montana showing counties included in rhe study. property tax records in July, 1979. Names and addresses were recorded of 1,450 operators in the 6-county area who paid taxes on at least 25 head of cattle and/or 50 sheep.
A two-phase sampling technique was used. First, questionnaires were mailed to a total of 830 ranchers during May 1980. The size of these operations ranged from 50 to 2,096 animal units. In this study an animal unit was defined as one l,OOO-lb cow or her equivalent. The ranchers were asked to return the questionnaires and indicate whether they would be willing to discuss the economics of their ranching operation in personal interviews. Eighty-five cattle ranchers were then selected from among those willing to partici- pate. It should be noted that this possibly introduced some non- participant bias. Participants were interviewed during July through September, 1980. Their cattle operations ranged from 76 to 1,669 animal units. Incomplete data and/or atypical operations (those with 50% or more of their income from purebred or farming operations) made it necessary to exclude some of the personal interviews from the final analysis. Therefore, the results reported in this paper are based on data collected during personal interviews with 68 ranch operators.
Forty-six of the ranchers interviewed had BLM permits, while 6 had permits to graze on National Forests (Table 1). Three addi- tional ranchers had both BLM and FS grazing permits. Two Table 1. Number of federal grazing permits held by 68 ranches in soutb-
eastern Montana, 1979.
Agency Controlling Permit
BLM
BLM and US Fish & Wildlife Service BLM and FS
FS None
Number of Ranches
46 2 3 6 11
z
others grazed on both the Charles M. Russell Wildlife Refuge and BLM lands. The contribution of federal range to the total forage used in the ranching operations ranges from 0 to 5 1%.
The ranchers supplied production and cost data. Cost data were divided into fixed and variable costs. Fixed costs are those
related to the fixed factors of production and in this study included the opportunity cost of family labor and interest attributed to land investment. Fixed costs do not change with the level of output and cannot be avoided in the short-run. Fixed costs were not included in the analysis.
Variable costs are those associated with the variable factors of production such as purchased feed, repairs, gasoline, grazing fees, interest on operating loans, veterinary bills, and hired labor. Total variable costs increase with increases in production and decrease with reductions in output.
Variable Cost Comparison Using t-Tests
The variable costs per animal unit on 34 ranches were federal lands provided an average of 22% of total forage were compared to the variable cost per animal unit on 34 ranches where federal lands provided an average of 1% of total forage. The amount of federal forage relative to total forage ranged from 5 to 51% and 0 to 4%, respectively, for the two groups. A t-test was used to test for statistical difference between sample means of variable costs t for the two groups.
Because the above analysis examined a continuum (O-51% fed- eral forage contribution) of ranches, rather than two distinct groups (principally private vs “major” dependence on public graz- ing) a second t-test was conducted. A subsample of 34 ranches was selected from the original 68 observations. Seventeen of the ranches had 1% or less of their total forage supplied by federal range while the other 17 ranches had 18% or more. The t-test was used to determine if there was any difference in the variable costs per animal unit between the 17 ranches where federal lands pro- vided an average of 0.4Yo of total forage and the 17 ranches where the federal lands provided an average of 31% of the total forage. Linear Regression Analysis
Simple linear regression analysis was used to determine the effects of range size, relative importance of crop production, and relative importance of range forage on variable costs per AU. Average variable cost per AU was the dependent variable in each regression, while the independent variables were number of animal units, percentage of total ranch income from crop sales, and per- centage of total forage contributed by range, respectively. Each analysis included 68 observations.
Results and Discussion
Variable Cost Comparison Using t-TestsAnnual variable costs per AU ranged from $52 to $361 and averaged $151. About one-half of these costs are attributable to 4 items: supplemental feed, machine operation, equipment repair, and interest on operating capital (Table 2). Although variable costs were similar between the 2 ranch groups, costs of machine opera- tion and equipment repair averaged about $5 per AU higher on the private land ranches. Average operating loan interest per AU was also higher on the ranches with less federal range due, perhaps, to their relatively greater crop production. In contrast, average costs of supplemental feed and hired labor were higher on ranches with more federal grazing.
Total annual variable costs per animal unit averaged $157.86 for the ranches who 0 to 4% federal forage compared to $144.09 for the ranches that had 5 to 51% of their forage supplied by federal lands (Table 2). There was no significant difference in variable costs per AU between the 2 groups at the .05 level. Figure 2 illustrates that the average variable cost per AU would have had to differ by about $45 between the 2 groups for the difference to be statistically significant at the 5% level.
Similar results were obtained for the subsample comparing 34 ranches. Variable costs per AU averaged $149.16 on the 17 ranches with less than 1% of total forage supplied by federal range, com- pared to $148.20 on the 17 ranches relying on federal range for 18 to 51% of their total forage (Table 3). This difference was not statistically significant at the .05 level.
Table 2. Mean variable cost per animal unit on two group of ranches in
southeastern Montana.
Percent of Total Forage Supplied by Federal Range
Variable Cost Item’ Supplemental feed
Veterinary
Insurance
O--4% 5-51%
Dollars per AU*
24.86 30.24
(16.21) (24.40)
2.82 3.16
( 1.46) ( 2.16)
4.70 3.71
Hired labor
( 3.3 ) 8.33
Tax (personal property)
Fertilizer and seed
Machinery operating
Equipment repair
(13.26) 13.16 ( 6.46)
10.99 (13.21) 20.79 (11.93)
13.39
( 2.62) 14.77 (18.92) 13.08 ( 9.08)
6.83 (14.89)
18.81 (12.58)
10.61
Utilities
Grazing fees
Supplies
Interest (operating loan)
Miscellaneous3
TOTAL
( 8.37) ( 6.80)
4.75 4.01
( 2.99) ( 2.16)
10.81 9.10
(14.49) ( 6.59) 7.76
( 7.52) ( z::,
23.85 14.32
(19.33) (14.87)
11.65 7.01
(14.40) ( 9.70)
157.86 144.09
Wariable costs are for 1979.34 ranches in each group. 2Mean standard deviations are in parentheses,
3Miscellaneous includes contract labor, buildlng repair, irrigation, herbicide, tmns- portation and accounting.
9sxcl
0-U of tocal forage from federal taoge
5-51x of tora1 forage fror
federal range
Fig. 2. Average variable cost per AUfor two groups of Montana ranches, 1979.
Linear Regression Analysis
Ranch size (number of AU’s) did not affect variable cost per AU. The 34 ranches obtaining only O-4% of their forage from federal range averaged 420 AU, while the average size of the 34 ranches that had 5-5 1% of total forage supplied by federal range was 465 AU. Similarly, the 17 ranches in the subsample that obtained 1% or less of their total forage from federal range averaged 266 AU, compared to 409 AU for the 17 ranches obtaining at least 18% of total forage from federal range (Table 3). However, the correlation between average variable cost per AU and number of animal units was not statistically significant (probability of a larger value was .41).
Table 3. Mean variable cost per rnhnal unit, number of animal units and percent of total income from sale of livestock on two groups of ranches in southeastern Montana.
Percent of
Average Total Income
Range Group’ Cost Per Number of From Sale (Federal Forage Contribution) AU (%)* Animal Units Livestock Less than 1%
18 to 51%
$149.16 (51.60)
$148.20 409 90
(72.001 (2581 fl41
partially due to more intensive use of range improvement practices (Table 5) and partially due to differences in land productivity. Ranches with 1% federal range averaged 1 water development for
218.5
ha(695
ac) and 1.6 km (1 mi) of fence per 94.8 ha (234 ac), while ranches with 22% federal range averaged 1 water develop- ment per 311 ha (768 ac) and 1.6 km (1 mi) of fence per 112.2 ha (277 ac) of rangeland. Calf crop percentage was 88% on the ranchesTable 5. Number of hectares per range improvement unit on two groups of ranches in southeastern Montana’.
Ranch Groun* Wariable costs are for 1979; 17 ranches in each group.
ZMean standard deviations are in parentheses. Kind of Improvement
O-4% 5-51%
Federal foragege Federal forage
Livestock sales accounted for 87% of total cash receipts earned by the 68 ranches. But livestock sales accounted for 82% and 91% of the total cash receipts earned by the ranches with O-4% and 5-51% federal range forage, respectively. Therefore crop sales made a relatively larger contribution to revenues on the private land operations. In the following linear regression, coefficients were statistically significant @<.O 1) and rz = 0.41: average variable cost/AU = 117.8 + 2.5 (percent of total ranch income from sale of crops). The regression equation can be used to predict how produc- tion costs of the 2 groups of ranches were affected by percent of income contributed by crops. For each additional percent of crop income contribution, variable cost per AU would increase by $2.50. Because private land ranchers earned 9% more of their total income from crop production than did the average public rancher, their average variable costs per AU were $22.50 higher. Thus, after adjusting for differences in crop income contribution, average variable cost per animal unit was actually only $135.36 on the ranches with 0 to 4% federal forage, or about $lO/AU less than on the ranches more heavily dependent on federal range. While not statistically significant, these differences in variable costs agree with results reported by Tore11 et al. (1986) for Nevada.
Correlation between average variable cost per AU and percen- tage of total forage contributed by range was not statistically significant (probability of a larger value was .44). This non- significant correlation is surprising in view of the substantial machinery and labor costs associated with both hay harvest and hay feeding. Variability among ranches in amounts of hay har- vested and hay purchased may explain the unexpected low correla- tion of these variables.
Comparison
of
Production PracticesAlthough the differences are not statistically significant, man- agement practices may be less intense on ranches that are more heavily dependent on federal grazing permits. The average stock- ing rate was 18.9 ha (46.7 ac) of total (deeded and public) ran- ge/ AU on ranches with 22% federal forage (Table 4) compared to Table 4. Average stocking rate, calf crop pereentage and weaning weight of steer calves on two groups of ranches in southeastern Montana, 1979.’
Ranch Group* (Federal Forage Contribution) O-4%
5-51%
Stocking Rate Ha/ AU
15.7 (6.2) 18.9 (6.0)
Calf Crop %
(878.4)
;:4)
Weaning Weight
kg 202 (18.2)
IMean standard deviations are in parentheses. 234 ranches in each group.
15.7
ha(38.8
ac) of total range/AU on the ranches with only 1% federal forage. The higher stocking rate by the latter group may beWater developments
wells, springs BE reservoirs (each)
Fence (1.6 km)
Hectares
281 311
(252) (241)
94.8 112 .
(45.3) (44)
‘Mean standard deviations are in parentheses. *34 ranches in each group
with 1% federal range and 84% on ranches with 22% federal range (Table 4). Likewise, weaning weights of steer calves were 202 kg (445 lb) on ranches with little federal range and 200 kg (441 lb) on ranches more dependent on federal range allotments. Death loss of cows averaged 2.690 on both groups of ranches. Death loss of calves was 690 on ranches with little federal range and 9% on ranches more dependent on federal range.
Summary and Conclusions
A study was conducted in southeastern Montana to determine whether or not the average variable operating cost per animal unit is less on ranches that rely on federal range than on those that graze little or no federal range. Data were obtained through personal interviews in 1980 with 68 ranches in 6 southeastern Montana counties. The sample was divided into 2 groups of 34 ranches each. One group obtained from 0 to 4% of total forage from federal ranges while the second group obtained from 5 to 51% of total ranch forage from federal lands. Annual variable costs per animal unit averaged $158 for the private land group of ranches and $144 for the ranch group more dependent on federal ranges. However, this difference was not statistically significant. Analysis of a sub- sample comparing 17 ranches with less than 1% federal forage and 17 ranches with at least 18% federal forage also yielded no signifi- cant differences in average variable costs per AU. However, varia- ble costs per AU did increase significantly with the percentage of total ranch income contributed by crop sales.
Literature Cited
Governor’s Council on Economic Development. 1985. Montana Depart- ment of Agriculture in Coordination with the Montana Banker’s Associ- ation, Helena, Mont.
Lacey, John R., J. Ross Wight, and John P. Workman. 1985. Investment rationale for range improvement practices in eastern Montana. J. Range Manage. 38:2-6.
Nielsen, Darwin B. 1982. Grazing fees for public lands: what’s fair? Utah Science 43: l-5.
Torell, L. Allen. E. Bruce Godfrey, and Darwin B. Nielsen. 1986. Forage utilization cost differentials in a ranch operation: a case study. J. Range Manage. 39134-39.
Causes and Economic Effects of Mortality in Livestock
Guarding Dogs
JAY R. LORENZ, RAYMOND P. COPPINCER, AND MICHAEL R. SUTHERLAND
Abstract
We assessed causes of pre-senile mortality among working guarding dogs, and its effects on their manrgement and cost. A population of 449 livestock guarding dogs in 31 states showed no differences in mortality due to breed or sex, but dogs working on
open rangelands died more frequently (p<.OOl) than those work- ing on farms or fenced ranches. Half of the farm dogs died before they reached 38 months of age, by which time nearly three-quarters of the open rangelands dogs had succumbed. Accidents accounted for over half the deaths, culling for inappropriate behavior accounted for one-third, and diseases for 9%. High accident and culling rates in young dogs substantially increased the cost of this predator control technique. However, we found 2 main areas where corrective measures can be applied: (1) increasing the awareness among producers that accidents are a main cause of deaths especially during the dogs’ first 30 months of age; and (2) reducing the number of culls by improving the genetics of the dogs and by training producers to manage them.
Eurasian livestock guarding dogs (Canis familiaris) can reduce or eliminate predation on sheep (Ovis aries) and goats (Capra hireus) on farms and ranches in the United States (Coppinger et al. 1983a,b; Green and Woodruff 1983a). Such reduction depends on dogs being attentive and trustworthy. Dogs deficient in either of those attributes are unsuccessful.
Methods of predator control must be economical to be useful. Although guarding dogs are proving to be of reasonable cost, producers need to be aware of factors that can rapidly change the economic picture. Green et al. (1984) estimated dollar costs of guarding dogs and suggested that ability to deter predators and longevity are additional factors that influence costs relative to benefit.
We examined the effect of ability and longevity on working guarding dogs. Specifically, we looked at: (1) the duration of guarding behavior, which is partially dependent upon the life span of the dog, and (2) the percentage of dogs that show appropriate guarding behavior. The longer a dog lives, the more cost-effective it will become, because the costs of purchase and training can be amortized over a longer period. Moreover, a longer life span makes the generally ineffective juvenile months a smaller percentage of the total.
We assessed causes of pre-senile mortality among working guarding dogs, and its effects on their management and cost. In addition, we developed actuarial statistics that will assist produc- ers, researchers, veterinarians, and breeders in keeping track of the age structure of a population of working guardians, and in plan- ning for replacement animals.
Authors are extension specialist, Oregon State University, Corvallis 97331; profes- sor of biology, Hampshire College, Amherst MA 01002; and associate professor of statistics, University of Massachusetts, Amherst 01003. Reprint requests should be sent to Coppinger.
The Geraldine Rockefeller Dodge Foundation provided funding toward the under- standing and improvement of guarding dogs in the U.S. Funding for establishment, maintenance, and research at Hampshire College of the Livestock Dog Project was provided by the Rockefeller Brothers Fund, the U.S. Department of Agriculture (USDA/SEA #59-2259+2-l 19-O), the U.S. Department of Interior (FWS 14-16- 0009-84-924). and Control Data Corporation to Dr. Coppinger. The college contrib- uted financial and administrative support, plus kennel and pasture space. The Anato- lian Shepherd Dog Club of Alpine, California, supported the acquisition of dogs from Turkey. We appreciate the informative reports from or cooperating sheep producers and their time spent working with the dogs. The Statistical Consulting Center and the Pcademic Computing Center at the University of Massachusetts provided assistance m data analysis; other technical assistance was provided by Lorna Coppinger.
Manuscript accepted 4 November 1985.
JOURNAL OF RANGE MANAGEMENT 39(4), July 1986
Materials and Methods
We observed mortality of a population of 449 dogs (80 litters). Our sample represented the total population of livestock guarding dogs placed during 1978-1983 on cooperating farms and ranches under the auspices of Hampshire College’s Livestock Dog Project. They were offspring of imported working dogs from Europe and Asia Minor: 120 Turkish Anatolian Shepherd Dogs, 74 Yugosla- vian Shar Planinetz, 56 Italian Maremmas, I2 Portuguese Castro Laboreiros, and I83 crosses between the above breeds. Four Tibe- tan Mastiffs donated by breeders were also included. Pups were born between April 1978 and December 1983. Their ages ranged from 7 to 72 months.
Pups were born and raised with sheep at Hampshire College, at Coppinger’s farm, or in several cases on cooperating farms, remaining there for 6 to I2 weeks until they were placed with sheep producers. Two hundred and sixty producers in 3 I states partici- pated. All cooperators were volunteers; all had commercial flocks. They raised sheep under 3 different systems of management: (1) ranch (open range with flocks usually greater than 750ewes with or without continuous shepherding); (2) farm (fenced pastures with more than 15 ewes); and (3) farm/ ranch (large fenced pastures of a section or more or a combination of fenced pasture and open range, supporting usually over 500 sheep). Producers were given written and verbal instructions on care and training of their dogs. We encouraged them to telephone us to discuss any problems.
We defined mortality as the end of a dog’s activity as a livestock guardian, for any reason. Pre-weaning mortality was not included in the mortality count. Causes of death were categorized as:
a) accident: unintentional loss of a healthy dog, usually trau- matic, but including dogs missing for unknown reasons; b) cull: a dog removed due to lack of attentiveness or
trustworthiness;
c) disease: a fatal health problem (pathogenic, parasitic or congenital), whether it was preventable or not.
Composite life tables and survivorship curves were calculated on age-specific data using the Life Tables and Survivor Functions program (BMDPIL; Dixon and Brown 1979). Typically, life tables and survivorship curves are calculated using the total number of individuals living to each age interval. We used 6-month age inter- vals; the mortality in each interval was computed as the ratio of the number of dogs that died in the interval divided by the number alive at the beginning of the interval. Survivorship was expressed in terms of a cohort of 1,000 dogs.
Results and Discussion Mortality
During the 6 years of this study, 216 of 449 dogs were lost. Accidents and culling were the predominant causes of mortality. Although livestock management influenced mortality @<.OOl; Table I), breed and sex did not.
Survivorship curves (Fig. 1) for working guarding dogs resembled those of wild animal populations with high mortality in the early years. The semi-annual mortality rate was 13% before 30 months of age and about 5% thereafter. Age of death in this study was overwhelmingly a product of accidents and culling, with disease (especially age- or breed-related diseases) having virtually no effect on population structure. Most studies on longevity in dogs have been done on kennel dogs where accidents and culling were rare
Table 1. Causes of mortality of 449 livestock guarding dogs born 1978-1982, by type of management system.
Management system Sample size Accident
Farm 224 48
Farm/ Ranch 122 33
Ranch 83 43
Total 449 124
Cull Disease Total dead
41 11 100
18 4 55
13 5 61*
72 20 216
Percent of total dead
.41 .45 .73*
Al
(Comfort 1956, 1960), or have been specifically concerned with susceptibility of breeds to disease. Therefore it is not known if the dogs in our particular sample are generally representative of domestic dogs. Bronson’s (1982) study of necropsy data on 56 breeds and crossbreeds showed a variation in mean age of death from 3.0 to 9.9 years. Comfort (1960) reported that mastiffs and wolfhounds lived considerably shorter (means of 6 and 7 years, respectively) than spaniels and Pekinese (11 and 12 years). The survivorship curve for guarding dogs on farms and farm/ ranches fell in between the curves for kennel dogs given by Comfort (1960) and for a population of stray dogs in Baltimore (Beck 1973). Management
Mortality on ranches exceeded mortality on farms and farm/ - ranches (Breslow Test, p<.OOl; Fig. 1). Because mortality rates
900 8 0 800 & 2 700
4 6oo $ 500 9 5 400 f 300 200
FARM 8 FARM-RANCH - F/ FR, NO CULLS RANCH
loot-
j
OFI
”
”
”
”
’
I
0 1 2 3 4 5 6 7 8 9 10 11
AGE (YEARS)
Fig. 1. Survivorship of livestock guarding dogs.
Of the 72 dogs that were culled, 44 (57%) had injured or killed livestock, 8 (11%) were inattentive to livestock, 5 (7%) bit people, and 5 (7%) were culled for a combination of reasons. Culling accounted for one-third of all deaths. Ninety percent of culling occurred before. age 30 months. On farms and farm/ ranches, cul- ling reduced the age at which half the dogs were dead (from 52 months to 38 months). However, ranchers tended to cull more heavily than did farmers; 37% of culled dogs were on ranches, 22% on farms and farm ranches. Inspection of the data indicated no differences due to breed or sex.
were virtually identical on farms and farm/ranches, these data were combined for comparison with ranches. The semi-annual mortality rate for the first 30 months was twice as high on ranches (22%) as on farms and farm/ ranches (11%). However, after 30 months of age, dog mortality was similar in all systems of management.
Noxious behaviors appeared to have both genetic and environ- mental components. Seven litters out of the 80 accounted for one-third of the culls. Several notable cases involved similarities in unacceptable behavior among littermates that had been placed during infancy in geographically separate areas. Also, the offspring of one sire bred to four dams (producing 5 litters) had a cull rate of 2.5 times greater than the average.
On ranches, 5% of the dogs were dead by 18 months of age, Further study of management techniques and early guardian compared with 38 months on farms and farm/ranches. Survivor- behavior, with a goal of increasing both trustworthy and attentive ship on ranches slightly exceeded that of stray dogs in an urban behavior, should help to identify breeding and training methods environment (Beck 1973). In fact, barely half of the dogs reached that will lead to reductions in culling. For example, untrustworthy working age (about 12 months). The lack of human support in dogs often exhibited a high frequency of play behavior, and were remote areas may have contributed to early deaths, but we sus- often noted to be overfed and overweight. This disposition for pected a correlation between the high rate of accidents between 6 “extra”play may be reflective of a diet too high in calories (Muller- and 30 months and the occurrence of behavioral problems such as Schwarze et al. 1982). Also, the work of several investigators
294
hyperactivity, untrustworthiness and inattentiveness (Coppinger and Coppinger 1980, Coppinger et al. 1983b). High frequencies of investigatory and play behavior associated with development of puppies and with migratory range flocks may have resulted in higher accidental losses. These losses were particularly severe among inattentive dogs. On farms, producers tended to cull untrustworthy dogs, but not inattentive ones. On the range, inat- tentive dogs were more likely to become lost or killed.
In all management systems the semi-annual death rate decreased to about 5% after 30 months, indicating that survivors had learned to avoid dangers, or ontogenetic changes had occurred that reduced the likelihood of accidents, or behavioral misfits had been eliminated.
Accidents
We noted several causes of accidental deaths: 40 dogs (32%) disappeared; 38 (31%) were hit by vehicles; 17 (14%) were mali- ciously shot; 11 (9%) were poisoned; and 18 (1590) were lost to other causes. Half of the deaths of dogs placed on ranches were accidental, compared with 27% on farm/ranches and 19% on farms. We suspected that dogs that disappeared or were poisoned were often victims of other forms of predator control (trapping, gunning, or poisoning). Dogs were sometimes shot because friends or neighbors were not aware that the dog was supposed to be with the sheep. Guarding dogs tended not to chase cars; most of the vehicle deaths occurred in young dogs in the farmyard. Dogs hit by vehicles or lost were often displaying inattentive behavior and might otherwise have been culled later. Eighty-six percent of accid- ental deaths occurred before age 30 months.
CUlBIlg
suggests that the ability to form cross-species social attachments is an inherent ability of all dogs (Cairns 1966, Tomlinson and Price 1980, Black 198 1). The species to which a dog forms an attachment and the strength of that attachment is partly dependent on social contacts during critical developmental stages (Scott and Fuller 1965).
DiWMt?
Disease had minor influence on survivorship. Only 20 dogs died of disease. Two were known victims of heartworm while 4 others died of complications due to intestinal parasites. Two young dogs died of parvovirus and 2 l-year-old dogs died of heat stroke. One dog had a persistent urinary infection and was destroyed; one was diagnosed as having San Joaquin Valley Fever; one had a rare blood bacteria; the rest were undiagnosed.
Disease problems likely will increase as the population reaches senescence, but at the present mortality rate, few dogs will reach old age. Whether senescence and the end of working life are coinci- dent is yet unknown. It seems reasonable to expect a lo-year working life.
Economic Effect of Early Mortality
Early death reduced the effectiveness of these dogs and raised their cost substantially. The cost of a dog includes purchase price, transportation, feeding, veterinary care and all other expenses incurred during its life. The benefit of the dog is in the number of livestock saved during its lifetime. Black (1981) suggested that the use of mongrel dogs would reduce acquisition costs. However, Fig. 2 illustrates that such costs are minor relative to costs of yearly maintenance. Presently, purchase price of a Eurasian guarding dogs equals cost of 1 or 2 years of maintenance. Purchase price substantially influences net cost of the dog only if it dies prema- turely. Not only does an early mortality exaggerate the purchase price but it sharply decreases the benefit of the dog.
The cost per working year of a dog was computed with the formula:
P+AC A-l
where P q purchase price plus any additional first year costs such as transportation, health certificates, immunizations;
A q age of dog (A-l accounts for the essentially in- effective puppy year);
C q average annual cost.
L 1
3200 2900 2600 2300 2000
MULATIVE
500 - 200 -
I I I I I I I I I
0 1 2 3 4 5 6 7 8 9 10
YEARS USEFUL SERVICE
Fig. 2. Cost of livestock guording dogs over time.
The cost per year decreases the longer a dog lives (Fig. 2), mainly because the purchase price is amortized over a longer period. Values for P of $300 and for C of $260 were based on McGrew and Andelt’s (1985) study of 19 commercially-obtained dogs working in Kansas. For example, the cost of an 1 l-year-old dog (10 effective years) is $3,160; the average cost of those 10 working years is $3 16/year. However, if a farm dog lives only 3 years, then the cost per working year rises to $540. Ranch dogs living to only 18 months raise the cost per working year to $1,380. Although the rancher hasn’t actually paid out that many dollars, he would require 2 dogs to get 1 whole year’s service. Thus, a producer who guards against accidents and spends time to train the dog achieves substantial savings.
Very few lambs have to be saved by a dog in order to justify a $300 yearly cost. Perhaps 10 lambs or less per year would suffice, depending on the value of lambs. Many dogs have actually saved many more than this (Coppinger et al. 1983a, Green et al. 1984). If Figure 1 represents a “normal” survivorship for livestock guarding dogs, a producer can use it to calculate the probability of his dog dying at any age. We emphasize that whenever a producer depends on dogs for protecting livestock, he or she needs a con- stant source of replacement animals. We also stress the importance of producers caring for their dogs. If all dogs lived to their 1 lth birthday, then in every cohort of 1,000 dogs, the sheep industry would get 10,000 dog-years of service (subtracting the juvenile first year). Although ranchers on open range got only 2,300 dogs-years (23% of the potential), farmers were getting 3,800 dog-years (38% of the potential). Good breeding stock, properly raised and pro- tected from accidents, could increase these percentages.
Literature Cited
Beck, A. 1973. The Ecology of Stray Dogs. York Press, Baltimore. Black, H.L. 1981. Navajo sheep and goat guarding dogs: a new world
solution to the coyote problem. Rangelands 3:235-237.
Bronson, R.T. 1982. Variation in age at death of dogs of different sex and breeds. Amer. J. Vet. Res. 43:2057-2059.
Cairns, R.B. 1966. Development, maintenance, and extinction of social attachment behavior in sheep. J. Comp. & Physiol. Psychol. 62:298-306. Comfort, A. 19%. Longevity and mortality of Irish wolfbounds. Proc.
Zool. Sot. London 127~27-34.
Comfort, A. 1960. Longevity and mortality in dogs of four breeds. J. Gerontology 15126-129.
Coppinger, R., and L. Coppinger. 1980. So firm a friendship. Natural History 89: 12-26 (March).
Coppinger, R., J. Lorenz, and L. Coppinger. 1983a. Introducing livestock guarding dogs to sheep and goat producers: p. 129-132 In: D.J. Decker, ed. Proc. First Eastern Wildl. Damage Control Conf., Cornell Univer- sity, Ithaca.
Coppinger, R., J. Lorenz, J. Glendinning, and P. Pinardi. 1983). Atten- tiveness of guarding dogs for reducing predation on sheep. J. Range Manage. 36275-279.
Dixon, W.J., and M.B. Brown, eds. 1979. BMDP Biomedical Computer Programs. Univ. of Calif. Press, Berkeley.
Green, J.S., and R.A. Woodruff. 1983a. Guarding dogs protect sheep from predators. U.S. Dep. Agr. Info. Bull. No. 455.
Green, J.S., and R.A. Woodruff. 1983b. The use of Eurasian dogs to protect sheep from predators in North America: a summary of research at the U.S. Sheep Experiment Station: p. 119-124 In: D.J. Decker, ed. Proc. First Eastern Wildl. Damage Control Conf., Cornell University, Ithaca.
Green, J.S., R.A. Woodruff, and T.T. Tueller. 1984. Livestock guarding dogs for predator control: costs, benefits, and practicality. Wildlife Sot. Bull. 1244-50.
MeGrew, J.C., and W.F. Andelt. 19115. Livestock guarding dogs-a new method for reducing livestock losses. Kansas State Univ. Coop. Ext. Serv. MF 713, Manhattan Kans.
Muller-Schwarze, D., B. Stagge, and C. Muller-Schwarxe. 1982. Play behavior: persistence, decrease, and energetic compensation during food shortaae in deer fawns. Science 215:85-87.
Scott, J.F., and J.L. Fuller. 1965. Dog behavior. Univ. of Chicago Press, Chicago.
Tomlinson, K.A., and E.O. Price. 1980. Establishment and reversibility of species affinities in domestic sheep and goats. Animal Behavior 28:325-330.
Foaling Rate and Survival of Feral Horses in Western
Nevada
DONALD B. SINIFF, JOHN R. TESTER AND GREGORY L. MCMAHON
Abstract
Foaling and mortality rates of known-age feral horses equipped with radio transmitters were obtained in 1981 and 1982 for 2 areas in Nevada. These data showed considerable annual variation. In one area, 45% of the mares produced foals in both years while only 10% produced foals in the other area. Foal mortality ranged from 2% to 33%. Both the highest mortality (33% in 1981) and the lowest (2% in 1982) occurred in the same area. The cause for this apparent inconsistency was unknown. The highest age-specific reproductive rates occurred in 5 to 10 year-old mares.
Few data on feral horse survival and foaling rates are available in the literature. Foaling rates have varied considerably from one area to the next and among age classes. For mares 4 years and older the rate varies from 42% to 78% (Tyler 1972, Welsh 1975, Feist and McCullough 1975, Keiper 1979, Nelson 1979, and Boyd 1980). Foal survival was reported by Feist and McCullough (1975) from birth in the spring until 1 November at 89%, with Boyd (1980) estimating foal survival at 82% for the first year of life.
This paper reports foaling and mortality rates of known-age marked mares in 2 feral horse populations. The study was con- ducted during 1981 and 1982 in western Nevada.
Study Areas and Methods
The Pah Rah Mustang Area of 74,460 ha, northeast of Sparks, Nevada, had a feral horse population estimated by mark-recapture techniques using known transmittered animals as the marked sam- ple, at 800- 1,000 individuals during this study. The area has rugged topography with a maximum elevation of 2,590 m, 1,067 m above the valley floor. It is dissected by numerous canyons. Most of the area is dominated by sagebrush (Artemisiu spp.) and rabbitbrush (Chrysothamnus spp.) with smaller areas dominated by cheatgrass (Bromus tectorum) and various annual forbs.
The 130,364-ha Pine Nut Mountain Range east of Carson City, Nevada, is also rugged topographically with a maximum elevation of over 2,900 m. The feral horse population was estimated, again by mark-recapture techniques using known transmittered animals as the marked sample, at 7OC-1,000 individuals. Vegetation there was predominantly pinyon-juniper (Pinus monophylla-Juniperus osteosperma), with smaller areas dominated by rabbitbrush and sagebrush.
Numbered collars with and without radio transmitters were placed on 48 horses in 1980-81 and 41 more in 1982 for the Pah Rah area, and 51 in 1980-81 and 29 more in 1982 for the Pine Nut area. All collars were constructed of lo-cm-wide, 3-ply white food conveyor belting. The white belting was tapered to 3.8 cm wide in the area under the neck to minimize wear and irritation. All collars were numbered with 5.0 X 7.6-cm orange or yellow cattle tags. Radio transmitters placed on horses during 1980 and 1981 had an estimated battery life of 2 years while the 1982 transmitters had an expected life of 4 years.
Horses collared in 1980-8 1 were captured using conventional Bureau of Land Management gathering techniques with helicop-
The authors are two professors and a former graduate student in the Department of Ecology and Behavioral Bioloav. Universitv of Minnesota. Minneatmlis 55455. The resear& was part of a project-& evaluatibn of census techniques’for feral horses funded bv BLM contract AA851-CTO-52. We are erateful to Bureau of Land Man- agement personnel of the Carson City District Gho provided invaluable help in captureand collaring of horses. T. Owen, T. Reuwsaat, P. Anderson, D. Pomi, and B. Stewart assisted throughout the project. M Frei, Nevada State Office, provided valuable guidance and support.
Manuscript accepted 14 November 1985.
296
ters. Horses collared in 1982 were immobolized from helicopters with a Rompun-M99 combination (Seal et al. 1985). All were aged by standard tooth wear criterion by veterinarians or persons knowledgeable about horses during the handling process. There was probably some error associated with these readings but designed tests of precision were not possible. However, such errors would be small in the calculation of rates.
Most foal and mortality observations were made during census flights on the study areas. The typical procedure involved a heli- copter flight of the area during which all collared horses that were encountered during the flight were noted and their foaling status was observed. We found it more cost effective to conduct follow-up flights using a Piper Supercub to locate radio-collared horses missed during the helicopter flight. This was meant to maximize sample size and detect any mortality or tag loss that might have occurred. On a few occasions, only the Supercub was used to make observations. Flights were conducted on 5 May, 3 July, and 7 September in 1981, and 6-7 May, 2 July, 27 July, and 19 Sep- tember in 1982 for the Pah Rah areas, and 7-8 May, 2-3 July, and 21 July in 1981, and 20-22 May, 2-3 July, 28 July, and 18 Sep- tember in 1982 for the Pine Nut Mountains.
Ground observations were made during both 1981 and 1982 to confirm aerial observations and to increase the sample size of observed horses. These observations were made from horseback, vehicles, and on foot.
It should be emphasized that foaling and foal mortality rates represent minimum estimates. Given the frequency of observa- tions, it is possible that a mare could have foaled and the foal died in the time period between observations. If this occurred, the mare would have been recorded as having never foaled and the foal mortality would have been missed.
Results and Discussion
Foaling rates were comparable for both years on the Pah Rah Mustang Area (Table 1). On the Pine Nut Mountains, foaling appeared lower in 1982 than in 1981 but was not significantly so at the .05 level (Chi-square criterion). Since there were no statistical differences between years within areas, the data were pooled across years for each area and tested for differences between areas. Foal- ing rates were significantly greater on the Pah Rah than the Pine Nut area (Chi-square criterion, p<.Ol). On the Pah Rah area 45% of the observed mares foaled both years while only 10% foaled both Table 1. Foaling summary for Pine Nut Mountain and Pnb Rab Mustang
areas in western Nevada for 1981 and 1982.
Females Foals Foaling Rate Foal Mortalities Foal Mortality Rate
Females Foaling Both Years Females Foaling 1 of 2 Years Females Not Foaling
Either Year
Pine Nut Pah Rah 1981 1982 1981 1982
38 66 39 70
20 20 25 48
.53 .30 .64 .69
3 2 8 1
.15 .10 .33 .02
3 (10%) 13 (45%) 18 (62%) 10 (34%)
8 (28%) 6 (21%)
l5
172
3
4
5
6
7
8
9
10
11
12+
AGE CLASS
Fig. 1. Age-specificfoaling ratesfor 1981 and 1982. combined, on the Pah Rah Mustang and Pine Nut Mountain areas in western Nevada. Numbersabove bars indicate sample sizes.
years on the Pine Nut Mountains. Foal mortality rates, however, ranged from 2 to 33% over the 2 years on the Pah Rah area but from only 10 to 15% on the Pine Nut area (Table 1).
Age-specific foaling data combined for 1981 and 1982 (Fig. 1) reveal that the highest reproductive rates occurred in 5-to IO-year- old mares on both areas. Data for both years are pooled in Figure 1 because our sample sizes would have been too small to consider annual age-specific reproductive rates during each year individu- ally. The fact that one 2-year-old mare had a foal indicates that this age class can reproduce. It is also important to note that mares 12 years and older had reproductive rates of 64 and 43% on the Pah Rah and Pine Nut areas, respectively.
One radio-marked adult mare was found dead on each area during each of the years. On the Pine Nut Mountains both individ- uals were over 12 years in age while on the Pah Rah Mustang Area mares aged 8 and 9 years were found dead. Scavengers and decom- position made it impossible to determine the cause of mortality.
Adult female mortality rates can be estimated from the number of radio-collared females observed. For the Pah Rah Mustang Area, during 1981, 1 mortality was observed for 25 radio-collared females (4%) while only 1 mortality was observed for 56 radio- collared females (2%) during 1982. On the Pine Nut Mountains, during 198 1,l mortality was observed for 22 radio collared females (4%) and during 1982 only 1 mortality was observed for 50 females (2%). Observations were from the entire year of 198 1 but only the first 9 months of 1982.
Differences in foaling rates between the Pah Rah Mustang Area and Pine Nut Mountains may be related to differences in ecological range conditions between these areas. Bureau of Land Manage- ment studies (Dept. of Interior 1982, Reno grazing environmental impact statement. Draft. BLM Carson City District, Nevada) indi- cate that the ecological range condition in the Pine Nut Mountains is mostly classified as poor. Eighty-three percent of the area was in the poor classification while 13% was listed as fair and 4% as good. On the Pah Rah Mustang Area, only 37% of the area was listed as poor while 44% was fair and 19% was good. While we have no evidence that these figures relate to range quality for horses, we feel some relationships may exist, and thus further study may be JOURNAL OF RANGE MANAGEMENT 39(4), July 1986
indicated.
Eberhardt et al. (1982) indicated annual population growth rates of 20% from the Beaty’s Butte and Jackie’s Butte herds in south- eastern Oregon. The population statistics for foaling rates and survival on the Pah Rah area are similar to the findings of Eber- hardt et al. (1982); however, the rate of increase on the Pine Nut area is much lower than they reported for their study areas in Oregon.
It is important to note the wide range of spatial and temporal variability in the data from our 2 study areas, which are approxi- mately 30 miles apart. With the extreme values of 69% of mares foaling and 2% foal mortality, population increase could be dra- matic. Conversely, a foaling rate of 30% with 10% foal mortality results in a much slower increase. While the explanation for this variability is unknown, it may be related to food resources. Such high variability over a small temporal and spatial scale indicates that caution must be exercised in extrapolating demographic data on feral horse herds to large geographic areas or over long time spans.
Literature Cited
Boyd, L.E. 1980. The mare-foal demography of feral horses in Wyoming’s Red Desert. P. 185-204. In: R.H. Denniston, ed. Symposium on the Ecology and Behavior of Wild and Feral Equids. Univ. Wyoming, Laramie.
Eberhnrdt, L.L., A.K. Majorowicz, and J.A. Wilcox. 1982. Apparent rates of increase for two feral horse herds. J. Wildl. Manage. 46:367-374. Feist, J.D., and D. McCullough. 1975. Reproduction in feral horses.
Reprod. Fertil. 23:13-18.
Keiper, R.R. 1979. Population dynamics of feral ponies. P. 175-183. In: R.H. Denniston, ed. Symposium on the ecology and behavior of wild and feral equids. Univ. Wyoming, Laramie.
Nelson, K.J. 1979. On the question of male-limited population growth in feral horses (Equus caballus). M.S. Thesis, New Mexico State University. Seal, U.S., D.B. Siniff, J.R. Tester and T.D. Williams. 1985. Chemical immobilization and blood analysis of feral horses (Equus caballus). J. Wildl. Disease 21:411-416.
Tyler, S.J. 1972. The behavior and social organization of the New Forest ponies. Anim. Bchav. Monog. 5:85-196.
Welsh, D.A. 1975. Population, behavioral, and grazing ecology of the horse of Sable Island, Nova Scotia. Ph.D. Diss., Dalhousie Univ.


![Fig. 5. Comparison of relative growth rate of totalplant biomass [(I! Wp) (d Wpldt). g day-‘g-l], leaf blade area ratio [Ab/ Wp](https://thumb-us.123doks.com/thumbv2/123dok_us/1863335.1242185/23.617.17.263.23.363/comparison-relative-growth-totalplant-biomass-wpldt-blade-ratio.webp)