INFLUENCE OF CULTURAL PRACTICES ON TOURISM DEVELOPMENT IN BARINGO COUNTY, KENYA
DIANA J. CHEBOTIBIN (B.Sc.) T129/OL/CTY/28788/2014
A THESIS SUBMITTED IN PARTIAL FULFILLMENT OF THE
REQUIREMENTS FOR THE AWARD OF THE DEGREE OF
MASTER OF SCIENCE IN INTERNATIONAL TOURISM
MANAGEMET IN THE SCHOOL OF HOSPITALITY AND
TOURISM OF KENYATTA UNIVERSITY
ii
DECLARATION Student declaration
This thesis is my original work and has not been presented for a degree in any other University.
Signature_____________________ Date _______________ Name: Diana J. Chebotibin
Reg No: T129/OL/CTY/28788/2014
Supervisors’ declaration
This thesis has been submitted for review with our approval as University supervisors.
Signature _____________________ Date _____________________ Dr. Esther Munyiri
Department of Tourism Management. Kenyatta University
Signature _____________________ Date _____________________ Ms.Jane Bitok
iii
DEDICATION
iv
ACKNOWLEDGEMENT
v
TABLE OF CONTENTS
DECLARATION ... ii
DEDICATION ... iii
ACKNOWLEDGEMENT ... iv
LIST OF TABLES ... x
LIST OF FIGURES ... xii
ABBREVIATIONS AND ACRONYMS ... xiii
OPERATIONAL DEFINITIONS OF TERMS ... xiv
ABSTRACT ... xvi
CHAPTER ONE: INTRODUCTION ... 1
1.1 Background of the Study ... 1
1.2 Statement of the Problem and Justification ... 3
1.3 Purpose of the Study ... 5
1.4 Objectives of Study ... 5
1.4.1 General Objective ... 5
1.4.2 Specific Objectives ... 5
1.5 Research Hypotheses ... 6
1.6 Significance of the Study ... 6
1.7 Scope of the Study ... 7
1.8 Limitation of Study ... 7
1.9 Basic Assumption of the Study ... 8
1.10 Conceptual Framework and Measurement of Variables ... 8
CHAPTER TWO: LITERATURE REVIEW ... 11
2.1 Introduction ... 11
vi
2.3 Customs and Artifacts and Tourism Development ... 13
2.4 Traditional Rituals and Tourism Development ... 14
2.5 Cattle Rustling and Tourism Development ... 15
2.6 Dependency Theory ... 16
2.7 Modernization Theory ... 17
2.8 Critique of Literature ... 18
2.9 Research Gap ... 19
2.10 Summary of the Chapter ... 20
CHAPTER THREE: RESEARCH METHODOLOGY ... 21
3.0 Introduction ... 21
3.1 Research Design ... 21
3.2 Study Area ... 22
3.3 Target Population ... 22
3.4 Sample and Sampling Technique ... 23
3.5 Research Instruments ... 26
3.6 Pre testing ... 27
3.6.1 Validity Test ... 27
3.6.2 Reliability Test ... 27
3.7 Data Collection Techniques ... 28
3.8 Data Analysis ... 29
3.9 Ethical Consideration ... 30
CHAPTER FOUR: RESEARCH FINDINGS AND DISCUSIONS ... 31
4.1 Introduction ... 31
4.2 Response Rate ... 31
4.3 Demographic Information for the Respondents ... 32
vii
4.3.2 Age of the Respondents ... 33
4.4.3 Level of Education of the Respondents ... 34
4.4 Objective One: Influence of Cultural Festivals on Tourism Development ... 35
4.4.1 Descriptive Statistics on Influence of Cultural Festivals ... 35
4.4.2 Association between Cultural Festivals and Tourism Development ... 41
4.4.3 Relationship between Cultural Festivals and Tourism Development ... 42
4.4.4 Hypothesis Testing between Cultural Festivals and Tourism Development ... 45
4.5 Objective Two: Influence of Customs and Artifacts on Tourism Development .... 45
4.5.1 Descriptive Statistics on Influence of Custom and Artifacts ... 45
4.5.2 Association between Custom and Artifacts and Tourism Development .... 50
4.5.3 Relationship between Customs and Artifacts and Tourism Development ... 52
4.5.4 Hypothesis Testing between Customs and Artifacts and Tourism Development ... 55
4.6 Objective Three: Influence of Traditional Rituals on Tourism Development ... 55
4.6.1 Descriptive Statistics on Influence of Traditional Rituals ... 55
4.6.2 Association between Traditional Rituals and Tourism Development ... 60
4.6.3 Relationship between Traditional Rituals and Tourism Development .... 61
4.6.4 Hypothesis Testing between Traditional Rituals and Tourism Development ... 65
4.7 Objective Four: Influence of Cattle Rustling on Tourism Development ... 66
4.7.1 Descriptive Statistics on Influence of Cattle Rustling ... 66
4.7.2 Association between Cattle Rustling and Tourism Development ... 70
4.7.3 Relationship between Cattle Rustling and Tourism Development ... 71
viii
4.8 Overall Objective: Influence of Cultural Practices on Tourism Development ... 74
4.8.1 Descriptive Statistics on Cultural Practices ... 75
4.8.2 Annual Revenue and Visitors to the County (Dependent Variable) ... 78
4.8.3 Association between Cultural Practices and Tourism Development ... 80
4.8.3 Overall Regression Model for Cultural Practices and Tourism Development ... 85
4.8.4: Summary of Hypotheses ... 89
4.9 Summary of the Chapter ... 90
CHAPTER FIVE: SUMMARY, CONCLUSIONS AND RECOMMENDATIONS ... 91
5.1 Introduction ... 91
5.2 Summary of the Findings ... 91
5.2.1 Cultural Festivals and Tourism Development ... 91
5.2.2 Customs and Artifacts and Tourism Development ... 92
5.2.3 Traditional Rituals and Tourism Development ... 94
5.2.4 Cattle Rustling and Tourism Development ... 95
5.2.5 Cultural practices and Tourism Development ... 96
5.3 Conclusion ... 96
5.4 Recommendation ... 98
5.5. Contributions of the Study ... 99
5.6 Suggested Areas for Further Study ... 99
REFERENCES ... 100
APPENDICES ... 106
APPENDIX I: Introduction Letter ... 106
APPENDIX II: Questionnaire for Community Members ... 107
ix
APPENDIX IV: Interview Guide for Destination Managers ... 117
APPENDIX V: Interview Guide for County Government Officials ... 120
APPENDIX VI: Baringo National Reserve Revenue & Statistics ... 122
APPENDIX VII: Map of Baringo County ... 123
APPENDIX VIII: Research Authorization From NACOSTI ... 124
x
LIST OF TABLES
Table 3.1: Target Population ... 23
Table 3.2: Sample Size ... 26
Table 3.3: Reliability Results ... 28
Table 4.1: Response Rate ... 31
Table 4.2: Cultural Festivals Responses for Community Members... 36
Table 4.3: Cultural Festivals Response for Tourists‟ ... 38
Table 4.4: Correlation Matrix for Cultural Festivals and Tourism Development ... 41
Table 4.5: Model Fitness of Cultural Festivals and Tourism Development ... 42
Table 4.6: Analysis of Variance (ANOVA) of Cultural Festivals and Tourism Development ... 43
Table 4.7: Regression of Coefficients for Cultural Festivals and Tourism Development ... 44
Table 4.8: Custom and Artifacts Responses for Community Members ... 46
Table 4.9: Custom and Artifacts Responses for Tourists ... 48
Table 4.10: Correlation Matrix for Custom and Artifacts and Tourism Development ... 51
Table 4.11: Model Fitness of Customs and Artifacts and Tourism Development ... 52
Table 4.12: Analysis of Variance (ANOVA) of Customs and Artifacts and Tourism Development ... 53
Table 4.13: Regression of Coefficients of Customs and Artifacts and Tourism Development ... 54
Table 4.14: Traditional Rituals Responses for Community Members ... 56
Table 4.15: Traditional Rituals Responses for Tourists‟ ... 57
Table 4.16: Correlation Matrix of Traditional Rituals and Tourism Development ... 60
xi
Table 4.18: Analysis of Variance (ANOVA) of Traditional Rituals and Tourism
Development ... 63
Table 4.19: Regression of Coefficients of Traditional Rituals and Tourism Development ... 64
Table 4.20: Cattle Rustling Responses for Community Members ... 66
Table 4.21: Cattle Rustling Response for Tourists‟ ... 68
Table 4.22: Correlation Matrix of Cattle Rustling and Tourism Development ... 70
Table 4.23: Model Fitness of Cattle Rustling and Tourism Development ... 71
Table 4.24: Analysis of Variance (ANOVA) of Cattle Rustling and Tourism Development ... 72
Table 4.25: Regression of Coefficients of Cattle Rustling and Tourism Development .... 73
Table 4.26: Responses on Cultural Practices and Tourism Development by Community Members ... 75
Table 4.27: Responses on Cultural Practices and Tourism Development by Tourists ... 77
Table 4.28: Correlation Matrix between Cultural Practices and Tourism Development for Community Members ... 80
Table 4.29: Correlation Matrix between Cultural Practices and Tourism Development for Tourists ... 83
Table 4.30: Model Fitness of Cultural Practices and Tourism Development ... 85
Table 4.31: Analysis of Variance (ANOVA) of Cultural Practices and Tourism Development ... 86
Table 4.32: Regression of Coefficients of Cultural Practices and Tourism Development ... 87
xii
LIST OF FIGURES
Figure 1.1: Conceptual framework linking the Cultural Practices and Tourism
Development ... 9
Figure 4.1: Gender ... 33
Figure 4.2: Age of the Respondents ... 33
Figure 4.3: Level of Education of the Respondents ... 34
xiii
ABBREVIATIONS AND ACRONYMS ASAL: Arid and Semi-Arid Lands
CBK: Central Bank of Kenya GDP: Gross Domestic Product GOK: Government of Kenya
KNBS: Kenya National Bureau of Statistics
OECD: Organization for Economic Co-operation and Development SPSS: Statistical Packages for Social Scientists
UNESCO: United Nations Educational, Scientific and Cultural Organization UNWTO: United Nation World Trade Organization
xiv
OPERATIONAL DEFINITIONS OF TERMS
Cultural Practices: Attractions that can be offered for tourism and they include cultural festivals customs & artifacts and traditional rituals that belong to a particular community that has resided in a particular region for eras.
Tourist: Is an individual who visits a country or a region in the world and resides there for a period above twenty-four hours with a sole purpose of participating in non-remunerated exercises. She/he can be a nationality of any country.
Cultural festivals: involves a celebration event that occurs periodically and is characterized by cultural presentation, competitions, exhibitions, cultural dances, folk songs, traditional homesteads, musical instruments and cultural clothing. Customs and artifacts: is an item which when found relays important information
about a community that resided in that specific location. The vital information that can be unearth may include that of their social welfare, political set ups and religion. The major artefacts that are overlooked are the presence of beads, jewelry, archaeological sites and museums.
xv
Traditional rituals: An ordered group of exercises including signals, lyrics, and objects, carried on in an isolated place, and performed by set succession; examples are circumcisions‟ and customary weddings.
xvi
ABSTRACT
1
CHAPTER ONE INTRODUCTION
Presented herein is the research theme and incorporates the foundation of the study, the statement of the problem, statement of the problem and purpose and the research hypotheses. The section additionally demonstrates the examinations that addressed the existing problem in charge of the current issue. Justification and the scope of the study are also presented.
1.1 Background of the Study
Culture is a primary 'force factor' which impacts guests' underlying choice to travel to a particular destination in various parts of the world (Liu, 2004). Thus in many areas of the world, especially in Europe and North America, social attractions have turned out to be imperative in the advancement of tourism (Buhalis, 2010). At the worldwide level, tourism attractions because of culture are normally seen as being symbols of vibrant surges of worldwide culture which enhances appreciation of cultural diversity among people from various regions of the world and forms a basis for tourism attraction (Richards, 2011).
2
Establishment of solid connection between tourism and culture can in this manner enable destinations to be competitive and attractive as areas to live, visit, to work and put resources into or investments (Akama, 2012).The development of tourism in Africa in general, and the development of cultural tourism in particular, are at its incipient stage
Generally, in Africa the development of tourism together with specific improvement of cultural tourism are all at its initial steps (Vesley, 2014).
Nonetheless, a great disparity exists in tourism development levels among the 53 states of Africa. Despite this, an extraordinary discrepancy exists on levels of tourism advancement among the fifty-three countries in Africa. Inside the spectrum of tourism development, well established tourism sector is found in countries such as Kenya (East), Morocco and Tunisia (North), Cote d‟ivoire and Senegal (West), Mauritius and Seychelles (Indian Ocean) and South Africa and Zimbabwe (South) of Africa continent (which are the success stories in Africa). At the same time other states including Cameroon, Nigeria, Angola, Sierra Leone and Eritrea for a motive of insecurity, lack of infrastructure and inadequate tourism marketing have restricted tourism advancement, however when compared with other counties have impressive potential for future tourism improvement (Dieke, 2010).
3
guards and furniture of the groups that have resided in the locale for a considerable length of time (Vesley, 2004).
Baringo is a mixture of cultures that are depicted as a melting pot of cultural interactions (Akama, 2012). The numerous communities including the Pokot, Ilchamus, Tugen and a large group of other Kenyan people have discovered a home in Baringo County making Baringo the perfect meaning of social and diversity in culture (Baringo County report, 2015). The Ilchamus Community Cultural Centre is located in Eldepe along Marigat road on the way to Lake Baringo. Whenever tourists visit Lake Baringo, they can make a stopover at the center to have a glimpse of the Ilchamus culture. The Tugen cultural Centre is located on the way to Lake Bogoria making the business center accessible especially by tourists. Cultural tourism conveys an expanded income/revenue to the heritage locale, and more comprehensively, to the community and the host country. Simply, it can be a motor of financial development and economic growth (Britton, 1989). Cattle rustling is also one of the cultural activity in Baringo County (Musyoki, 2005) which warrant peace races to establish harmony among the warring communities and a result of the peace races, tourists gets an opportunity to visit the area during the peace races. 1.2 Statement of the Problem and Justification
4
developed from $ 699 million in 2005 to $ 803 million in 2006 (UNWTO, 2007). Undesirably, spatial tourism in the nation is exhibited widely; Nairobi topped as the best destination in the nation winning 29.6 percent of the visitors, trailed by Mombasa at 14.7 percent, Naivasha 12.1 percent, Nakuru 5.6 percent and Diani Beach at 2.9 percent (KNBS, 2008). Only few regions like Maasai Mara national park and Costal region receive substantial number of tourists (Ringa, 2015).
The current tourism trend in the country is tilted towards wildlife, natural sceneries and summer seasons (Ringa, 2016). The cultural tourism is mostly associated with the Maasai community because of the Masai Mara National park which is proximate to the community. However, there are other communities with almost/more cultural practices than the Maasai community. The Pokot, Tugen and Ilchamus inhabiting Baringo County have cultural practices that are unique to them and can influence tourism destination. The study focused on the cultural practices of Pokot, Tugen and Ilchamus that can influence tourism destination.
5
2010). Richards (2011) commented that, “tourists will not come unless their needs are met”. This study investigated the influence of cultural practices on tourism development in Baringo County. Few studies have explored this area but from the available studies no study focused on the influence of cultural practices on tourism development in Baringo County, thus exists a knowledge gap. Therefore, this study was conducted so as to bridge the gap.
1.3 Purpose of the Study
The study investigated the influences of cultural practices on tourism development in Baringo County. The study specifically established the influence of cultural festival, custom and artefacts, traditional rituals and cattle rustling influences on the development of tourism in Baringo County.
1.4 Objectives of Study 1.4.1 General Objective
To investigate the influence of cultural practices on tourism development in Baringo County, Kenya.
1.4.2 Specific Objectives The specific objectives are;
i. To establish the influence of cultural festivals on tourism development in Baringo County.
ii. To profile the customs and artifacts in Baringo County and determine their influences on tourism development
6
iv. To assess the influence of cattle rustling on tourism development in Baringo County.
1.5 Research Hypotheses
i. H0: Cultural festivals do not have a significant influence on tourism development in Baringo County.
ii. H0: Customs and artifacts do not have significant influence on tourism development in Baringo County.
iii. H0: Traditional rituals do not have a significant influence on tourism development in Baringo County.
iv. H0: Cattle rustling do not have a significant influence on tourism development in Baringo County.
1.6 Significance of the Study
7
1.7 Scope of the Study
Baringo County is the area in which the research was carried out at. This was informed by the diverse culture embraced in the county by the numerous communities that include Tugen, Pokot, Ilchamus and other communities that have been hosted in Baringo and have discovered new homes due to the social and culture diversity exhibited in the county. Exploratory research design was adopted in the study in which the target population included destination managers, community members, county officials and tourists. The stratified sampling technique was used to categories each cluster of respondents in which appropriate method was used to select the sample size accordingly. Questionnaires and interview guide were the data collection instruments which gave the direct views and opinions of the respondents. The data was conducted from February 2017 to May 2017.
1.8 Limitation of Study
8
assistant who helped in the administration of the data collection instruments and the open responses from interviews relieved the subjectivity.
1.9 Basic Assumption of the Study
i. It was assumed that the respondents honestly answered the questionnaire. ii. It was assumed that the cultural practices were up to date.
1.10 Conceptual Framework and Measurement of Variables
9
Independent Variables (Supply) Dependent Variable (Demand)
Figure 1.1: Conceptual framework linking the Cultural Practices and Tourism Development
The study‟s independent variables are cultural festivals comprising cultural clothing, traditional homestead, traditional foods, folk songs and dances; customs and artifacts comprise of beads and jewelry, archeological sites and museums; traditional rituals comprise of circumcision and customary marriages. Cattle rustling comprises of peace races, constant insecurity and wars. The dependent variable is tourism development comprising increased number of tourist‟ and Revenue. Cultural practices tend to influence tourist‟s destination choice because of their uniqueness Tourism Development
Number of Tourists Revenue
Customs and Artefacts
Beads and Jewelry
Presence of
archaeological sites
Museums archives Cultural festivals
Cultural clothing
Traditional homestead
Folk songs and dances
Traditional food
Traditional rituals
Traditional
Circumcisions events
Traditional customary weddings attendants Cattle rustling
Constant insecurity
Peace races
Wars
Marketing
Branding
10
11
CHAPTER TWO LITERATURE REVIEW 2.1 Introduction
The chapter discusses the various theories that have informed the study on its theoretical framework. Presented also is the empirical literature review which is done as per the objectives. Findings of the review are critiqued to conceal the knowledge gaps in which the study will bridge. Information from relevant journal articles, seminar papers and conference reports are relied upon for this section. 2.2. Cultural Festivals and Tourism Development
Sofia (2017) conducted a study on the assessment of the impact and contribution of cultural festivals on the tourism development in Thessaloniki. Findings indicated that there were several cultural festivals organized at different level of the Thessaloniki. The cultural festivals held included music, drama, dances and shows. These cultural festivals spurred the local economy as participants could contribute in terms of money for them to be part of the festivals. They also created new jobs despite being seasonal.
12
enthusiasm for differing aspects of heritage tourism, particularly in the developed world (Crush, 2004).
Dwyer and Kim (2013) distinguished the elements that decide tourism competitiveness as accessible resources (common assets, cultural resources and items on heritage), resources created (tourism framework, the exercises on offer, and so on.), supporting components (foundation as a whole, the nature of administration, destination access among others.) and destination administration factors. The study underscored the part of benefits which are acquired or made and the manner by which these advantages are composed and distributed in the market. Keeping in mind the key elements that facilitates decision making on destination choice, resources are important in all dimension of tourism competitiveness.
13
in the North Rift region have not packaged their cultural products, Baringo County can use such opportunity to profile, package and market its cultural tourism products, thereby creating a destination niche.
2.3 Customs and Artifacts and Tourism Development
Akama, (2012) observed that culture and tourism have a commonly advantageous rapport which can reinforce the attractiveness quality and destination competitiveness. Culture is progressively a critical component of the tourism item, which equally makes uniqueness out of a crowded market, centers worldwide (Sunguh & Katana, 2007). In the meantime, tourism gives an imperative means for upgrading culture and generating income which can bolster and strengthen cultural heritage, cultural generation and innovativeness (Rajotte, 2007). Influencing a strong association among tourism and culture can in this way empower destinations to be all more engaging, competitive and focused as zones to live, visit, to work and place assets into (Nyeki, 2002).
14
(Ritcher, 2002). It is therefore evident that culture can influence the destination choice of a tourist as well as tourism development in a particular region.
2.4 Traditional Rituals and Tourism Development
As indicated by the National Restaurant Association and the Travel Industry Association of America (2008), traditional food was integral to choosing get-away destination for no less than 25 percent of relaxation travelers and 58 percent expressed that they are sometimes extremely inspired by traveling to take part in traditional rituals or wine related exercises. This depicts traditional food as part of decision choice when considering a destination to visit. Destinations with favorite cuisines are likely to attract large numbers of visitors as compared to destinations with less favorable cuisines. So conventional foods and beverages serves to determine destination choice.
15
providing events that are captivating in terms of sound, sight and taste. The rituals can create a uniqueness of a destination thereby making it competitive. This therefore stands a chance to be researched on which the current study focused on establishing the influence of traditional rituals on tourism development.
2.5 Cattle Rustling and Tourism Development
Mkutu (2010) explained that pasture and water clashes have for some time been a piece of the socio-cultural practices of pastoral communities in Kenya who previously were peaceful groups. The common land proprietorship tenure system for most of the pastoralist territories gives everybody an equivalent right of using the resources (Vukonic, 1996). The common terrains are customary ancestral grazing regions, such that movement of one community looking for pasture and water into regions that belongs to another community have regularly caused strife between pastoralists (Ondicho, 2000). Customarily, at whatever point, shortage of pasture and water or drought drained animals reduces their flock, and the communities keep regularly looking to renew numbers through stirring conflict with other community (Mkutu, 2010). Cattle‟s raiding is also a source of pride. This is because communities seek to demonstrate their superiority complex through forceful acquisition of resource which is pegged on cultural ties.
16
2005). The occasions have added to tourism in the region with lion's share of tourists being sport related (Kiprutto et al., 2007). Therefore, cattle rustling can affect tourism positively in terms of peace races held in the conflict areas. Tourists tend to attend the peace race events and learn about the culture of the conflicting communities. By creating harmonization between the warring communities, peace events are also used to perform cultural festivals, traditional rituals which are unique and products for tourism.
2.6 Dependency Theory
The dependency theory was proposed by Raul Prebisch in the late 1950s. It is an economic concept that identifies a financial dependence between the rich and the poor nations. The developed nations tend to contribute to the developing nation through activities such as tourism, aids and loans. In the current context, tourism development in the developing nation can be contributed by the influx of tourists from a developed nation.
Tourism improvement in developing/frontier nations is emphatically impacted by occasions in the developed nations (Minder, 2004). The stream of mass tourists from central to frontier nations; and the running of restaurants and resorts, is liable to different control systems found in the previous need to travel and the available resources for tourism enablement (Britton, 1989). The function of tour administrators in core nations are a standout amongst the most powerful tourism providers for cultural festivals in countries such as Kenya and Botswana.
17
inside the developed nations, tourism strengthens them through its enclavic structure and its orientation along conventional structures (Oppermann, 1993). This creates an impression that dependency theory informs the reliance of developing nations on tourism for its economic growth which is consumed by tourists mostly from developed nations.
This makes the cultural festivals be a tourist attraction event because of its perpetual dependency by developing countries. Baringo County is one of the cultural festival destination for tourists, thus the dependency theory informs the study on the role of cultural practices on tourism development in Baringo County. The county earns revenue from the cultural practices attended by the tourists, thus the county relies on consumptions of its cultural product by tourists whom majority are from developed nations.
2.7 Modernization Theory
18
Modernization in tourism improvement additionally demands for the utilization of 'encounter' as a finished creation. Tourists upgraded their societal position when they make sense of how to move and devour these encounters (Wang, 2000) and in this way fulfill their feeling of self needs (Maslow, 1987). Tourists‟ attraction by the cultural factors in Baringo county could produce foreign trade, balance of payment increment, growth of GDP, developed capital attraction, increment in the exchange of innovation and employment expansion. The modernization theory informs the study on the roles of cultural practices on tourism development in Baringo County, Kenya.
2.8 Critique of Literature
19
2.9 Research Gap
20
percent expressed that they are sometimes extremely inspired by traveling to take part in traditional rituals or wine related exercises. The scenario in America on tourism development is quite different from that of Kenya, therefore providing a contextual gap. Although numerous research studies have documented on culture and tourism, this study filled the gap by focusing on the role of cultural practices on tourism development in Baringo County, thus exists a knowledge gap.
2.10 Summary of the Chapter
21
CHAPTER THREE
RESEARCH METHODOLOGY 3.0 Introduction
The section examines the methodology that was utilized when collecting the data, analyzing the data and revealing the outcomes. The techniques and instruments that were utilized to gather and analyze the data to get legitimate information identified with the subject under investigation are also outlined. The section likewise discusses the research design, study area, population and the sample estimate. The section additionally discusses the rationality and dependability checks which were performed on the questionnaire. Finally, it shows the ethical practices.
3.1 Research Design
Research plans have been characterized by different writers, as per Bryman and Bell (2011) research design/plan is, a 'blue-print' that empowers the researcher to think of answers for problems and aides during the process of gathering, analyzing, and deciphering the information and perceptions. Therefore, research design provides a framework which can allow data collecting and analysis of the data to provide meaningful answers.
22
This would help the researcher explain the impact of cultural practices on tourism development in Baringo County.
3.2 Study Area
The research was carried out in Baringo, one of the arid and semi-arid county in the Rift Valley province of Kenya. It is situated between latitude 35°30' and 36°30' East and latitude 00°10' South and 00°140' North, and spreads in a territory of 10,949 km2, of which around 165 km2 is surface water (Stevens & Momsen, 2008). The area is occupied by the Pokot, Tugen and Njemps people whose significant occupation is keeping livestock (Kiprutto, Akama & Sitati, 2007).
Baringo County having three major communities with different cultures makes it diverse cultural hub that is ideal for the study on the influence of cultural practices on tourism. Baringo County also hosts Lake Baringo and Lake Bogoria which are the favorite tourist destination in the North Rift making it an appropriate area of study for tourism products offered. Attached at the appendix is the map of Baringo County where the study took place (Map of Baringo-attached at Appendix 5.6). 3.3 Target Population
23
total tourists visiting Baringo County each year is 29,512 (KNBS, 2015) while the Community members are 120,000 (Kenya population report, 2015). These clusters of population were deemed appropriate for the study as they participated directly and or indirectly in tourism development in the county which is rich in cultural diversity, thus they had adequate knowledge and to some extent experience on cultural practices and its relations with tourism.
Table 3.1: Target Population
Category Target Number
Destination managers 7
Tourists (Local and international) 29,512
Community members 120,000
County tourism officials 3
Total 149,522
3.4 Sample and Sampling Technique
Kothari (2004) explains a sample as the nominated respondent on behalf of the population. Stratified sampling technique was used to categorize the respondents of the study which were in four clusters that included destination managers, tourists, community members and county tourism officials. All the Destination managers were used as sample since the population was small while tourists and community members were sampled using the Fishers‟ exact formula for sample determination (Fisher et al; 1998).
Sample Determination for Destination Managers
24
Sample Determination for County tourism officials
The population of the county tourism officials was small, therefore a census approach was adopted and the interview guide issued for the 3 county officials. Sample Determination for Tourists’
This study adopted Yamane (1967) simplified formula to compute the sample size which gave the total respondents using the equation;
Where: n = sample size
N = population size
e = the level of precision (0.05)
1 = Constant
This formula assumes a degree of variability (i.e. proportion) of 0.5, the level of precision of 5% and a confidence level of 95%.
n = 29512/ 1+ 29512(0.05)2
= 394.6.897≈ 395 Tourists
25
Sample Determination for Community Members’
This study adopted Yamane (1967) simplified formula to calculate the sample size which provided the number of responses that need to be obtained using the equation;
Where: n = sample size
N = population size
e = the level of precision (0.05)
1 = Constant
This formula assumes a degree of variability (i.e. proportion) of 0.05, the level of precision of 5% and a confidence level of 95%.
n = 120,000/ 1+ 120,000(0.05)2
= 398.67≈ 399 Community Members
n = 399 Community members
26
Table 3.2: Sample Size
Category Target Number Sample
Destination managers 7 7
Tourists (Local and international)
29,512 395
Community members 120,000 399
County tourism officials 3 3
Total 149,519 804
3.5 Research Instruments
Burns and Grove (2003) characterize data collection as the exact, efficient gathering of data significant to the examination sub-problems, utilizing techniques, for example, interviews, member perceptions, focused group discussions, stories and case studies. Primary data was used in the study. Primary data are the direct views and opinions of the respondent pertaining the question/s at hand. This was obtained from questionnaires and interviews carried out thus gathered from original sources (Orodho, 2008).
27
specifically defined groups of tourists, community members, destination managers and government officials.
Qualitative data was captured through interview guides that were used to obtain information from the resort managers and county officials. The managers were interviewed according to the schedule and responses recorded. The responses were then transcribed according to the themes outlined.
3.6 Pre testing
Validity and reliability were carried out before the actual data collection. Five to ten percent (5% -10%) of the total sample size is recommended for pilot testing. This was in order to ascertain the nature of the questions and whether it captured the data required by the study. Pretest study was carried out around Lake Bogoria and its vicinity.
3.6.1 Validity Test
Mugenda and Mugenda (2003) observed that validity is the precision and usefulness of deductions, which depend on the examination outcomes. Validity exists if the information measures what they should quantify. Keeping in mind the essence of validity, supervisor and tourism research experts checked through the questionnaire to guarantee validity. Validity of the interview guide was tested by the researcher interviewing one of the destination managers whose comments were not included in the final responses.
3.6.2 Reliability Test
28
percent to ten percent of the total sample size is recommended for pilot testing. This study used 5% of the community and tourists (395+ 399=794). Therefore, forty (40) sample questionnaires were pretested and the participants excluded in the finals study. Pretest study was carried out around Lake Bogoria and its vicinity.
The responses from the 40 questionnaires were cleaned, normalized, coded and subsequently used to produce the reliability coefficient. Cronbach's Alpha (α) was utilized to test the internal consistency of the data results (Zikmund, 2010). It shows the degree to which an arrangement of test items can be dealt with as estimating a solitary variable (Cronbach, 1951). The suggested estimation of 0.7 was utilized as a cut– off of reliability for this examination. The outcomes were as displayed in table 3.3 below. As indicated by the outcomes in Table 3.3, every statement was consistent since the Cronbach alpha was over 0.7.
Table 3.3: Reliability Results
Variable No of items Respondents α=Alpha Comment
Cultural Festivals
5 40 0.8112 Reliable
Customs and Artifacts
5 40 0.7123 Reliable
Traditional rituals
5 40 0.7962 Reliable
Cattle rustling 5 40 0.7632 Reliable
Tourism Development
6 40 0.8521 Reliable
3.7 Data Collection Techniques
29
that point a letter to the County tourism administration was composed requesting for authorization to conduct the investigation in the County. Questionnaires were then distributed to the available respondents and gathered same day to improve the response rate. Respondents who were not available during the study time when engaged at their convenient time. The data on tourists were collected during their high season (summer) when there was tourist‟s influx in the county. Interviews were conducted after producing the NACOSTI letter and authorization from the university to conduct research on the destination managers.
3.8 Data Analysis
Data analysis insinuates the utilization of thinking to fathom the data that has been gathered with the point of choosing reliable example and delineating the relevant components revealed in the examination (Zikmund, Babin, Carr, & Griffin, 2010). Data was analyzed primarily by utilization of content analysis and Statistical Packages for Social Science (SPSS).
The statistics generated for each objective were descriptive statistics which were the mean, standard deviations, frequencies and percentages. The inferential statistics are the Pearson correlation and regression analysis and the entire objective involved a multiple linear regression model.
30
Y = β0+ β 1X1+ β 2X2+ β 3X3+ β 4X4 + Where:
Y = Tourism Development Xi for;
X1 = Cultural Festivals X2 = Customs and Artifacts‟ X3 = Traditional Rituals X4 = Cattle Rustling
Where { β i; i=1,2,3,4} = The coefficients for the various independent variables In the model a is the constant term while the coefficient β1 to β4 are used to measure
the sensitivity of the dependent variable (Y) to unit change in the independent variable (X1, X2, X3,X4). ,is the error term which takes care of the unexplained variations in the model. Presentation of the result was done in tables and pie charts. 3.9 Ethical Consideration
31
CHAPTER FOUR
RESEARCH FINDINGS AND DISCUSIONS 4.1 Introduction
The chapter represents the findings, results and interpretation of the variables including the response rate and descriptive statistics. Correlation and multiple regression analysis for the variables were performed.
4.2 Response Rate
Seven hundred and ninety-four (399 for community members and 395 for Tourists) were administered to the respondents. However, a total of 541 Questionnaires (275 for community members and 266 for Tourists) and 7 Interview guides were appropriately answered and returned. 253 of the respondents never returned the questionnaires while 3 of the respondents for interview guides were not reachable/available. The response rate result is shown in Table 4.1.
Table 4.1: Response Rate
N=804
Category Questionnaires ( Frequency Percentage (%)
Tourists (Q)
Returned 266 69.09
Unreturned 129 30.90
Total 395 100
Community Members (Q)
Returned 275 68.92
Unreturned 124 31.07
Total 399 100
32
responded to the questions. The 541 questionnaires administered out of a total of 794 were appropriately answered and returned representing 68.13 percent.
Three County Government Officials and 7 destination managers were supposed to be interviewed in the study. Two (66.7%) out of the three county government officials and 5 (71.43%) out of seven destination managers were interviewed during the study. A total of 7 of the 10 interview guides were responded to translating to 70.0 percent.
Overall response rate for the study was 68.15 percent. This response rate is considered good to make conclusions for the study. Bailey (2000) assertion that a response rate of 50% is adequate, while a response rate greater than 70% is very good. Based on the observation, the response rate in this case of 68.15% is therefore good for conclusion of the study. The data collection procedures used could have attributed to this high response rate. These included the use of research assistants, drop and pick mechanism, confidentiality assurance and anonymity issued to the respondents.
4.3 Demographic Information for the Respondents
The study established the demographic characteristics of the respondents. These comprised of age, gender and level of education.
4.4.1 Gender of the Respondents
33
Figure 4.1: Gender
The results in figure 4.1 indicated that majority of the respondents (55%) were male while 44% of the respondents were female. This implied that the gender parity among the respondents was not wide. The information provided could imply that majority of respondents were male.
4.3.2 Age of the Respondents
The respondents were requested to state their age. Results are presented on figure 4.2.
Figure 4.2: Age of the Respondents
Female 44% Male
56%
0% 10% 20% 30% 40%
Less than 30 years
31-41 years 41-50 years Over 50 years
13%
38.30%
25.60%
23.10%
Perc
en
t
34
The results in figure 4.2 indicated that majority of the respondents (38.3%) were aged between 31 to 40 years, 25.6% of the respondents were aged between 41 to 50 years while 23.1% of the respondents over 50 years. Similarly, 13.0% of the respondents were less than 30 years. The results implied that majority of the respondents were adults. This result partly disagrees to Population Situation Analysis Report for Kenya (2014) who observed that the pattern of populace development for people aged 24-34 years had expanded from around 12% in the year 1999 to almost 15% in the year 2009. Consequently, the finding of this examination conforms to the general pattern of the Kenya populace records and potential tourists who were mostly on adventure.
4.4.3 Level of Education of the Respondents
The results in the level of education of the respondents are presented on fig 4.3.
Figure 4.3: Level of Education of the Respondents
0% 5% 10% 15% 20% 25% 30% Primary
Secondary College University Postgraduate
5%
28.60% 20.10%
25.60% 20.50%
Percent
Lev
el
o
f E
d
u
cat
35
The results in figure 4.3 indicated that 28.6% of the respondents had attained secondary level of education, those who had attained university education were 25.6% of the respondents while those who had attained college level of education were 20.1% of the respondents. Similarly, the respondents who had postgraduate qualification were 20.5% while those who had primary qualification were 5.2% of the respondents. The results implied that majority (94.8%) of the tourists interviewed during the study had attained at least secondary level of education. The results prove that majority of the respondents understood the topic of the study and the responses were accurate and reliable.
4.4 Objective One: Influence of Cultural Festivals on Tourism Development 4.4.1 Descriptive Statistics on Influence of Cultural Festivals
36
Table 4.2: Cultural Festivals Responses for Community Members N =275
Statement
Strongly
Disagree Disagree Neutral Agree
Strongly
Agree Mean
Std. Dev Cultural festival dressing attire have made Baringo a favorite tourists
destination 0.0% 9.1% 13.3% 45.8% 31.8% 4.00 0.90 Cultural dances
have been potential tourists event in Baringo
County 0.0% 9.7% 8.8% 47.1% 34.4% 4.06 0.91
Traditional music festivals are popular tourists attraction event in Baringo
County 0.0% 10.7% 7.5% 42.9% 39.0% 4.10 0.94
Most tourists attend cultural folk songs event in Baringo County as their favorite
destinations. 0.0% 10.4% 7.5% 44.2% 38.0% 4.10 0.93 Traditional foods
present during cultural events fascinates
tourists 1.6% 1.6% 6.8% 48.5% 41.4% 4.26 0.79
Average 4.03 0.94
37
81.9 percent of the respondents agreed that traditional music festivals were popular tourists‟ attraction event in Baringo County as ascertained by the number of tourists who attend. Seventy-eight point two (78.2) percent of the respondents also agreed that majority of the tourists attend cultural folk songs event in Baringo County as their favorite destinations. Finally, 79.9 percent of the respondents agreed that traditional foods present during cultural events fascinates tourists.
The mean shows the average score for the statements. Most of the scores averaged at 4.0 showing that most statements were agreed on by the respondents. The standard deviation showed how much the scores varied from the mean. For most statements the deviation was 0.94 thus indication that the variation was reasonable, assumed to be natural variation. Culture has high capability of pulling in more tourists to the locale. Cultural activities such as folk songs, traditional dances and traditional foods made the county unique. These cultural festivals products therefore became a potential for tourist‟s destination.
Responses for Tourist on Cultural Festivals
38
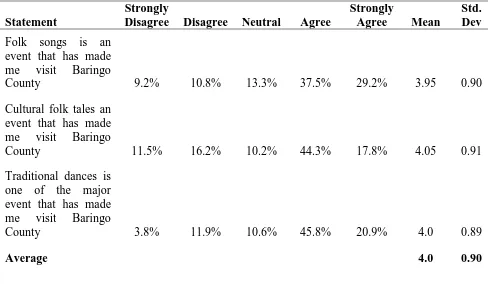
Table 4.3: Cultural Festivals Response for Tourists’ N =266
Statement
Strongly
Disagree Disagree Neutral Agree
Strongly
Agree Mean
Std. Dev Folk songs is an
event that has made me visit Baringo
County 9.2% 10.8% 13.3% 37.5% 29.2% 3.95 0.90
Cultural folk tales an event that has made me visit Baringo
County 11.5% 16.2% 10.2% 44.3% 17.8% 4.05 0.91
Traditional dances is one of the major event that has made me visit Baringo
County 3.8% 11.9% 10.6% 45.8% 20.9% 4.0 0.89
Average 4.0 0.90
Results in Table 4.3 indicated that majority of the tourists agreed that cultural festivals influenced tourism development. Sixty-six point seven (66.7%) percent of the respondents indicated that folk songs was an event that had made them visit Baringo County. Similarly, 62.1% of the respondents agreed that cultural folk tales was an event they valued when visiting Baringo County while 73.7% revealed that traditional dances was one of the major event that made them visit Baringo County. The reason behind the cultural festival being favorite among the tourists was because of its interactive, entertaining and adventurous nature coupled to learning about the different cultures among the communities in Baringo County.
39
taste. This therefore means that most tourists‟ toured the county to engage in cultural festival events. Further, cultural dances, music festivals and traditional foods were disclosed by the tourists‟ as their favorites that has made Baringo County their destination of choice. Most of the tourists‟ agreed that they encountered zero restriction in participating in the cultural dances and music festivals thus making them interact with the participants and learn on the dances and songs. Traditional foods were approved to be of a distinct flavor and thus many wanted to have more of it often.
The mean shows the average score for the statements. Most of the scores averaged at 4.0 showing that most of the respondents agreed to the statements. The standard deviation showed how much the scores varied from the mean. For most statements the deviation was 0.90 thus indication that the variation was reasonable, assumed to be natural variation. This implied that the data collected was unbiased and could be used for conclusion in the study.
Interview Responses for Destination Managers and County Officials
40
sceneries within the hotels coupled the specialized local and international cuisine making the resorts outstanding.
Most of the destination managers agreed that cultural festivals in Baringo County attracted tourists. This was accounted by the increased influx of tourists‟ who resided in the resorts during the Tugen, Ilchamus and Pokot cultural festivals held in Baringo County. However, one of the destination managers had a different opinion, he argued that cultural festivals were only increasing the number of tourists‟ during the seasons festivals take place but not regularly. They all affirmed that the beautiful music festivals, cultural folk songs, dances and traditional foods were tourists‟ favorite items during the cultural festivals. The reason behind the events was that they were unique, had beautiful interactions and tourists could freely engage in them. The result agreed to that of Sindiga (2009) who asserted that culture is viewed as assuming an imperative part in building and strengthening individuals' uniqueness and a feeling of having a place or belonging within a specific region. The acknowledgment of the function of culture in making and strengthening individuals' personality has of late assumed a critical part in the developing enthusiasm for differing aspects of heritage tourism, particularly in the developed world. Consequently, with the cultural festivals events in Baringo County, the county can be a unique tourist‟s destination.
41
Tugen and Ilchamus) that live in the county. The findings agreed to those of Mckercher et al. (2004) discovered components identifying with tourism product, experience and promoting tourism as key to prevalence of cultural attractions in Hong Kong, and that cultural place must be operational so as attractions can be well known.
4.4.2 Association between Cultural Festivals and Tourism Development
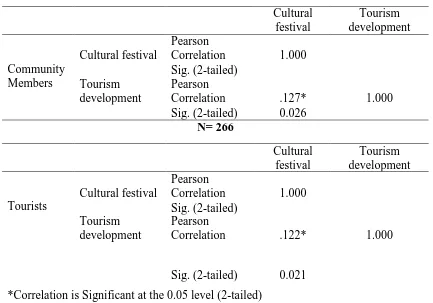
Correlation analysis was performed to establish the association between cultural festival (independent variable) and tourism development (dependent variable). Results are in Table 4.4.
Table 4.4: Correlation Matrix for Cultural Festivals and Tourism Development N =275 Cultural festival Tourism development Community Members Cultural festival Pearson
Correlation 1.000 Sig. (2-tailed)
Tourism development
Pearson
Correlation .127* 1.000
Sig. (2-tailed) 0.026 N= 266 Cultural festival Tourism development Tourists Cultural festival Pearson
Correlation 1.000 Sig. (2-tailed)
Tourism development
Pearson
Correlation .122* 1.000
42
Results for community members in Table 4.4 indicated that there was a positive and a significant association between cultural festival and tourism development (r=0.127, p=0.026). Similarly, results for tourists indicated that there was a positive and a significant association between cultural festival and tourism development (r=0.122, p=0.021). Shaw and Williams (2004) explained that worldwide conception of culture has prompted the designation of World Heritage locales which draws in a huge number of tourists yearly. Though, at the national as well as local level, culture is viewed as assuming an imperative part in building and strengthening individuals' uniqueness and a feeling of having a place or belonging within a specific region (Sindiga, 2009). This contributes immensely to growth of tourism in the regions hence culture thrives.
4.4.3 Relationship between Cultural Festivals and Tourism Development
The relationship between cultural festivals and tourism development was examined in the study using regression analysis. Results are presented in Table 4.5.
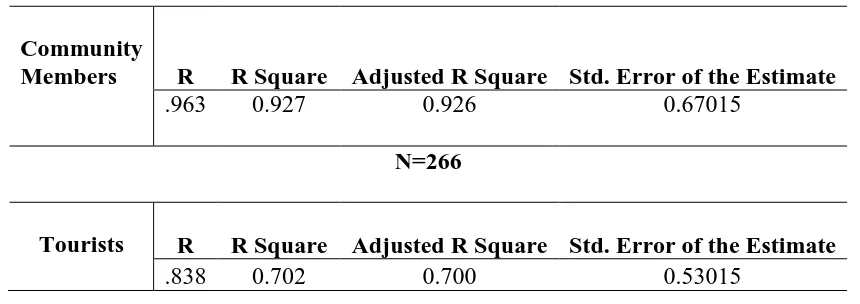
Table 4.5: Model Fitness of Cultural Festivals and Tourism Development N =275
Community
Members R R Square Adjusted R Square Std. Error of the Estimate
.963 0.927 0.926 0.67015
N=266
Tourists R R Square Adjusted R Square Std. Error of the Estimate
.838 0.702 0.700 0.53015
43
upheld by coefficient of assurance/determination otherwise called the R square of 92.7%. This means that cultural festival explained 92.7% of the variations in tourism development. Similarly, results for tourists in Table 4.5 revealed that cultural festivals were suitable variables in explaining tourism development in Baringo County. This was upheld by coefficient of assurance/determination otherwise called the R square of 70.2%. This means that cultural festival as per tourists explained 70.2% of the variations in tourism development as per tourists. These findings agreed with those of Ondimu‟s (1994) who asserted that culture has high capability of pulling in more tourists to the locale.
Table 4.6: Analysis of Variance (ANOVA) of Cultural Festivals and Tourism Development
N =275
Sum of Squares df Mean Square F Sig. Community
Members
Regression 1743.886 1 1743.886 3465.064 .000 Residual 137.874 274 0.503
Total 1881.760 275
N =266
Sum of Squares df Mean Square F Sig. Tourists Regression 1643.186 1 1643.186 3278.380 .003
Residual 132.823 265 0.501
Total 1776.009 266
44
the tourists which were both less than the conventional probability of 0.05 significance level.
Table 4.7: Regression of Coefficients for Cultural Festivals and Tourism Development
N =275 Unstandardized Coefficients
Standardized
Coefficients t Sig. Community
Members
B
Std.
Error Beta Cultural
Festival 0.589 0.009 0.963
62.31
4 0.000 N =266
Unstandardized Coefficients
Standardized
Coefficients t Sig.
Tourists
B
Std.
Error Beta Cultural
Festival 0.486 0.016 0.685
30.37
5 0.003
45
4.4.4 Hypothesis Testing between Cultural Festivals and Tourism Development The hypothesis of the study was cultural festivals do not have a significant influence on tourism in development Baringo County. Bivariate regression was used to test the hypothesis and determined using p-value (refer to Table 4.7). The acceptance/rejection criteria were that, if the p value is less than 0.05, we reject the H01 but if it is more than 0.05, then Ho1 is not rejected. Consequently, the null hypothesis was that cultural festivals do not have a significant influence on tourism in development Baringo County. Results in Table 4.7 shows that the p-value was 0.000. This was supported by a calculated t-statistic of 62.314 and 30.375 which were larger than the critical t-statistic of 1.96. The null hypothesis was therefore rejected. Thus, alternative hypothesis was adopted that cultural festivals influenced tourism in development Baringo County.
4.5 Objective Two: Influence of Customs and Artifacts on Tourism Development
4.5.1 Descriptive Statistics on Influence of Custom and Artifacts
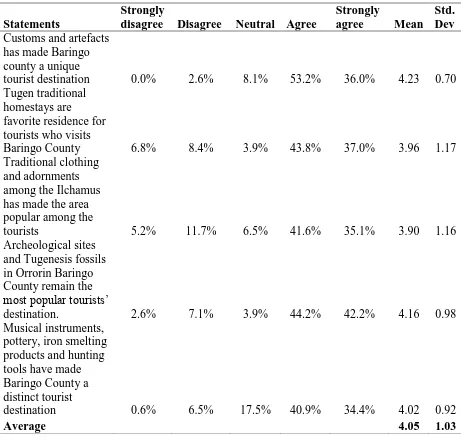
46
Table 4.8: Custom and Artifacts Responses for Community Members N =275
Statements
Strongly
disagree Disagree Neutral Agree
Strongly
agree Mean
Std. Dev Customs and artefacts
has made Baringo county a unique
tourist destination 0.0% 2.6% 8.1% 53.2% 36.0% 4.23 0.70 Tugen traditional
homestays are
favorite residence for tourists who visits
Baringo County 6.8% 8.4% 3.9% 43.8% 37.0% 3.96 1.17 Traditional clothing
and adornments among the Ilchamus has made the area popular among the
tourists 5.2% 11.7% 6.5% 41.6% 35.1% 3.90 1.16
Archeological sites and Tugenesis fossils in Orrorin Baringo County remain the most popular tourists‟
destination. 2.6% 7.1% 3.9% 44.2% 42.2% 4.16 0.98 Musical instruments,
pottery, iron smelting products and hunting tools have made Baringo County a distinct tourist
destination 0.6% 6.5% 17.5% 40.9% 34.4% 4.02 0.92
Average 4.05 1.03
47
was frequented by tourists visiting the county. Eighty-six point four percent (86.4%) of the respondents also agreed that archeological sites and Tugenesis fossils in Orrorin Baringo County remained the most popular tourists‟ destination. Finally, 75.3 percent of the respondents agreed that musical instruments, pottery, iron smelting products and hunting tools have made Baringo County a distinct tourist destination.
The mean shows the average score for the statements. Most of the scores averaged at 4.05 showing the most of the respondents were in agreement with the statements. The standard deviation showed how much the scores varied from the mean. For most statements the deviation 1.03 thus indication that the variation was reasonable, assumed to be natural variation. This implies that the presence of Tugen homestays, musical instrument and traditional clothing could uniquely define
Responses for Tourists on Custom and Artifacts
48
Table 4.9: Custom and Artifacts Responses for Tourists N =266
Statement
Strongly
Disagree Disagree Neutral Agree
Strongly
Agree Mean
Std. Dev Custom and artefacts
has made me visit Baringo County several
times 12.2% 15.8% 8.3% 32.3% 31.4% 3.6 0.85
The unique nature of Tugen traditional homesteads have been my most favorable temporary abode whenever I visit
Baringo County 9.4% 19.1% 12.3% 42.3% 16.9% 3.95 0.89 Musical instruments,
pottery, and hunting tools are my favorite entertainment tools whenever I am in
Baringo County 5.8% 13.9% 11.5% 41.5% 27.3% 4.1 0.90
Average 3.88 0.88
49
homesteads, musical instruments and pottery influenced the tourists‟ decision choice to be Baringo County.
Music instruments were acknowledged to be the most favorite custom tourists liked. Traditional homestays, archeological sites, traditional clothing and adornments among the Ilchamus were mentioned as some of the customs tourists liked. These customs and artifact has contributed in making the county a unique tourist‟s destination.
Additionally, Tugen traditional homestays and clothing and adornment were the favorite tourists‟ attraction in the county. Tourists acknowledged that homestays made them learn about the local language, ways of life and interact freely with the community members. Traditional clothing and adornments among the Ilchamus was acknowledged to be pleasant and unique. Thus most of tourists travelled to Baringo to put on the attire and learn how to put them on in the best way possible.
The mean shows the average score for the statements. Most of the scores averaged at 3.88 showing that most of the respondents agreed with the statements. The standard deviation showed how much the scores varied from the mean. For most statements the deviation 0.88 thus indication that the variation was reasonable, assumed to be natural variation.
Interview Responses for Destination Managers and County Officials
50
resort managers agreed that customs and artifacts in Baringo County attracted tourists‟ but had little influence compared to natural sceneries. The managers revealed that archeological sites were beautiful sceneries, Ilchamus clothing and adornment were unique and beautiful, traditional homestays enhanced interaction thus the tourists flocked the region to get experience of the destination. County government officials acknowledged that tourists were mostly attracted to the county because of the unique customs and artifacts. These included Ilchamus clothing and adornment, archeological sites and traditional homestays. This therefore confirms that customs and artifacts attracted tourists to Baringo County.
The result implied that cultural artifacts influenced tourists‟ destination in Baringo County. The finding was in line with Wikhal (2012) who argued that “the capacity to attract people by offering a good quality of life is of crucial importance for regional competitiveness. In studying regional attractiveness, it is important not only to consider what makes people move to a certain region but also what makes people want to stay.” The uniqueness of the archeological sites, clothing and adornment
among the Ilchamus and the Tugen traditional homesteads have made Baringo County competitive for tourists‟ destination.
51
Table 4.10: Correlation Matrix for Custom and Artifacts and Tourism Development N =275 Custom and Artifacts Tourism development Community Members Custom and Artifacts Pearson
Correlation 1.000 Sig. (2-tailed)
Tourism development
Pearson
Correlation .139* 1.000
Sig. (2-tailed) 0.015 N =266 Custom and Artifacts Tourism development Tourists Custom and Artifacts Pearson
Correlation 1.000 Sig. (2-tailed)
Tourism development
Pearson
Correlation .126* 1.000
Sig. (2-tailed) 0.011
*Correlation is Significant at the 0.05 level (2-tailed)
52
tendency to be appreciated most by the well taught and especially those with an aesthetic education. The presence of Tugen homestays, musical instrument and traditional clothing could uniquely define Baringo County in terms of tourists‟ destination.
4.5.3 Relationship between Customs and Artifacts and Tourism Development The relationship between custom & artifacts and tourism development was established in the study through regression analysis. Results are presented in Table 4.11.
Table 4.11: Model Fitness of Customs and Artifacts and Tourism Development N =275
Community Members
R R Square Adjusted R Square Std. Error of the Estimate
.961 0.924 0.924 0.68145
N =266 Tourists
R R Square Adjusted R Square Std. Error of the Estimate
.883 0.779 0.775 0.57283
For community members, results in Table 4.11 revealed that customs and artefacts was a suitable variable in explaining tourism development in Baringo County. This was upheld by coefficient of assurance otherwise called the R square of 92.4%. This means that customs and artefacts explained 92.4% of the variations on tourism development.
53
means that, customs and artifacts explained 77.5% of the variations on tourism development.
These findings agreed to those of Akama, (2012) who asserted that culture and tourism have a commonly advantageous relationship which can strengthen the attractiveness quality and competitiveness of a region or country. Culture is progressively a critical component of the tourism item, which equally makes uniqueness out of a crowded market, centers worldwide (Sunguh & Katana, 2007). Table 4.12: Analysis of Variance (ANOVA) of Customs and Artifacts and Tourism Development
N =275
Sum of Squares df Mean Square F Sig. Community
Members
Regression 1739.196 1 1739.196 3232.8423 .000 Residual 142.564 274 0.538
Total 1881.760 275
N =266
Sum of Squares df Mean Square F Sig. Tourists Regression 1536.106 1 1536.106 3218.820 .002
Residual 126. 465 265 0.477
Total 1662.571 266