Quality of Bus Services in Punjab: A
C
omparative Study of
Public and Private Sector
Dr. Sawinder Kaur
Assistant Professor in Commerce, Department of Distance Education, Punjabi University, Patiala, Punjab
ABSTRACT
Bus transport also appears under the scope of
service industry; and survival of any service
industry depends on how well it serves and
satisfies its passengers. A satisfied passenger is
always the biggest asset of any service industry.
If there is a gap between the expectations and
perceptions of respondents, then, there is a need
to improve the quality of services delivered by
the organisation. SERVQUAL Model is based on
five dimensions, viz. tangibility, reliability,
responsiveness, assurance and empathy. To
study the quality of bus services and
perceptions’ of passengers a questionnaire is
framed out and it covers the five dimensions of
service quality i.e., tangibility, reliability,
responsiveness, assurance and empathy. The
questionnaire designed for this research work is
weights ranging from 5 (strongly agree) to 1
(strongly disagree). After analysis of different
parameters of service quality, it is found that the
quality of private sector bus transport is better
than the public sector. The gap score in private
sector is less as compare to public sector.
Further, passengers were not satisfied which the
quality of bus services in Punjab, but private
sector give tough competition by try to capture
the passengers by providing good services to
public as compared to public sector.
INTRODUCTION
The activities which involved in
producing intangible products as education,
entertainment, food and lodging, transportation,
insurance, trade, government, financial, real
estate, medical, consultancy, repair and
Quality has become a strategic tool for obtaining
efficiency in operations and improved business
performance (Babakus and Boller, 1992).
Transportation also appears under the scope of
service industry; and survival of any transport
industry depends on how well it serves and
satisfies its passengers. A satisfied passenger is
always the biggest asset of any service industry.
With the advent of private and global players
into this market, the competition has become
still more stiff (Dhinakaran and Rajarajan,
2014). According to Silcock (1981), service
quality in public transport industry includes as
the measures of accessibility, reliability,
comfort, convenience and safety. Traditionally,
the performance indicators for public transport
are efficiency and effectiveness. The efficiency
includes the measures concerned with the
process that produce the services, while the
effectiveness determines how well the services
provided are with respect to the objectives that
are set for them (Pullen,1993). A number of
researchers have provided lists of quality
determinants, the best known determinants
emanate from Parasuraman and colleagues from
USA, who found five dimensions of service
quality, namely, tangibility, reliability,
responsiveness, assurance and empathy; and
used these as the basis for their service quality
measurement instrument, SERVQUAL
(Parasuraman et al., 1988; Zeithaml et al., 1990).
Service quality is needed for creating customer
satisfaction and customer expectations (Kabir
and Carlsson, 2010). SERVQUAL Model is a
gap score model which is based on the
expectations and perceptions of the respondents,
which is proposed by Parasuraman et al. (1985,
1988). It is a model which is used to check the
gap between the respondents’ perceptions
regarding the services delivered by the
organisation and expectations of respondents
regarding the quality of service delivered by the
organisation. If there is a gap between the
then, there is a need to improve the quality of
services delivered by the organisation.
SERVQUAL Model is based on five
dimensions, viz. tangibility, reliability,
responsiveness, assurance and empathy.
Parasuraman et al. invented a set of 22 items/
parameters which were based on these five
dimensions. In 1988, Parasuraman et al.
developed a gap model which was based on the
following dimensions:
Tangibility: Physical facilities like availability of buses, seats, personnel appearance.
Reliability: Ability to perform promised services with accuracy and at time.
Responsiveness: Ability to help customers with response and provide prompt service.
Assurance: Employees’ knowledge and courtesy, and their ability to inspire trust.
Empathy: Individual attention to customers. This model of service quality is derived
from the magnitude and direction of five gaps
which include consumer expectations-experience
discrepancies in addition to the difference in
service design, communications, management
and delivery. The first four gaps affect the way
in which service is delivered, and the existence
of these four gaps leads to the extent of gap five.
Gap 1: Difference between consumers’
expectations and managements’ perceptions of
those expectations, i.e., not knowing
what consumers expect.
Gap 2: Difference between management
perceptions of consumer expectations and
service quality specifications, i.e., improper
service quality standards.
Gap 3: Difference between service quality
specifications and service actually delivered,
i.e., the service performance gap.
Gap 4: Difference between service delivery and
the communication to consumers about
service delivery, i.e., whether promises
match delivery?
Gap 5: Difference between consumer’s
depends on size and direction of the four
gaps associated with the delivery of service
quality on the marketer’s side.
The service quality is a function of perceptions
and expectations and modelled as:
SQ =
k
j
ij
ij
E
P
1
)
(
Where, SQ = Overall service quality; K=
number of attributes.
Pij = Performance perception of stimulus i with
respect to attribute j.
Eij = Service quality expectation for attribute j
that is relevant norm for stimulus i.
OBJECTIVES OF THE STUDY
1. To assess the quality of bus services provided
by public and private sector in Punjab.
2. To assess the perception’s of passengers
regarding the quality of bus services in Punjab.
RESEARCH METHODOLOGY
A well-structured questionnaire was
framed to know the perception and expectation
of passengers about the quality of bus services in
Punjab. The perception of the passengers
regarding the service quality has been studied on
the basis of 5 parameters in the questionnaire.
The questionnaire essentially framed around five
dimensions of service quality i.e., tangibility,
reliability, responsiveness, assurance and
empathy. The questionnaire designed for this
research work is based on a 5-point Likert scale
with the assigned weights ranging from 5
(strongly agree) to 1 (strongly disagree). With
the help of certain statistical techniques such as
Chi-square test and t-test, data was assessed to
know the perception of passengers. In all 345
passengers were approached to collect the
required data for the study. However, 150
questionnaires each were selected for the public
and private sector on the basis of preferred mode
of transport by the passengers. Hence, the
sample size constituted 300 passengers. This
study adopts the judgment sampling technique to
ensure the representation of different sectors of
from the bus stands of Patiala, Bathinda,
Amritsar and Ludhiana cities. The universe of
population is the bus passengers commuting for
a period not less than 2 years in a particular
sector of transportation.
COMPARATIVE ANALYSIS OF THE PUBLIC AND PRIVATE SECTOR BUS
TRANSPORT SERVICES BY USING SERVQUAL MODEL
In this section, to make the comparison of the quality of bus service provided by the public and
private sectors SERVQUAL Model is used. It shows the comparative analysis of gap score (P-E) obtained
by the two sectors of bus transport system.
Assessment of the Tangibility Dimension of Service Quality
Table 1 shows the comparative analysis of tangibility dimension of public sector and private sector bus
transport.
Table 1:
Comparative Analysis of Tangibility Dimension in Public and Private Sector Bus
Transport
Tangibility Public Sector (P-E)
Private Sector (P-E)
T-value P-value
T1
Modern looking transport
-0.21 -0.21 -3.301 0.000 *
T2
Bus is clean and hygienic
-0.43 -0.26 -2.223 0.037 *
T3
Employees wear uniform and dressed up
-0.14 -0.30 -1.891 0.336
T4
quietness of the vehicle and system
-0.33 -0.28 -2.113 0.296
T5
Availability of seats
-0.39 -0.09 -2.084 0.041*
T6
Comfort of seats inside buses
Temperature inside bus
* Represents level of significances at 5% level of significances
Table 1 reveals that there is a significant
gap between perception and expectation (P-E) of
respondents regarding parameters T1 (Modern
looking transport), T2 (Bus is clean and
hygienic) and T5 (Availability of seats, which)
shows that there is significant difference
between the gap scores of public and private bus
transport sector. The analysis shows that the
service quality of the private sector is
significantly higher than the public sector. If we
compare parameter T2 (bus is clean and
hygienic) and parameter T5 (availability of seats
in buses), the negative gap score for these
parameters is less in private sector as compare to
public sector of bus transport. But in parameter
T1 (modern looking transport) negative gap
score is same in public sector and private sector
of bus transport.
Assessment of the Reliability Dimension of Service Quality
Table 2 shows the comparative analysis of reliability dimension of service quality of public and private
sector bus transport.
Table 2:
Comparative Analysis of Reliability Dimension in Public and Private Sector Bus
Transport
Reliability Public Sector
(P-E)
Private
Sector (P-E)
T-
value
P-value
R1
Service performed right at first time
-0.45 -0.49 -0.141 0.891
R2
Time tables maintained at any cost
-0.67 -0.37 -2.123 0.034*
R3
Services are punctual
-0.54 -0.37 -1.005 0.313
R4
Services are error free
R5
Alternative service are always there in
case of damage and accident
-0.53 -0.39 -1.026 0.295
R6
Reliable services provided to passengers
-0.27 -0.06 -2.186 0.046*
* Represents level of significances at 5% level of significances Table 2 shows that there is a significant
gap in parameter R2 (Time tables maintained at
any cost) and R6 (Reliable services provided to
passengers) of reliability dimension which
shows that the quality of services of private
sector is better as compare to the public sector.
The gap in these two parameters is lessor as
compared to the public sector.
Assessment of the Responsiveness
Dimension of Service Quality
Table 3 shows the comparative analysis of
responsiveness dimension of service quality of
public and private sectors of bus transport.
Table 3:
Comparative Analysis of Responsiveness Dimension in Public and Private sector of
Bus Transport
Responsiveness Public sector (P-E)
Private Sector (P-E)
T-value P-value
RS1
Employees are always willing to help out
-0.34 -0.23 -0.810 0.403
RS2
Employees always gives correct and prompt information regarding service
-0.49 -0.24 -1.927 0.055
RS3
Employees responsiveness are backed by their knowledge and positive attitude
-0.38 -80.19 -1.840 0.225
RS4
Employees communicate with customers
-0.34 9-0.19 -2.120 0.411
RS5
Method of communication suits needs of customers
-0.39 -0.32 -0.613 0.712
difference between gap score of public and
private sectors of bus transport. But table reveals
that the quality of private bus transport sector is
better as compare to public sector because the
negative gap score of private sector is lesser as
compare to the public sector bus transport.
Assessment
of
the
Assurances
Dimension of Service Quality
Table 4 shows the comparative analysis of
assurance dimension of service quality of public
and private sector bus transport.
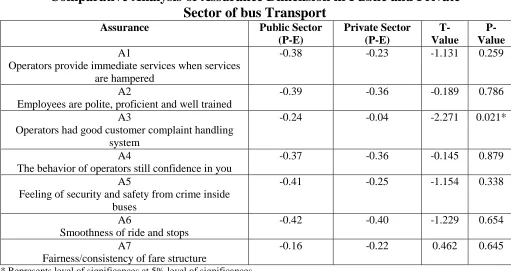
Table 4:
Comparative Analysis of Assurance Dimension in Public and Private
Sector of bus Transport
Assurance Public Sector
(P-E)
Private Sector (P-E)
T-Value
P-Value
A1
Operators provide immediate services when services are hampered
-0.38 -0.23 -1.131 0.259
A2
Employees are polite, proficient and well trained
-0.39 -0.36 -0.189 0.786
A3
Operators had good customer complaint handling system
-0.24 -0.04 -2.271 0.021*
A4
The behavior of operators still confidence in you
-0.37 -0.36 -0.145 0.879
A5
Feeling of security and safety from crime inside buses
-0.41 -0.25 -1.154 0.338
A6
Smoothness of ride and stops
-0.42 -0.40 -1.229 0.654
A7
Fairness/consistency of fare structure
-0.16 -0.22 0.462 0.645
* Represents level of significances at 5% level of significances Table 4 shows that there is significant
gap in one parameter, i.e. A3 (Operators had
good customer complaint handling system).
Where all the parameters of assurance dimension
show negative gap-score and quality of these
parameters is unsatisfactory in both the sectors.
But the quality of private bus transport is better
as compared to public sector because gap in
public sector is higher as compare to private
Assessment of the Empathy Dimension
of Service Quality
Table 5 shows the comparative analysis of
empathy dimension of public and private bus
transport sector.
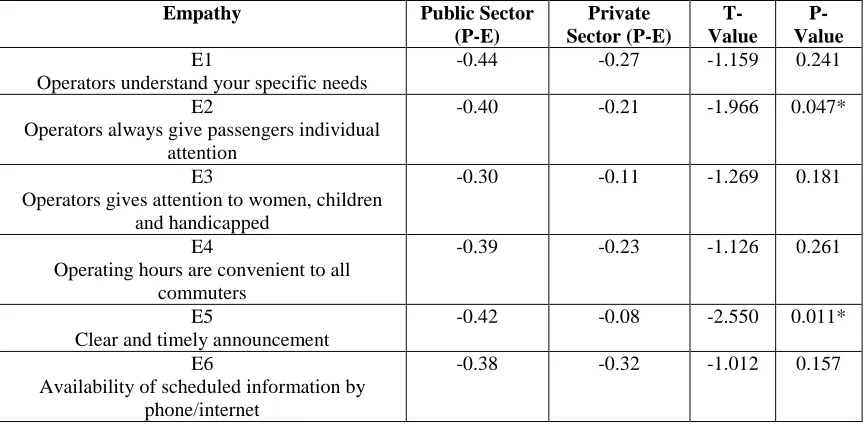
Table 5:
Comparative Analysis of Empathy Dimension in Public and Private Sector Bus
Transport
Empathy Public Sector (P-E)
Private Sector (P-E)
T-Value
P-Value
E1
Operators understand your specific needs
-0.44 -0.27 -1.159 0.241
E2
Operators always give passengers individual attention
-0.40 -0.21 -1.966 0.047*
E3
Operators gives attention to women, children and handicapped
-0.30 -0.11 -1.269 0.181
E4
Operating hours are convenient to all commuters
-0.39 -0.23 -1.126 0.261
E5
Clear and timely announcement
-0.42 -0.08 -2.550 0.011*
E6
Availability of scheduled information by phone/internet
-0.38 -0.32 -1.012 0.157
* Represents level of significances at 5% level of significances Table 5 shows that the there is significant
gap in two parameters viz., E2 (Operators
always give passengers individual attention) and
E5 (Clear and timely announcement). It was
analysed that the quality of services is better in
private sector as compare to public sector
because the negative gap score is lesser in
private sector as compare to public sector.
FINDINGS OF THE STUDY
After analysis of different parameters of
service quality, it is found that the quality of bus
services is not good enough to satisfy the
expectations of passengers. But in some extent
the quality of private sector bus transport is
better than the public sector because the gap
public sector. Further, passengers were not
satisfied which the quality of bus services in
Punjab, but private sector give tough
competition by try to capture the passengers by
providing good services to public as compared
to public sector.
REFERENCE
[1]. Babakus, E.; and Boller, G. W. (1992),
“An Empirical Assessment of SERVQUAL
Scale”, Journal of Business Research, Vol.
24(3), pp. 253-268.
[2]. Dhinakaran, D.P.; and Rajarajan, R.
(2014), “Passengers’ Perception towards
Service Quality in Tamilnadu State Transport
Corporation (Kumbakonam) Limited,
Kumbakonam”, Asia Pacific Journal of
Research, Vol. 1, Issue XIII, pp. 170-181.
[3]. Kabir, M.D.; and Carlsson, T. (2010),
“Service Quality - Expectations, Perceptions
and Satisfaction about Service Quality at
Destination Gotland- A Case Study”, Ph.D
Thesis, Swedish University, Scotland.
[4]. Parasuraman, A.; Zeithaml, V.A.; and
Berry, L.L. (1988), “SERVQUAL: A Multiple
Item scale for Measuring Customer
Perceptions of Service Quality”, Journal of
Retailing, Vol. 64, No. 1, pp.12-37.
[5]. Pullen,W.T. (1993), “Definition and
Measurement of Quality of Service for Local
Public Transport Management”, Transport
Reviews, Vol.13, No. 3, pp.247-264.
[6]. Silcock, D.T. (1981), “Measures of
Operational Performance for Urban Bus
Services”, Traffic Engineering and Control,