© 2015, IJCSMC All Rights Reserved 125 Available Online atwww.ijcsmc.com
International Journal of Computer Science and Mobile Computing
A Monthly Journal of Computer Science and Information Technology
ISSN 2320–088X
IJCSMC, Vol. 4, Issue. 9, September 2015, pg.125 – 135
RESEARCH ARTICLE
Bird Species Identification Using
Support Vector Machine
Sangita S.Londhe* Dr. Sudhir S. Kanade**
*Pursuing Masters of Engineering in Electronics and Telecommunication from Dr. B.A.M.U. Aurangabad (India)
**H.O.D. Department of Electronics and Telecommunication Dr. B.A.M.U. Aurangabad (India)
Abstract: Automatic identification of bird species by their vocalization is studied in this paper. Bird sounds are divided by their function into songs and calls which are further divided into hierarchical levels of phrases, syllables and elements. It is shown that syllable is suitable unit for recognition of bird species. Diversity within different types of syllables birds are able to produce is large. Automatic recognition system for bird species used in this paper consists of segmentation of syllables, feature generation, classifier design. Support vector Machine is chosen for species identification.
Key Words — Bird sounds, species identification, pattern recognition, feature generation, Support vector machine(SVM).
I. INTRODUCTION
As humanity and technology spreads across the face of the Earth, interactions, both negative and positive, between birds and people grow. In recent years, public sentiment towards birds has changed from something to be killed for fun, food. Now birds are considered to be deserving of protection. Because birds come and go as they please, and cannot (generally) be kept out by fences, scientists and engineers seek automated ways to determine their presence. Birds, by and large, are a garrulous lot, so microphones and audio processing equipment could possibly provide this capability. Birds are critical to ecosystem functioning, so techniques to make avian monitoring more efficient and accurate will greatly benefit science and conservation efforts. They are vulnerable to both human induced habitat change and global climate change and as a result May species are declining.
© 2015, IJCSMC All Rights Reserved 126
trained professional for making identification. Goal in this work are to develop methodology for the system that could automatically identify bird species or even individual birds by their sounds.
II. RELATED WORK
Interest towards automatic recognition of bird species based on their vocalization has increased and many recent studies have been published [1–5]. Bird species identification is a typical pattern recognition problem and most studies include signal preprocessing feature extraction and classification sections. Bird vocalization segmentation into smaller recognition units is performed by hand or automatically. The number of species has ranged between 2 and 16 in previous studies. The works of Anderson et al. [6] and Kogan and Margoliash [7] were among the first attempts to recognize bird species automatically by their sounds. They applied dynamic time warping and hidden Markov models for automatic song recognition of Zebra Finche (Taeniopygia guttata) and Indigo Punting (Passerina cyanea). In these studies, syllables were represented by spectrograms and classification was performed by matching the spectrograms to predefined prototypes. Comparison of spectrograms is computationally demanding, and in the case of field recordings, they often also include environmental information that is not relevant to recognition of bird species In this work, songs were represented by spectral and temporal parameters. Support vector Machine was used for Identification of Bird Species.
III. SOUND IDENTIFICATION SYSTEM
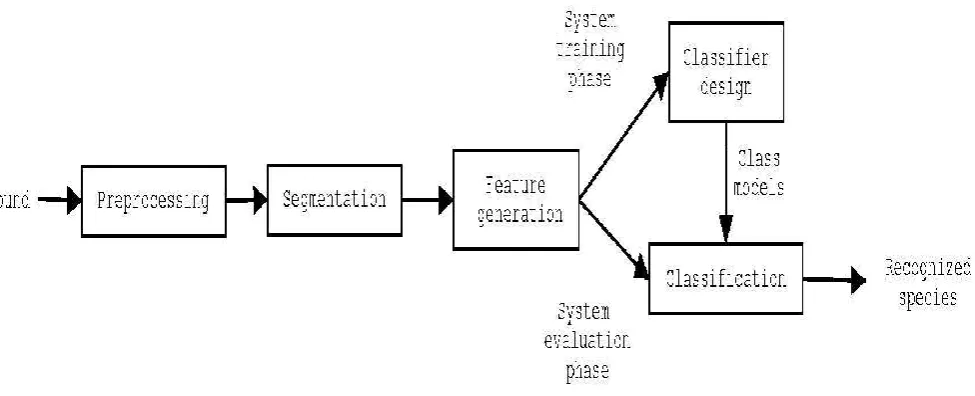
Figure 1: General audio Identification system.
Automatic identification of audio patterns have become a popular research topic in the field of audio and signal processing in recent years. General structure of such system is quite similar in different audio classification problems. A stage of a basic audio classification system is presented in figure 1.1. Building audio classification system involves two phases; System training and system evaluation phase. In the first phase models of classes are trained with training data set, and in system evaluation phase the system performance is evaluated with test data set, which is usually different from the training data set. Incoming sound needs often some preprocessing before it can be classified. Preprocessing phase may include for example noise reduction and transformation of the data into a desired format. In segmentation phase the data is divided into concurrent segments or they are extracted from the raw data. In this work the syllables of bird sounds are extracted from raw recordings.
© 2015, IJCSMC All Rights Reserved 127
this phase decision boundaries of the classes are created. Once the classifier is designed and trained its performance for given classification task is evaluated in the system evaluation stage.
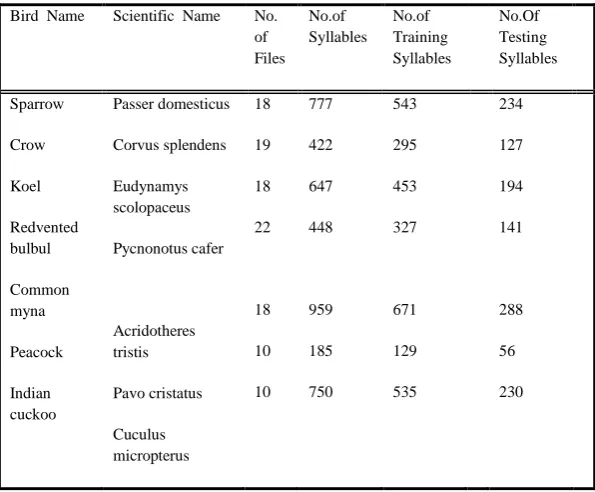
Table 1: Structure of Audio database Bird Name Scientific Name No.
of Files No.of Syllables No.of Training Syllables No.Of Testing Syllables Sparrow Crow Koel Redvented bulbul Common myna Peacock Indian cuckoo Passer domesticus Corvus splendens Eudynamys scolopaceus Pycnonotus cafer Acridotheres tristis Pavo cristatus Cuculus micropterus 18 19 18 22 18 10 10 777 422 647 448 959 185 750 543 295 453 327 671 129 535 234 127 194 141 288 56 230
IV. SEGMENTATION OF BIRD SONG
Bird sounds are typically divided into categories of songs and calls depending upon their function. Generally, songs are longer and more complex than calls and occur more spontaneously. The main function of songs is related to breeding and territorial defense. Many bird species sing only during the breeding season and is generally further limited to males only. Call sounds are typically short vocalizations that carry a function, for example, an alarm, flight, or feeding. Distinguishing between songs and calls can sometimes be ambiguous and hence the separation of bird sounds into these categories is not studied in this work. Bird vocalizations are often divided into hierarchical levels of phrases, syllables, and elements. For example, the levels of a song of the Common Chaffinch (Fringilla coelebs) are illustrated in Figure 4.4. A phrase is a series of syllables that occur in a particular pattern. Usually, syllables in a phrase are similar to each other, but sometimes they can be also different as in the last frame of the song presented in Figure 4.4. Syllables are constructed of elements. In simple cases, syllables are equal to elements, but complex syllables may be constructed from several elements. Separation of elements is often difficult and can be ambiguous. Call sounds are usually composed of only one syllable and the phrase level cannot be detected. The phrase level is also commonly missing in songs of certain species.
Here we call the smallest unit a syllable. A syllable is basically a sound that a bird produces with a single blow of air from the lungs. Each input signal is first segmented into a set of syllables ]. Each syllable is regarded as the elementary acoustic recognition unit since it is relatively easier to extract a number of syllables from a recording with many birds singing simultaneously. In addition, the features extracted from the syllable are more invariant to regional variations in animal vocalizations. The detail of the syllable segmentation method is described as follows [8]:
© 2015, IJCSMC All Rights Reserved 128 Figure 2: Hierarchical levels of song of the Common Chaffinch
I. Algorithm:
1) Find syllable candidates, i.e., regions that are above syllable threshold TdB. 2) Update NdB from gaps between syllable candidates.
3) Update the threshold, e.g. TdB=NdB/2, and return to step 1.
Once the algorithm has converged, syllable candidates that are very close to each other are grouped together in order to prevent a border effect. Also, temporally distinct syllable elements that are detected separately are grouped together. In this work syllable, candidates that are less than 15 milliseconds apart of each other are joined together to become one syllable.
V. FEATURES GENERATION
The segmented syllable candidates are represented using two different parametrization methods. The mel-cepstrum model is a common parametrization method used frequently in speech recognition. A second parameterization method employs a set of descriptive signal parameters and is used in many audio classification problems. Descriptive signal parameters include both temporal and spectral features. Identification of birds is done based on the features, which are calculated from the syllables. Features constitute a feature vector, which is a representation of the syllable. Features are generated in three phases.
Most of the features are calculated on frame basis. This is common in audio and speech analysis, because the amount and variability of data is reduced. First, syllables are divided into overlapping frames, because when you use a window function, you have less information at the tapered ends. So, one way to fix that is to use sliding windows with an overlap. The idea is that when put together, they approximate the original sequence as best as possible. Typical overlapping values vary between33% to 50%, depending on the application. Frame length is 4.76 ms with 50% overlap is used for better accuracy. Features are calculated from windowed frames, which results feature trajectories of the syllable.
Two basic audio features are studied,
© 2015, IJCSMC All Rights Reserved 129 Spectral features:
All spectral features are calculated on the frame basis and they provide short time spectral properties of the syllable. Frame size of 4.76 ms with 50% overlap is used. Fourier transform is applied to signal frames that are windowed with Hanning window.
Spectral Centroid (SC)
Spectral centroid is center point of spectrum and in terms of human perception it is often associated with the brightness of the sound. Brighter sound is related to the higher centroid. Spectral centroid for signal frame is calculated as:
Where, X " is discrete Fourier transform (DFT) of signal frame and M fi is half of the size of DFT.
Spectral roll off frequency (SRF)
Spectral roll off frequency is the point below which certain amount of power spectral distribution resides. Feature is related to ―skewness‖ of spectral shape. The measure can
Distinguish sounds with different frequency ranges. Spectral roll off frequency for a DFT
Frame is defined as:
Where, TH is the threshold between 0 and 1. Here we use a commonly used value 0.95.
Delta spectrum magnitude (spectral flux) (SF)
Delta spectrum magnitude measures difference in spectral shape. It gives a higher value for syllables with a higher between-frame difference. Formula for delta spectrum magnitude calculations is given as:
Temporal features:
In addition to the features described below, the temporal duration of the syllable (T) is also used as the feature of the syllable. The zero-crossing rate (ZCR) and short time signal energy are calculated on frame basis. The size of a frame is of 4.76 ms and adjacent frames overlap of 50% as it was also for the spectral features. Frames are windowed with rectangular window.
Zero-crossing rate (ZCR)
Zero-crossing rate (ZCR) is number of time domain zero-crossings in processing frame. A zero-crossing occurs when adjacent samples have different signs. ZCR is closely related to spectral centroid as they both measure construction of spectral shape of frame. It is defined for the frame as:
2 0 2 0
)
(
)
(
M k M kk
X
k
X
n
SC
M k L kk
X
TH
k
X
K
SRF
0 0)
2
^
)
(
2
)^
(
max(
1 0))
1
(
sgn(
))
(
sgn(
M nn
x
n
x
ZCR
M k i ii
X
k
X
k
DSM
0
1
(
)
© 2015, IJCSMC All Rights Reserved 130 Where x is time domain signal frame and M is the size of the frame. Signum function sgn is defined as
VI. IDENTIFICATION METHODS AND MODELS
The Classifier role is to decide which the best possible class for the test pattern is. This is done by comparing similarity between test pattern and model or target patterns of Classes. Classifier does the decision based on the similarity or distance measure between test pattern and model patterns.
There are different classifiers, 1. Gaussian mixture model 2. Hidden Marko model 3. Support vector machine 4. k-Nearest-Neighbor 5. Dynamic Time Warping
Support Vector Machine
The support vector machine usually deals with pattern classification. There are different type of patterns i.e. Linear and linear. Linear patterns are patterns that are easily distinguishable or can be easily separated in low dimension whereas non-linear patterns are patterns that are not easily distinguishable or cannot be easily separated and hence these type of patterns need to be further manipulated so that they can be easily separated.
Basically, the main idea behind SVM is the construction of an optimal hyper plane, which can be used for classification, for linearly separable patterns. The optimal hyper plane is a hyper plane selected from the set of hyper planes for classifying patterns that maximizes the margin of the hyper plane i.e. the distance from the hyper plane to the nearest point of each patterns. The main objective of SVM is to maximize the margin so that it can correctly classify the given patterns i.e. larger the margin size more correctly it classifies the patterns.
The equation shown below is the hyper plane representation:
Hyper plane, aX + bY = C ( i )
As with any supervised learning model, you first train a support vector machine, then use the trained machine to classify (predict) new data. In addition, to obtain satisfactory predictive accuracy, you can use various SVM kernel functions, and you must tune the parameters of the kernel functions.
Kernel Function —Kernel function map the data into higher dimensional space in the hope that the data is more easily separated. There are different kernel function Use in this work.
a) Linear Kernel:
Unlike the rest of the kernels, the Linear Kernel has only one tunable parameter (c). It is a special case the Radial Basis Kernel, of one of the other 4 kernels available. This kernel performs well if the number of features is large compared to the size of the data, and if is unnecessary to map to a higher dimensional space. It deals poorly, however, with noisy data.
K(w, x) = wT x
b) Quadratic Kernel:
The SVM algorithm can be fully expressed in terms of kernels without having to actually specify the feature space transformation. Implementing a two dimensional quadratic kernel function allows the SVM algorithm to find support vectors
1, ( ) 0 0 ) ( , 1))
(
© 2015, IJCSMC All Rights Reserved 131
and correctly separate the regions. The non-linear regions are linearly separated after transforming to the squared kernel space.
K(w, x) =(1+ wT x)2
c) Polynomial Kernel:
A polynomial mapping is a popular method for non-linear modelling. The second kernel is usually preferable as it avoids problems with the hessian becoming Zero. Polynomial kernels are well suited for problems where all the training data is normalized.
K(w, x) =(αwT x+c)P
Adjustable parameters are the slope alpha, the constant term c and the polynomial degree p.
d) Gaussian Radial Basis Function:
Radial basis functions most commonly with a Gaussian form. The adjustable parameter sigma plays a major role in the performance of the kernel, and should be carefully tuned to the problem at hand. If overestimated, the exponential will behave almost linearly and the higher-dimensional projection will start to lose its non-linear power. In the other hand, if underestimated, the function will lack regularization and the decision boundary will be highly sensitive to noise in training data.
K(w, x) = exp(-||w- x||2 /2σ2)
VII. RESULT
The Software for all computational purposes is MATLAB 7.8.0(R2010a). SVM models are utilized to identify the bird species of testing data .Feature values for spectral and temporal features are evaluated from the segmented bird syllable for each species. Each bird data file is processed.
In this work Multi-class SVM is used for species identification. Support vector machines were trained with all the training data for different kernel functions . These trained SVM models are utilized to identify the bird species of testing data.The accuracy of these trained SVM for different kernel function is recorded and which is shown in following tables.
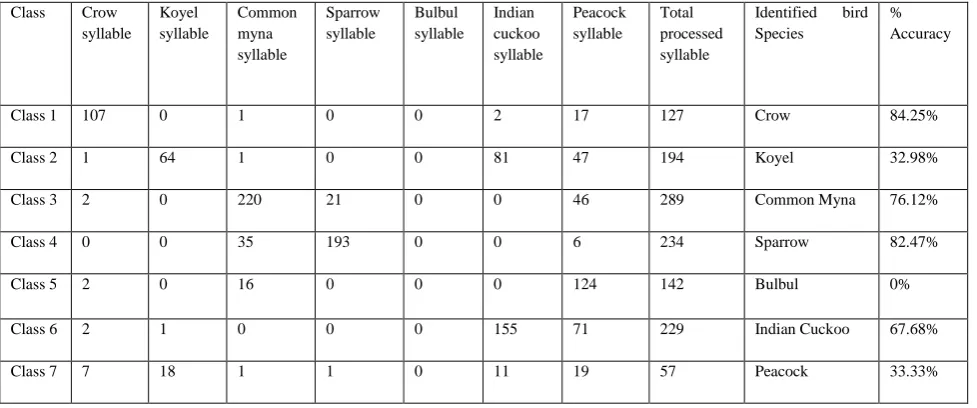
Table 2 : Accuracy for Linear Kernal
.
Class Crowsyllable Koyel syllable
Common myna syllable
Sparrow syllable
Bulbul syllable
Indian cuckoo syllable
Peacock syllable
Total processed syllable
Identified bird Species
% Accuracy
Class 1 107 0 1 0 0 2 17 127 Crow 84.25%
Class 2 1 64 1 0 0 81 47 194 Koyel 32.98%
Class 3 2 0 220 21 0 0 46 289 Common Myna 76.12%
Class 4 0 0 35 193 0 0 6 234 Sparrow 82.47%
Class 5 2 0 16 0 0 0 124 142 Bulbul 0%
Class 6 2 1 0 0 0 155 71 229 Indian Cuckoo 67.68%
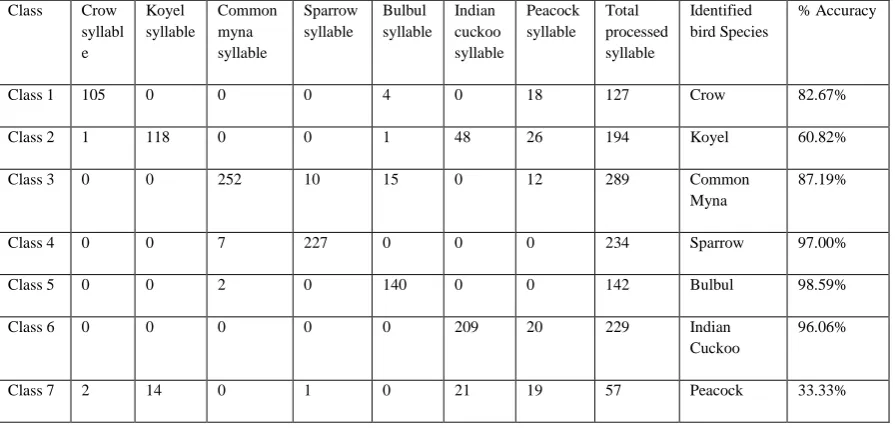
© 2015, IJCSMC All Rights Reserved 132 Table 3: Accuracy for Quadratic Kernel.
Table 4 : Accuracy for RBF Kernel. Class Crow
syllable Koyel syllable
Common myna syllable
Sparrow syllable
Bulbul syllable
Indian cuckoo syllable
Peacock syllable
Total processed syllable
Identified bird Species
% Accuracy
Class 1 106 0 0 0 4 1 16 127 Crow 83.46%
Class 2 1 141 0 0 1 29 22 194 Koyel 72.68%
Class 3 0 0 229 10 12 0 38 289 Common Myna 79.23%
Class 4 0 0 4 229 0 0 1 234 Sparrow 97.86%
Class 5 0 0 3 0 139 0 0 142 Bulbul 97.88%
Class 6 0 0 0 0 0 224 5 229 Indian Cuckoo 97.81%
Class 7 4 16 0 2 3 24 8 57 Peacock 14.03%
Class Crow syllabl e
Koyel syllable
Common myna syllable
Sparrow syllable
Bulbul syllable
Indian cuckoo syllable
Peacock syllable
Total processed syllable
Identified bird Species
% Accuracy
Class 1 105 0 0 0 4 0 18 127 Crow 82.67%
Class 2 1 118 0 0 1 48 26 194 Koyel 60.82%
Class 3 0 0 252 10 15 0 12 289 Common
Myna
87.19%
Class 4 0 0 7 227 0 0 0 234 Sparrow 97.00%
Class 5 0 0 2 0 140 0 0 142 Bulbul 98.59%
Class 6 0 0 0 0 0 209 20 229 Indian
Cuckoo
96.06%
© 2015, IJCSMC All Rights Reserved 133 Table 5 : Accuracy for Polynomial Kernel
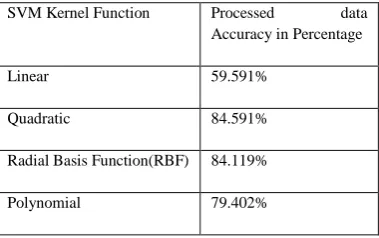
Table 6: Accuracy in Percentage.
The Bar graph shows Accuracy of seven bird for different kernel function
Fig 3: Bar graph for the Accuracy of seven bird using different Kernel Function
1 2 3 4 5 6 7 0
10 20 30 40 50 60 70 80 90 100
Sample Bird
A
c
c
u
ra
c
y
linear kernel Quadratic kernel RBF kernel Polynomial kernel
Crow Koyel Myna Sparrow Bulbul Cuckoo Peacock
Class Crow syllable
Koyel syllable
Common myna syllable
Sparrow syllable
Bulbul syllable
Indian cuckoo syllable
Peacock syllable
Total processed syllable
Identified bird Species
% Accuracy
Class 1 106 0 0 0 3 11 7 127 Crow 83.46%
Class 2 1 133 0 0 0 21 39 194 Koyel 68.91%
Class 3 0 1 225 10 3 0 50 289 Common
Myna
77.85%
Class 4 0 1 9 221 1 0 2 234 Sparrow 94.44%
Class 5 0 0 10 0 129 0 3 142 Bulbul 90.84%
Class 6 0 0 0 0 0 190 39 229 Indian
Cuckoo
82.96%
Class 7 5 15 0 1 2 28 6 57 Peacock 10.52%
SVM Kernel Function Processed data Accuracy in Percentage
Linear 59.591%
Quadratic 84.591%
Radial Basis Function(RBF) 84.119%
© 2015, IJCSMC All Rights Reserved 134 VIII.CONCLUSION
The work carried out two parts, preprocessing, to get the valid syllables of bird songs and processing those to get different features which will be effectively used in categorization of bird species The long term objective in this research is to envelop methodology for a system that is capable to recognize majority of common Indian bird species in field conditions. The system needs to be invariant for these conditions. This holds also for the new recordings because environmental conditions can change abruptly even if recording conditions would be the same. Segmentation is crucial for the following steps of classification because in this phase concurrent segments (syllables) are extracted from raw recordings.
In this work syllables were represented with 5 acoustical features. Spectral and Temporal features are extracted and analyzed. Extracted feature results are used to identify different bird species using Support Vector Machine. Different permutation and combinations of test and training data has been studied.
A
CKNOWLEDGEMENTI would like to thank my co-author and advisor Dr.Sudhir S. Kanade, Electronics and Telecommunication Engineering Department. Her guidance this paper work is carried out and their constant interest, encouragement and proper direction during completion of this work. I would also like to thank all the staff members of Electronics and Telecommunication Engineering Department for their co-operation and support.
REFERENCES
[1] C. K. Catchpole and P. J. B. Slater, Bird Song: Biological Themes and Variations. Cambridge, U.K.: Cambridge Univ. Press, 1995.
[2] W. H. Thorpe, Bird Song. Cambridge, U.K.: Cambridge Univ. Press, 1961.
[3] R. K. Potter, G. A. Kopp, and H. C. Green, Visible Speech. New York: Van Nostrand, 1947.
[4] B.-S. Shieh, “Song structure and micro geographic variation in a population of the Grey-cheeked Fulvetta (Alcippe morrisonia) at Shoushan nature park, southern Taiwan,” Zool. Stud., vol. 43, no. 1, pp. 132–141, 2004.
[5] P. J. Christie, D. J. Mennill, and L. M. Ratcliffe, “Chickadee song structure is individually distinctive over long-broadcast distances,” Behavior, vol. 141, no. 1, pp. 101–124, 2004.
[6] O. Tchernichovski, F. Nottebohm, C. E. Ho, B. Pesaran, and P. P. Mitra, “A procedure for an automated measurement of song similarity,” Animal Beh., vol. 59, pp. 1167–1176, 2000.
*7+ P. Galeotti and G. Pavan, “Individual recognition of male Tawny owls (Strix aluco) using spectrograms of their territorial calls,” Ethology, Ecology, Evol., vol. 3, no. 2, pp. 113–126, 1991.
*8+ K. Ito, K. Mori, and S. Iwasaki, “Application of dynamic programming matching to classification of budgerigar contact calls,”
J. Acoust. Soc. Amer., vol. 100, no. 6, pp. 3947–3956, Dec. 1996.
[9] C. Rogers, “High resolution analysis of bird sounds,” in Proc. IEEE Int. Conf. Acoust., Speech, Signal Process., 1995, pp. 3011–3014.
© 2015, IJCSMC All Rights Reserved 135
*11+ J. A. Kogan and D. Margoliash, “Automated recognition of bird song elements from continuous recordings using dynamic time warping and hidden Markov models: a comparative study,” J. Acoust. Soc. Amer., vol. 103, no. 4, pp. 2185–2196, Apr. 1998.
*12+ S. E. Anderson, A. S. Dave, and D. Margoliash, “Template-based automatic recognition of birdsong syllables from continuous recordings,” J. Acoust. Soc. Amer., vol. 100, no. 2, pp. 1209–1219, Aug. 1996.
[13] C. Kwan, G. Mei, X. Zhao, Z. Ren, R. Xu, V. Stanford, C. Rochet, J. Aube, and K. C. Ho, “Bird classification algorithms: Theory and experimental results,” in IEEE Int. Conf. Acoust., Speech, Signal Process. (ICASSP), Montreal, QC, Canada, pp. 289–292, May 2004.
[14] A. L. McIlraith and H. C. Card, “Birdsong recognition using backpropagation and multivariate statistics,” IEEE Trans. Signal Process., vol. 45, no. 11, pp. 2740–2748, Nov. 1997.
*15+ A. Härmä, “Automatic recognition of bird species based on sinusoidal modeling of syllables,” in IEEE Int. Conf. Acoust., Speech, Signal Processing (ICASSP), Hong Kong, China, pp. 545–548, Apr. 2003.
*16+ A. Härmä and P. Somervuo, “Classification of the harmonic structure in bird vocalization,” in IEEE Int. Conf. Acoust., Speech, Signal Processing (ICASSP), Montreal, QC, Canada, pp. 701–704, May 2004.
*17+ P. Somervuo and A. Härmä, “Bird song recognition based on syllable pair histograms,” in IEEE Int. Conf. Acoust, Speech, Signal Processing (ICASSP), Montreal, QC, Canada, pp. 825–828, May 2004.
*18+ A. S. King and J. McLelland, Eds., “Larynx and Trachea,” in Form and Function in Birds. New York: Academic, vol. 4, pp. 69– 103, 1989.
*19+ S. Fagerlund, “Automatic Recognition of Bird Species by Their Sounds,” M.S. thesis, Helsinki Univ. Technol., Espoo, Finland, 2004.