A COMPARATIVE ANALYSIS OF CONTINUOUS GAS
LIFT VALVE POSITIONING METHODS AND ITS
APPLICATION WITH MS EXCEL & VBA
Darsana Dutta, Palash Lochan Bordoloi, Pranjit Mahanta, Rajnib Borah,
Sarmistha Roy Choudhury, Subham Debnath, Prasun Banik
Department of Petroleum Engineering,
Dibrugarh University Institute of Engineering and Technology (India)
ABSTRACT
Studies in the past have made it clear that reservoir pressure and formation gas provide the natural energy in
the flowing well. When the reservoir energy is too low for the well to flow, it becomes necessary to put the well
on some form of artificial lift. The wide variety of parameters that are considered for lifting each barrel fluid by
artificial lift mode is a challenging and interesting task for petroleum engineers. Gas lift is the most widely
preferred artificial lift method in practice. It is a method where external source of high pressurized gas is used
for supplementing formation energy to lift the well fluid to the surface. Two types of gas lift are used to meet the
specific requirements. Continuous gas flow lift is used in wells with a high productivity index and a reasonably
high BHP relative to well depth. The heart of any gas lift installation is the gas lift valve. Proper designing of
gas lift system to locate the gas lift valve position for its better optimization and smooth operation has a great
influence on the efficiency of gas lift system. Our primary objective is to analyze the gas lift method with
emphasis on its operations, installations and the parameters affecting its design, performance and optimization.
We have put our inputs on the basic designing of gas lift by developing an application using MS Excel and
Visual basic, which will help in the positioning of side pocket mandrels (gas valves) in the tubing effectively. We
have used a set of procedures for our work, which includes the graphical and analytical methods. We have
formulated our program with a user-friendly interface. Conclusions have been drawn on the basis of efficiency
and accuracy levels.
Keywords: Analytical method, Continuous flow, Excel-Visual Basic Application
,
Gas lift valve,
Graphical method.
I. INTRODUCTION
of gas lift valves is an important criterion. Some valves are suitable for continuous, while some are for intermittent only. Some can be used for both types of lift as well.
The purpose of gas lift valves is to unload the fluids from the well so gas may be injected at the optimum point in the tubing string, to control the flow of injection gas both under operating and unloading conditions.
Fig.1: Operating valve in the mandrel and magnified operating valve[2] 1.1 Installation Operation for Continuous Gas Lift Valves
Prior to gas injection, a well is generally loaded with kill fluid. The injected gas displaces the kill fluid through the tubing which is termed as Unloading Operation. During unloading of the first gas lift valve, there occurs a surge in the wellhead tubing pressure and a decrease in the injection-gas casing pressure (surface operating pressure) as depth of injection gas increases. In continuous flow, all gas lift valves above an operating valve are closed.
As the injection gas is injected in the annular space, the injection gas pressure-at-depth increases as the kill-fluid level in the annulus is lowered. The injected gas enters the tubing through the open valves displacing some of the kill fluid to the surface. The lifting process starts as the injection gas enters through the first valve.
At initial stages, the pressure in casing and tubing are equal as U-tubing through the first valve occurs. Immediately after injection gas begins to enter the tubing through the next gas lift valve, the injection pressure in the casing (surface operating pressure) begins to decrease because the lower valve is set to open at lower pressure (surface operating pressure) than the valve above. Injection gas then enters through the valve below at a greater rate to the point where the injection gas pressure in the casing decreases for the upper valve to close. There occurs a decrease in the flowing-production pressure as injection gas enters the tubing through a new valve. The injection gas pressure-at-depth starts increasing due to decrease in opening force developed from decreasing flowing production pressure in tubing. But with further increase in the injection pressure, the flowing-production pressure-at-depth increases. But the pressure is to be set such that it does not result in opening of the upper valve. For the injection gas to enter a valve, the flowing production pressure in tubing should be less than injection gas pressure in the annular space.
1.2 Continuous flow gas lifts designs:
injection consists of both formation and injection gases. The entry of the injected gas into the tubing depicts the position where the valve is to be placed. This position can also be said to be the point of gas injection.
Determining this point of gas injection is generally based on various multiphasic correlations and gradient curves. If possible, field data validation is required to verify the accuracy of these results. At greater depths where sufficient field data is unavailable to determine the point of injection, bracketing operations are done. There are several gas lift installation methods but this paper mainly focuses on the design based on constant decrease in operating pressure for each succeeding lower valve. With a help of a set of formulae the depth at which a valve is to be placed can be determined. Along with depth, the operating injection gas pressure, flowing production pressure and temperature during unloadingcan also be calculated.
Determining the depth of each valve can be done with the help of two processes:
Analytical method
Graphical method
Analytical Method is based on a set of mathematical formulae which provides us the depth at which the gas lift valve is to be placed. It comprises of various steps which includes determination of flowing production pressure-at-depth, injection gas pressure and also unloading temperature. Analytical Method is generally tabulated on excel sheets which provides us faster and accurate results.
In graphical method, a depth v/s pressure plot is used to determine the depth considering various parameters like gas column weight in the well, kill fluid gradient, surface operating pressure etc. This method can also develop an approximate temperature v/s depth plot which enables the determination of the temperature of each valve at various depths installed in the well. Although it is a time consuming process, the depth derived is more accurate as compared to the analytical process.
II. METHODS
2.1 Determination of valve depths by Analytical method[1]
:
As the final injection-gas pressure is unknown until the installation is designed, a pressure difference of about 100-200 psi is assumed between injection pressure at depth in annulus and flowing-production pressure in tubing for the deepest valve1. The following steps are to be carried out:
Step 1: Determination of maximum unloading GLR based on injection-gas rate available for unloading and maximum daily flow rate.
Step 2: Calculation of unloading flowing pressure, Ppfd based on calculated GLR and flow-rate with the help of
multiphasic correlations.
Step 3: Unloading flowing-pressure-at-depth gradient, Gpfa above the point of gas injection is calculated, where
Ppfd is unloading flowing pressure at depth, Pwhu is well-head pressure, Dd is reference depth.
Gpfa = (Ppfd- Pwhu) (i)
DD
Step 4: Injection-gas pressure-at-depth gradient, Ggio is calculated from surface injection gas pressure, Pio and
injection-gas pressure at depth, Piod.
Ggio= (Piod-Pio) (ii)
Step 5: Calculating unloading temperature-at-depth gradient, Gtvu from surface well-head temperature, Twhu and
bottom-hole temperature, Twsd.
Gtvu = (Twsd- Twhu) (iii)
DD
Step 6: Calculation of top gas lift valve depth,Dv1.
Dv1= (Pko-Pwhu-ΔPsd) (iv)
(gls-ggio)
Step 7: Minimum flowing production pressure, [PpfD(n)]min , Injection gas pressure, Piod(n) and unloading gas lift
valve temperature, TvuD(n) is calculated from the following relations.
a. [Ppfd(n)]min = Pwhu + Gpfa[Dv(n)] (v)
b. PioD(n)= Pio+ Ggio[Dv(n)] (vi)
c. TvuD(n)= Twhu + Gtvu [Dv(n)] (vii)
Step 8: Calculation depth of next valves:
Dv (n)= Dv (n-1) +
Distance between valves, Dbv:
Dbv= PioD (n-1) – [(n-1) Δ Pio] - [Ppfd (n-1)] min- ΔPsD
(gls - ggio) (ix)
When this distance Dbv is less than the assigned minimum distance, then to calculate the position of the next
valve Dbv (min) is added to the depth of the preceding valve.
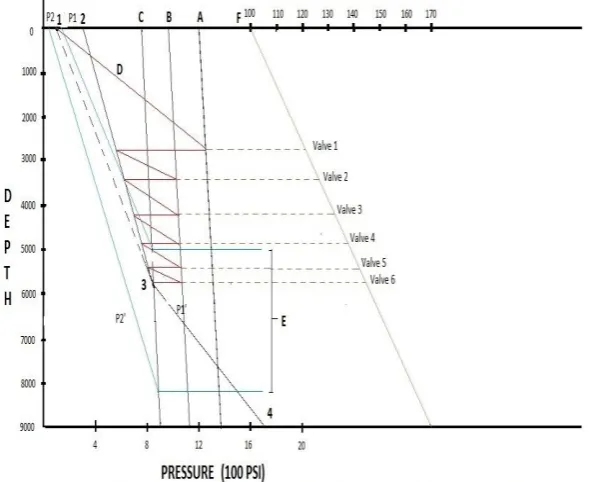
2.2 Determination of valve depths by Graphical method [2]:
We plot a graph, with pressure (psi) in X-axis & depth (feet) in Y-axis.
We plot the kick off pressure (Pko), surface operating pressure (Pso) & Pso-Pwh.
We draw the injection gas pressure line, surface operating pressure line & Pso-Pwh line including the gas
column weight in the wellbore (as per well data).
We find Pwf by using the relation “PI=Q/(Pr-Pwf)” & locate the point. This calculates the flowing bottom
hole pressure
Now, with the help of vertical flowing pressure gradients corresponding to the available well data, we find the point of gas injection [point of intersection between the extended Pwf line & the (Pso - Pwh) line].
We draw the design tubing pressure line from the surface to the point of gas injection. This line starts from a surface pressure of Pwh+0.2(Pso) or Pwh+200 whichever is greater.
We locate the first valve by drawing a line having the kill fluid gradient (as per well data). This line begins at the wellhead pressure and is extended downward until intersecting the kick-off gas pressure line.
The rest of the valves are now spaced to the injection point as follows:
1. From the location of valve#1, extending a line horizontally to the left until intersecting the design tubing pressure line.
2. From the previous extended point, extending a line downward parallel to the line including the kill fluid gradient until intersecting the operating pressure line at the surface. This locates the valve#2.
3. We repeat the procedure of (2) until reaching the point of gas injection or below.
PioD (n-1) – [(n-1) Δ Pio] - [Ppfd (n-1)] min- ΔPsD
Taking a different X-axis as temperature (oF) with a common Y-axis as depth (feet), we draw an inclined line considering the geothermal temperature gradient, surface tempr and bottom tempr.
Bracketting is the procedure which allows valves to be installed below the point of gas injection. In practical cases several valves can be placed below the point of gas injection to optimize the oil recovery. The placing of valves depends on various well characteristics such as decreasing static BHP and variation in productivity.
Bracketting procedure [2]:
o Plot the gas gradient line for the operating casing pressure.
o Subtract the desired operating differential from the surface operating pressure (say x). Draw a line parallel to the surface operating pressure starting at „x‟ at the surface.
o Construct the flowing tubing pressure gradient for the desired production rate and GLR. Draw this gradient down from the flowing wellhead pressure until it meets the casing pressure differential line. Calculate pressures which are 20% or 10% (percentage error) greater or less than the flowing wellhead pressure. Locate and mark P1 and P2 on the pressure vs. depth graph (P1 = Pwh + 0.2 Pwh;P2 = Pwh – 0.2 Pwh).
o Find the pressure where the flowing tubing pressure gradient intersects the casing pressure differential line. Plot this point as P1‟ and similarly plot a point P2‟.
o Now, locate and mark the point where the line P1 P1‟ intersects the casing pressure differential line. This
depth is where the bracketing envelope should start.
o Similarly, the intersecting point for the line P2 P2‟ and the casing pressure differential line will give the
approximate depth where the bracketting envelope should stop.
Now, the temperature of each valve in the bracketing envelope can be determined by the previously discussed procedure.
III. DATA ENTRY VISUAL BASIC USERFORM
Depth of the valve Flowing production pressure Injection gas pressure Unloading temperature Dv (in feet) Ppfd (in psi) PioD (in psi) TvuD (in ◦F) Tubing length 8000 ft
Daily flow rate 800 STB/day 1 1928.530913 292.8530913 1037.12422 116.8746455 Bottom Hole Temperature 170 ⁰F 2 3458.357638 445.8357638 1066.573385 130.2606293 Unloading Temperature 100 ⁰F 3 4662.526942 566.2526942 1089.753644 140.7971107 Kill Fluid Gradient 0.46 psi/ft 4 5600.702664 660.0702664 1107.813526 149.0061483 U-tubing Well Head Pressure 100 psi 5 6321.617604 732.1617604 1121.691139 155.314154 Flowing Well Head Pressure 100 psi 6 6865.076205 786.5076205 1132.152717 160.0694168 Kick-off Pressure 1000 psi 7 7263.590321 826.3590321 1139.824114 163.5564153 Injection Gas Pressure 1000 psi 8 7543.715293 854.3715293 1145.216519 166.0075088 Daily Gas Injection Rate 800000 SCF/day 9 7727.141249 872.7141249 1148.747469 167.6124859 Wellhead Injection Temperature 100 ⁰F 10 7831.584458 883.1584458 1150.758001 168.526364 Valve Spacing Pressure Differential 50 psi
Minimum Decrease in Surface Operating Pressure Between Valves 20 psi Flowing Production Pressure 900 psi Static Injection Gas Pressure 1154 psi Unloading Flowing Pressure At Depth Gradient 0.1 psi/ft Static Injection Gas Pressure At Depth Gradient 0.01925 psi/ft Unloading Gas Lift Valve Temperature At Depth Gradient 0.00875 ⁰F/ft
WELL DATA VALUES UNIT VALVE NO.
CALCULATE CLEAR
Fig. 2: Excel-visual basic interface of analytical gas lift valve positioning layout.
The figure below represents the graphical solution achieved using the input data of a well. The output results shows the valve locations downhole, unloading temperature and also represents the bracketing envelope below point of gas injection.
IV. RESULT
method can be used for determining the parameters simultaneously for a number of wells provided the well data is available, thus enabling large scale execution.
On the other hand, graphical method involves repeating the entire process for different wells again and again (time consuming process).
V. APPLICATION
The analytical method when used in accordance with excel and visual basics interface creates a medium for non-technical users to calculate the desired parameters. With better knowledge of coding and designing in visual basics, the interface can be used as a software which could be promising in terms of creating a user friendly console. The software would enable users to calculate the desired parameters with a single click of a button irrespective of the user‟s knowledge. Moreover, in the times to come we have provisions of calculating others parameters like the port size of the valve, injection gas volume and volume of production gas.
VI. CONCLUSION
This paper gives an idea of the various procedures that could be used to find the depths of valves to be installed in the continuous gas lift operation. The positioning of the gas lift is vital in aerating the fluid in the well thereby enhancing the overall recovery of hydrocarbons.
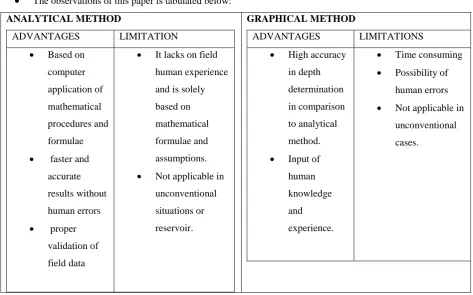
The observations of this paper is tabulated below:ANALYTICAL METHOD
ADVANTAGES LIMITATION
Based on computer application of mathematical procedures and formulae
faster and accurate results without human errors
proper validation of field data
It lacks on field human experience and is solely based on mathematical formulae and assumptions.
Not applicable in unconventional situations or reservoir.
GRAPHICAL METHOD
ADVANTAGES LIMITATIONS
High accuracy in depth determination in comparison to analytical method.
Input of human knowledge and experience.
Time consuming
Possibility of human errors
Not applicable in unconventional cases.
REFERENCES
[1] Herald W. Winkler, SPE Petroleum Engineering Handbook Volume-IV, Gas Lift Valves, page: IV-567. [2] Kermit Brown, The technology of Artificial Lift Methods-Volume 2a, page 224-228.
[3] Blann, J.R., Brown, J.S., and Dufresne, L.P.: “Improving Gas Lift Performance in a Large North African Oil Field,” paper SPE 8408 presented at the 1979 SPE Annual Technical Conference and Exhibition, Las Vegas, Nevada, 23-26 September.
[4] RP11V7, Recommended Practice for Repair, Testing and Setting Gas Lift Valves, first edition, API, Washinton, DC (1995).
[5] Winkler, H.W. and Smith, S.S.: Camco Gas Lift manual, Camco Inc., Houston (1962) A2-001. [6] Schlumberger, Gas Lift design and technology, Schlumberger, Ed.
[7] Takacs, G., Gas Lift Manual. Pennwell Books.
[8] S. Limited, “The Oilfield glossary – Schlumberger oilfield glossary”. [Online]. Available: http://www.glossary.oilfield.slb.com