277 |
P a g e
DESIGN OF FLEXIBLE PAVEMENT AND
STABILIZING SUB GRADE SOIL WITH COIR WASTE
Nandish M K
1, Chethan Kumar N T
21
Lecturer,
Department of Civil Engg, Government Polytechnic Bantwal,
Dakshina Kannada - 574211, INDIA
2
Assistant Professor Department of Civil Engg, Sahyadri College of Engineering and Management,
Mangalore – 575007,INDIA
ABSTRACT:
Mangalore Dharmasthala highway is one of the important road in Dakshina Kannada District in Karnataka State. Along the highway are two major junctions Bantwal cross road and Bantwal Bypass junction,distance between them is 2.6km long and the road lies arterially to the town ,itself a pilgrimage road attracting more number of commercial vehicles day and night . At present traffic data suggests the LOS as D means conditions of approaching unstable flow and the drivers are restricted in freedom to select desired speed, the projected LOS in 2019 is F representing stage of breakdown. So the paper deals with the study on design of pavement, traffic count and improvement in geometric conditions. The soil samples collected 1feet down, was tested for CBR and the result was only 3 %,so in order to reduce the pavement thickness, to make the project economical soil stabilization is proposed.. Coir waste consisting of coir pith and coir fibre is a by-product of coir manufacturing industry obtained from coconut husk during the extraction of coir fibre. This method has the dual advantage of increasing the strength of soil and a solution for the problematic disposal of such wastes\
Keywords: Pavement design, Traffic volume, Level Of Service Coir pith, coir fibre , California
bearing ratio
1. INTRODUCTION:
278 |
P a g e
street ought to be intended to give ideal effectiveness greatest security at sensible cost. Streets constitute an essential piece of the framework. In India a large portion of the streets are developed utilizing adaptable asphalt outline ideas because of their low development and support cost.Adaptable asphalt are made up of a mixture of bitumen and coarse aggregates which are laid in different layers, with different sizes. It is laid on water bound macadam, Wet mix macadam,granular sub base layers. The standards, specifications definition depends on traffic load, locality, terrain and climatic conditions.
The basic principle of the arrangement of different layers of adaptable asphalt is that when a mass is acting on the pavement , the force of that mass is reduced when it is transmitted downwards through the surfaces, different layers acting in integrity provides sufficient resistance to the mass and conveys it into the ground through subsequent layers of granular material.
Adaptable Pavements are broadly utilized notwithstanding a few questions in regards to the financial matters under various conditions. Two most essential parameters that oversee the asphalt configuration are soil sub-review and movement stacking. The Indian rules for the outline of adaptable asphalts utilize soil sub-review quality as far as standard proctor compaction test ,California Bearing Ratio and activity stacking as far as million standard axles(msa).
2. MATERIALS AND METHODOLOGY
A methodology based on technically sound information will have to be formulated before collecting the data and its analysis. The various stages are presented below.
Stage 1: Reconnaissance Survey Stage 2: Road Inventory Survey
Stage 3: Traffic Survey and Data Collection Stage 4: Surveying Details
Stage 5: Geometric Design considerations 2.1 Reconnaissance Survey
Surveillance study of the review extend has been done by visual perceptions as it were. Its motivation is to dispense with those courses or destinations which are unrealistic or unfeasible and to recognize the all the more encouraging courses or locales. Existing maps and elevated photography can be an awesome help to this overview
2.2 Road Inventory Survey
279 |
P a g e
2.3 Traffic Survey And Data CollectionTraffic count is essential to obtain movement of vehicles and their classification over a period covering 4days, 10-hrs count which includes morning and evening peak made according to “Traffic census on Non-Urban Roads”
Indian Road Congress : 9-1972 using manual counting method. The data are collected and entered in the field data sheet.
2.4 Geometric Design
Geometric outline is a part of parkway configuration managing the unmistakable measurements of roadway. It incorporates the plan components of level and vertical arrangement, locate separate, cross-segment parts, sidelong and vertical clearances. Roadway geometrics are the parameters that make an all around planned office and are built up as the capacity of configuration speed. The plan speed is controlled by assessing the utilization of that street, utilization of that adjoining land, and the normal movement volume on that street. Once the outline speed is built up, the roadway vertical and flat arrangements are set to travel securely at that speed. The geometric plan of roadway ought to be intended to give ideal proficiency in activity operations with greatest security at sensible cost .
2.5 Surveying Details
Surveying is an art of making measurements and determining the relative position of different objects on the surface of earth. In road survey the first step is leveling. The leveling work is carried out using instrument such as total station, dumpy level, cross staff and leveling staff .Other instrument such as Prismatic compass to find the bearings of the alignment, arrows and ranging rods to make the points on the field are also used.
2.6 Longitudinal Sectioning
It is the process of determining the elevation of points at fixed intervals long the chain line. Here the line along which the elevation is to be taken is marked by ranging rods , and the bearings of the line is taken with the help of Prismatic compass. Here the existing road is almost leveled and hence there is no much undulations along the chain length. Then using Total Station the readings were taken at an interval of 10m up to a chain age of 2600m.
2.7 Cross Sectioning
280 |
P a g e
foot and bicyclists because of low request. Cross segment were taken at an interim of 20m . As the width of existing street is 18m, crystal is put at 3, 6 and 9m on both side from the focal point of arrangement at an interim of 50m.3. SOIL CLASSIFICATION
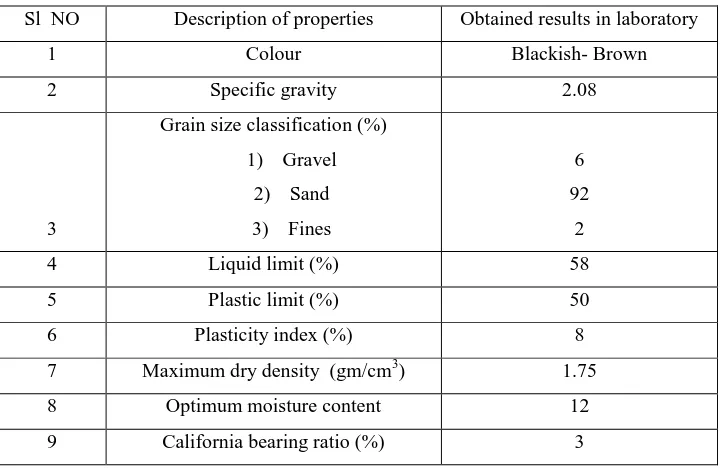
Fig 1 shows Poor graded sand collected at chainage of 1500m after digging to a depth of 300mm.
Table 1 Shows properties of poor graded sand
Sl NO Description of properties Obtained results in laboratory
1 Colour Blackish- Brown
2 Specific gravity 2.08
3
Grain size classification (%) 1) Gravel
2) Sand 3) Fines
6 92
2
4 Liquid limit (%) 58
5 Plastic limit (%) 50
6 Plasticity index (%) 8
7 Maximum dry density (gm/cm3) 1.75
8 Optimum moisture content 12
9 California bearing ratio (%) 3
4. INTRODUCTION TO THE COIR WASTE
281 |
P a g e
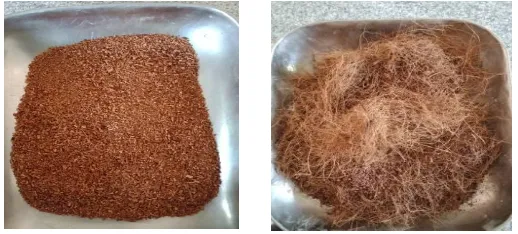
collected from Renuka Coir Products Gundakanahalli, Arsikere district, Karnataka. The coir wastes were allowed to sundry and made moisture free before it was used for the experiments.. The coir waste consists of coir pith commonly called coir dust along with short coir fibers. After sun drying the coir wastes were sieved in 4.75mm sieve, coir pith and fibers were separated. The waste materials passing 4.75mm sieve was designated as coir pith and the short to long fibres that retained on the sieve was designated as coir fibers.Fig 2 shows coir pith and fiber collected from Renuka Coir Products Gundakanahalli, Arsikere
district, Karnataka
4.1 Sample Preparation
The sample soil was brought from the site and allowed to dry for 2 to 3 days, then the material was sieved in a 4.75mm sieve. The unwanted materials such as plastic, husk, glass are removed from the soil. The sample is used for the tests Soil tests such as such as specific gravity, Atterberg’s limits, , compaction characteristics of the particular
soil selected for this study were determined in the laboratory as per IS 2720.
The tests were carried out for various percentages of addition of coir pith content in the range of 0, 0.5, 1.0, 2.0% and coir fiber content by 0, 0.3, 0.6, 0.9% of dry weight of soil. Coir fibers was varied in small percentages for modulated blending and conducting the tests. . With different percentages of coir pith (0, 0.5, 1.0, 2.0% by dry weight of soil) and coir fiber (0, 0.3, 0.6, 0.9% by dry weight of soil) Standard Proctor test was conducted as per IS 2720 Part VII (1980). The effect of coir pith, coir fiber content and combined effect of coir fiber and pith were studied. on the Maximum Dry Density (MDD) and Optimum Moisture Content (OMC) of soil
282 |
P a g e
5. EXPERIMENTAL METHODOLOGIES
To study the different properties of soil before and after the addition of coir pith and coir fibre following laboratory tests were conducted.
1. Atterberg’s Limit
2 .Compaction Test
3 .California bearing ratio tests (CBR) – soaked and un soaked
5.1 Atterberg’s Limits
Graph 1 : showing variation of Liquid limit and Plastic limit with % addition of coir pith Graph 2 : showing variation of Liquid limit and Plastic limit with % addition of coir fibre Graph 3 : showing variation of MDD & OMC with % addition of coir pith
Graph 4 : showing variation of MDD & OMC with % addition of coir
283 |
P a g e
5.2 California Bearing Ratio (CBR)
In order to check the bearing capacity of the sub grade soil California bearing ratio test is conducted.. This test is conducted to check the stiffness and resilient modulus of the soil in the laboratory by preparing samples of the soil under various circumstances. CBR test guides us to decide the thickness of the pavement . The un soaked CBR esteems give the thought regarding the quality and bearing capacity of soil.
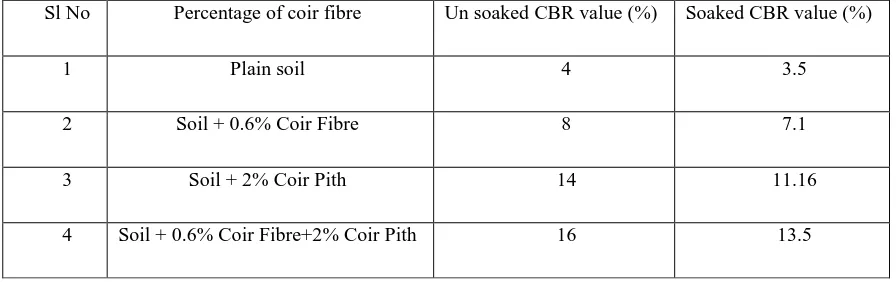
The CBR value of the soil sample mixed with optimum percentage of coir fiber and coir pith was obtained as 13.5 % which is 3.9 times the CBR value of the plain soil. There is an increase in the CBR value with the addition of coir material .The California bearing tests will be conducted in soaked and un soaked condition to understand the behavior of the soil during monsoon and summer season. It is understood from test results that CBR value will be higher in un soaked state than soaked state .
5.2.1 Results of CBR Test for soil stabilized with coir pith and coir fibres
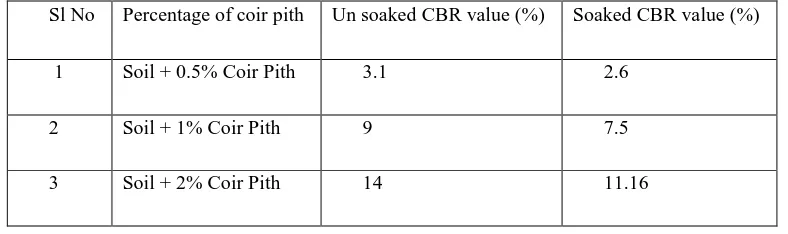
Table 2 shows Results of CBR with % addition of coir pith
Sl No Percentage of coir pith Un soaked CBR value (%) Soaked CBR value (%)
1 Soil + 0.5% Coir Pith 3.1 2.6
2 Soil + 1% Coir Pith 9 7.5
3 Soil + 2% Coir Pith 14 11.16
Table 3 shows Results of CBR with % addition of coir fibre
Sl No Percentage of coir fibre Un soaked CBR value (%) Soaked CBR value (%)
1 Soil + 0.3% Coir Fibre 4 3.5
2 Soil + 0.6% Coir Fibre 8 7.1
284 |
P a g e
Table 4 shows Results of CBR with % addition of coir pith + fibre
6. Traffic Volume Count
The existing road NH 73 belongs to Bantwal village which connects to NH 275 at B C Road junction. Traffic data was collected on both the directions for four days from 02/01/2018 to 05/01/2018. Traffic consists of Trucks, Multi Axle Vehicle, Light Commercial Vehicle, Bus, Tempo, Car, Motorcycle, Auto, Bicycle and Tractors. The peak annual average daily traffic is . 1131 PCU/hr.
7. Level of Service
A term firmly identified with limit and frequently mistaken for it's administration volume. The level of service gives a qualitative measure of the comfort ,service offered by the road were as limit gives us the quantity measure. The goal of LOS is to relate the traffic benefit quality to a given flow rate of traffic. It is a term that assigns a scope of working conditions on a specific kind of office. Parkway limit manual (HCM) created by the transportation inquire about leading group of USA gives some methodology to decide level of administration.
Table 4 Shows the nature of traffic classified into six levels extending from level A to level F.
LOS V/C
A 0.35
B 0.55
C 0.77
D 0.92
E 1
F >1
Sl No Percentage of coir fibre Un soaked CBR value (%) Soaked CBR value (%)
1 Plain soil 4 3.5
2 Soil + 0.6% Coir Fibre 8 7.1
3 Soil + 2% Coir Pith 14 11.16
285 |
P a g e
As per IRC 106-1990 the given urban stretch is sub arterial road. Therefore the capacity of two lane (two-way) sub arterial road is 1200PCU/Hour.Annual average daily traffic in both directions Bantwal Bypass to B.C.road =1131 PCU/Hr
LOS = VOLUME/CAPACITY
LOS= 1131/1200
LOS= 0.94
For Bantwal Bypass to B.C.road in both directions the V/C ratio was found to be 0.94, hence as per IRC- 106-1990 the Level of Service “D”
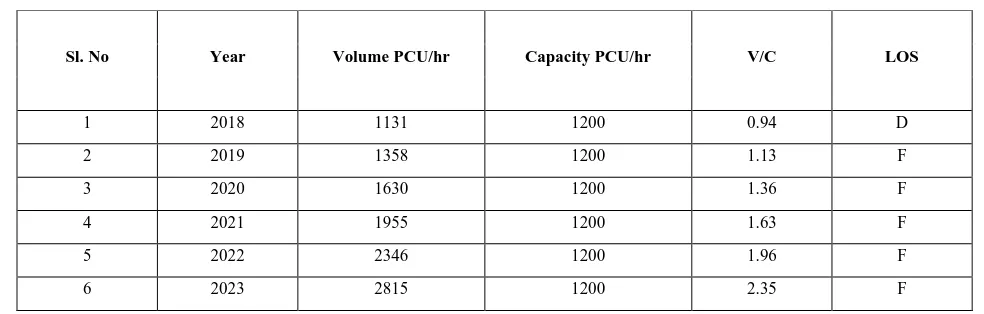
7.1 Traffic Projection At Selected Site
Based on the codal provisions pavement designs are demonstrated for sub grade, CBR values between 2% to 10% and design traffic between 1 MSA to 150 MSA for an average annual pavement temperature of 350 C. thus obtained thicknesses have been partially modified to cater to the stage construction
Table 5 shows projection of traffic in next 5years and corresponding LOS
8. Pavement Thickness Design Charts
As per IRC 37 – 2012 two charts are available chart to carry the design traffic load in MSA 1 for traffic between 1 – 10MSA and chart 2 for 10 – 150 MSA . The thickness of the pavement depends on MSA for different soil
sub-grade.
Sl. No Year Volume PCU/hr Capacity PCU/hr V/C LOS
1 2018 1131 1200 0.94 D
2 2019 1358 1200 1.13 F
3 2020 1630 1200 1.36 F
4 2021 1955 1200 1.63 F
5 2022 2346 1200 1.96 F
286 |
P a g e
CBR values from 2 % to 10 %. The pavement thickness will be fixed by referring to the chart corresponding to these inputs. The total pavement thickness comprises of granular sub-base, granular base and bituminous surfacing. Based on the following recommendations and corresponding tables varies layers of the pavement are designed8.1 Flexible Pavement Design Using IRC: 37-2012
In order to proceed with the pavement design the pavement thickness is decided based on the million standard axles (repetitive load) coming from projected traffic up to design years . Design Traffic loads were computed using the following equation:
N = 365 x { (1 + r )n − 1} x A x D x F/r
The traffic in the year of completion is estimated using the following formula:
A=P (1+r/100) x
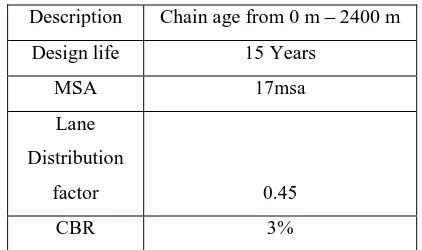
8.2 Design of Flexible Pavement Using IRC
Table 6 Shows design Inputs for proposed road
Description Chain age from 0 m – 2400 m
Design life 15 Years
MSA 17msa
Lane Distribution
factor 0.45
CBR 3%
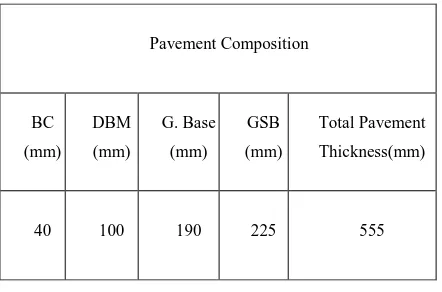
Table 7 gives the flexible pavement composition
Pavement Composition
BC (mm)
DBM (mm)
G. Base (mm)
GSB (mm)
Total Pavement Thickness(mm)
287 |
P a g e
Table 8 shows design Inputs for proposed road after stabilization
Table 9 gives the flexible pavement composition
10 . Conclusion
Soil and the waste material of coir products such as coir pith and coir fiber mixture can be used for stabilizing the soil up to certain limits. As per the present traffic data the LOS is D which suggests conditions of approaching unstable flow and the drivers are restricted in freedom to select desired speed , the projected LOS in 2019 is F representing stage of breakdown .So this report could serve as a guideline to initiate the project. The existing carriageway is two lane and the number of commercial vehicles 512 PCU/hr which shows that the traffic is approaching the critical limit, the density of vehicles is more and the hindrances to reach the destination in time. So four laning is required for bringing LOS to A. The soil samples were collected at chain age 1500m ,samples were tested for CBR and the results of the soil collected was 3 % ,so in order to decrease the thickness of the pavement the soil should be stabilized to raise the CBR..It was observed that CBR value of the soil increased from 3.1 % to 9% on addition of 1% coir pith under un soaked condition, from 9 % to 14% on addition of 2 % coir pith. So a moderate amount of pith could be added to raise the CBR value. It was observed that the CBR value increased from 4 % to 8% on addition of 0.6 % coir fiber under un soaked condition, from 8% to 12 % on addition of 0.9 % coir fiber. So 0.6 % of coir fiber could be suggested to use. Finally CBR test was conducted on soil adding 0.6 % of coir
Description Chain age from 0 m – 2400 m
Design life 15 Years
MSA 17msa
Lane Distribution
factor 0.45
CBR 13.5%
Pavement Composition
BC
(mm)
DBM
(mm)
G. Base
(mm)
GSB
(mm)
Total Pavement
Thickness(mm)
288 |
P a g e
fiber and 2 % of coir pith the CBR increased from 8 to 16 % under un soaked condition, from 7.1 % to 13.5 % under soaked conditions.REFERENCES
Journal Articles
[1] Beena K. S. and Santhosh G. (2013). Studies on strength characteristics of soil mixed with bio-waste. Proceedings of Indian Geotechnical Conference.
[2] Chandra S., Viladkar M. N. and Nagrale P. P. (2008). Mechanistic approach for fiber-reinforced flexible pavements. Journal of Transportation Engineering, ASCE, 134(1):15-23.
[3] Chaple P. M. and Dhatrak A. I. (2013). Performance of coir fiber reinforced clayey soil. The International Journal of Engineering and Science, 2(4):54-64
[4] Leema Peter, P K Jayasree, K Balan , Alaka Raj S , Laboratory Investigation In The Improvement Of Subgrade Characteristics Of Expansive Soil Stabilised With Coir Waste
[5] Haslinda Nahazanan ,Bujang B.K. Huat , Afshin Asadi , Vivi Anggraini ,Effects of coir fibers on tensile and compressive strength of lime treated soft soil
[6] Bijayananda Mohanty , Mahipal Singh Chauhan, Satyendra Mittal ,Performance evaluation of silty sand subgrade reinforced with fly ash and fibre
[7] Ledjane Silva Barreto, Jhonatas Augusto Rocha Vieira , Gisela Azevedo Menezes Brasileiro , Use of coir pith particles in composites with Portland cement.
[8] Prof. A.K.Pate , Sathawara Jigar K., comparison between soaked and unsoaked cbr .
[9] Yu-Ker Woh , Rachel Wang , Kheng Lim Go Probing the hydrophilicity of coir fibres: analysis of the mechanicalproperties of single coir fibres
Book Chapters
[1] S.K. Khanna C.E.G. Justo , A.Veeragavan ,Highway Engineering. [2] Dr . L.R.Kadiyali ,Traffic Engineering
IRC codes
[1] IRC 106-1990 and IRC 37-2012
[2] IS:2720 (Part 1). 1979. Method of test for Soils: Part 1, Preparation of Dry Soil Samples forVarious Tests. [3] IS:2720 (Part 4). 1979. Method of test for Soils: Part 4, Grain Size Analysis.