618 | P a g e
DEVELOPMENT OF WIRELESS CHANNEL
SIMULATOR USING LABVIEW
Pitike Manisha
1, Dr. B. Venkateshulu
2 1M.Tech, Dept. of ECE ,GNITS, Hyderabad, Telangana, (India)
2
Professor, Dept. of ECE, GNITS, Hyderabad, Telangana, (India)
ABSTRACT
In the design of a digital communication link an assessment of its performance and reliability in the desired operational environments is required. Thus for clear understanding of wireless channels, their multipath and time variations should be characterized properly and suitable channel model should be developed. A class of aeronautical channel models is proposed for en-route, taxi, arrival and take-off situations. In this paper the different airborne channel and airborne scenario during different stages of a flight of an aircraft are presented and implemented by using MATLAB.A channel simulator is developed on Wideband Digital Scanning Transceiver using LabVIEW. Wideband Digital Scanning Transceiver is capable of recording and playing back faded signals which are practical solutions for testing receivers under signal fading and multipath conditions.
Keywords: Airborne scenarios, Channel simulator,Multipath propagation,VSA and VSG.
I.INTRODUCTION
The development of channel model for wireless communication system is currently becoming important to
fulfill the entire user’s requirements and increasing demand where to provide a good communication link
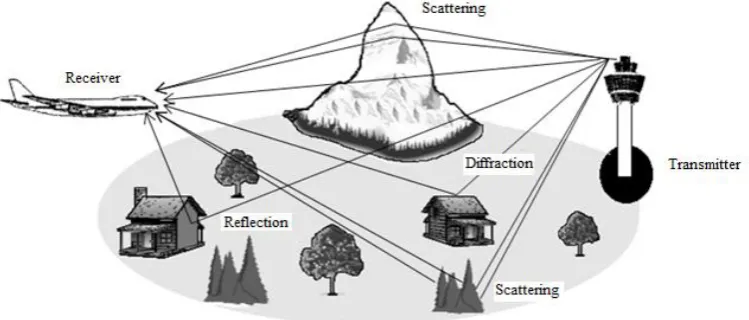
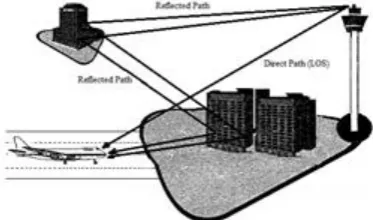
between the users at everywhere and anytime. In wireless environment, transmitted signals are received through
multiple paths due to reflection, scattering, and diffraction which results in fading of the received signal. The
different paths have different propagation delays, attenuation and phase.Reflection, scattering and diffraction
with direct line of sight path are shown in Fig. 1. They are known as multipath propagation and result in fading
of the signal due to constructive and destructive superposition.
619 | P a g e
II.
AERONAUTICAL CHANNEL MODELS
The different channel scenarios are occurred due to the different conditions during the flight of an aircraft.
These scenarios are characterized by the type of fading (Rayleigh or Rician fading), the Doppler (Fast or Slow
fading), and the delays in the system, where the Doppler and the delay power spectra represent the diffuse
scattered multipath components. Rice factor is the power ratio between the LOS and the diffuse components and
is given by
or (1)
where is the amplitude of the LOS path and is the variance of the diffuse component with
zero-mean quadrature components. For a simple implementation of the multipath fading channel models, it is
required that the mean throughput power remain unchanged, i.e., Then the
following normalization as a function of the Rice factor is obtained.
and (2)
If , then (Rayleigh fading), whereas then (additive
white Gaussian noise).
1.1 En-Route Scenario
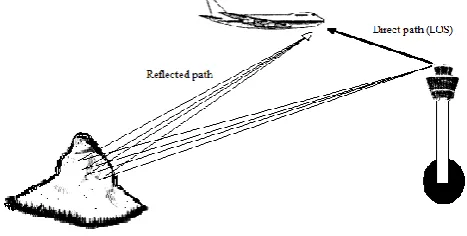
The en-route scenario is applied in the case where the aircraft is airborne and engaged in ground–air or air–air
communication, as shown in Fig. 2. Ground–air communication is the link between a base station on the ground
and an aircraft. Air–air communication is the link between two air-borne aircrafts.
1) Type of Fading: The multipath channel consists of an LOS path as well as a cluster of reflected, delayed
paths. Therefore, the en-route scenario is characterized by a two-ray model which is show in the Fig. 4. The
direct path which is LOS is modeled as a constant process and the cluster of reflected components i.e.
diffuse channel component as a Rayleigh process. Therefore channel is Rician with typical Rice factor of
about .
Fig. 2 Multipath propagation for en-route scenario
2)Doppler: In this scenario the velocity of aircraft are for ground–air links and
for air–air links. The maximum Doppler shift of 7333.3 Hz is obtained. Thus the Doppler
spread is very high and en-route scenario is characterized by fast fading.
The scattered components are typically not isotropically distributed, i.e., the beamwidth of the scattered
620 | P a g e
corresponding Doppler spectrum was derived, assuming that the scatters are uniformly distributed within thebeamwidth [1]. This non-isotropical distribution results in a Doppler probability density function and given by
[2], [3]
(3)
Also, the beamwidth depends on the distance between the transmitter and receiver and the beamwidth is likely
to decrease with increasing distance. In this case the distance between transmitter and receiver is more and
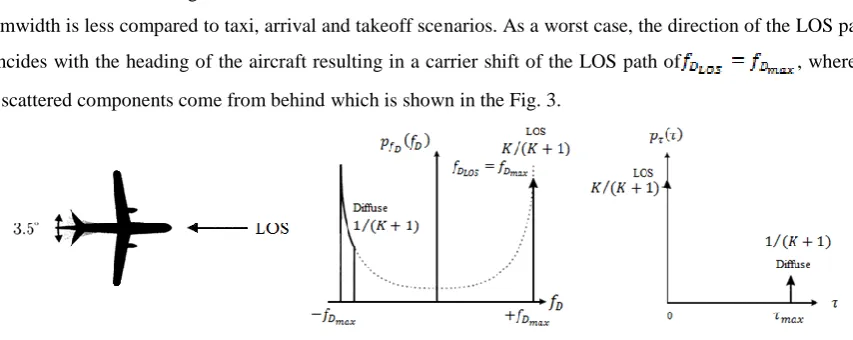
beamwidth is less compared to taxi, arrival and takeoff scenarios. As a worst case, the direction of the LOS path
coincides with the heading of the aircraft resulting in a carrier shift of the LOS path of , whereas
the scattered components come from behind which is shown in the Fig. 3.
Fig. 3 Doppler power spectrum and delay power spectrum for en-route scenario
3)Delay: According to simple geometrical analysis during the flight, the aircraft distance to the base station is
large compared to its altitude, so that the projected distance on the ground is about the same as the real distance.
If now reflection, scattering, or diffraction occurs on objects on the ground, the maximum detour distance can be
estimated to be the aircraft altitude for ground–air communication and twice the altitude for air–air
communication i.e. for ground–air links and for air–air links, if one dominant reflector is
present, where is the altitude of the aircraft. Assuming a typical maximum altitude of 10 km, maximum delay
of for ground–air links and for air–air links is obtained.Doppler and delay power spectra are shown
in Fig. 3.
Fig. 4 Two ray model
1.2
Arrival and Takeoff Scenario
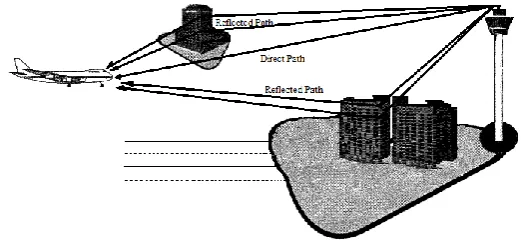
The arrival is applied when the aircraft is engaged in ground–air communication, already has left its cruising
621 | P a g e
combination of the en-route scenario and the taxi scenario. It is un-likely to be the worst case, but since theaeronautical data link is particularly used during the arrival of an aircraft at the air-port, a special arrival
scenario is proposed here for this case. A takeoff scenario would be similar with the difference of inverted
Doppler frequencies.
Fig. 5 Multipath propagation for arrival scenario
1) Type of Fading: The LOS path is present during the arrival while the aircraft is still airborneand the LOS
component is modeled as constant process. On the other hand, there will also be scattered path components,
mainly from buildings at the airport itself that can be modeled by a Rayleigh process. Thus the channel is
Rician channel with the Rice factor of .
2) Doppler: The velocity of an aircraft is in the range of during the arrival of the aircraft.
The scenario is characterized by fast fading and the Doppler spread is more but it is less compared to
en-route scenario. The maximum Doppler shift of 2500 Hz is obtained which is less than en-en-route scenario.
The scattered components are not isotropically distributed but are assumed to arrive at the front of the
aircraft. Generally the base station will be located at the airport itself, so that the scattered components will
result from reflections on buildings, aircrafts, or other obstacles in the airport area. Therefore beamwidth of
the scattered components is which is broader than in the en-route environment but typically will
be narrower than in the taxi environment. The LOS path is assumed to arrive directly in front of the aircraft,
resulting in a carrier shift of the LOS path of .
3) Delay: Since the aircraft is still some distance away from the airport, excess delay is 7 is obtained. This
is equal to =2100 m. The limit stays below the value for en-route scenarios. The delay power spectrum is
likely to switch from a two-ray scenario toward exponentially decreasing as shown in Fig. 6. The pdf of
such a one-sided delay power spectrum is expressed by
(4)
622 | P a g e
Fig. 6 Doppler power spectrum and delay power spectrum for arrival scenario
1.3 Taxi Scenario
The taxi scenario is applied when the aircraft is on the ground and travelling toward or from the terminal, as
shown in Fig. 7.
Fig. 7 Multipath propagation for taxi scenario
1) Type of Fading:In taxi scenario both LOS and diffuse components are present hence it is modeled as Rician
channel.
2) Doppler:The velocity of aircraft is in the range of . Thus this scenario is characterized by
slow fading and Doppler spread is less. The Doppler shift of 250 Hz is obtained.As a worst case, 2-D
isotropic scattering can be assumed, i.e., the echoes are assumed to arrive equally distributed from all
directions within a plane i.e. the beamwidth of the scattered components is β=360. The LOS path is
assumed to come slantwise from the front, resulting in a carrier shift of the LOS path of .
3) Delay:A maximum delay of corresponding to is obtained. The delay is
exponentially decreasing with a slope time of [1].
623 | P a g e
1.4
DEVELOPMENT OF CHANNEL MODEL
The aeronautical channel model is developed based on WSSUS (Wide SenseStationary Uncorrelated
Scattering).
Then time-varying impulse response of a WSSUS process can be written as [4]
(5)
First the random numbers phase , Doppler frequencies and delays
are generated.
The factor ensures that the average power is one; this factor is the same for all echoes and for all spectra.
The parameters are generated by a functional transformation
(6)
Where a substitute for is , respectively, is a random, uniformly distributed input
variable produced by a random number generator, and is a memory-less nonlinearity, which is the
inverse of the desired cumulative distribution function .
The classical Doppler spectrum (3) with application of (6) results in the nonlinearity
(7)
If the scattering is 2-D uniform non-isotropic
(8)
The nonlinearity for the one-sided exponentially decreasing delay power spectrum of (4) is
(9)
The parameters and (representing the excess delays, Doppler frequencies of discrete N paths) are easily
generated by feeding a uniformly distributed random variable into a simple nonlinearity (which may
be implemented as a table lookup).
From equation (5) we generate the Aeronautical Rayleigh channel as,
(10)
Where N is the Number of paths, is Phase, is Doppler shift, k is the Time index (t= ), is
Sampling time, and is the Doppler shift of LOS component. A Rician channel can be modeled by adding a
constant to the Rayleigh process. Let us denote the complex-valued direct (LOS) component is given by
=a (11)
Where is the amplitude of the LOS path and is the Doppler shift of the LOS path; and the
624 | P a g e
(due to the factor ). The resulting transmission model for arrival and taxi channel (Ricianchannel) is given by
= + (12)
For en-route channel (Two ray model) the
= (13)
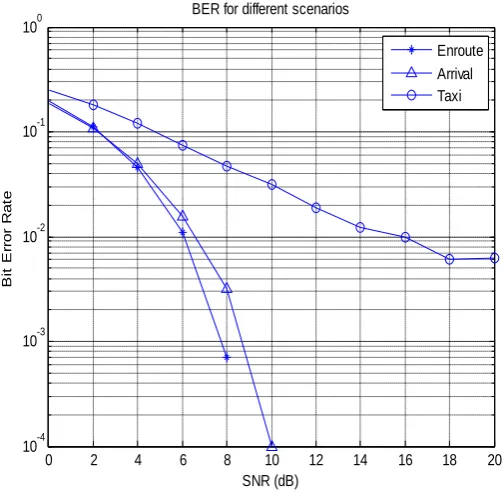
These aeronautical channel models are simulated in MATLAB by considering DPSK modulation of M=2
and BER performance for
en-route, arrival and taxi scenarios
is shown inFig.9.
Fig. 9 BER performance for different scenarios
III. DEVELOPMENT OF CHANNEL SIMULATOR ON WIDEBAND DIGITAL SCANNING
TRANSCEIVER
Real time simulation is not possible in MATLAB. Hence a channel simulator is developed on Wideband Digital
Scanning Transceiver. The development and measurement of channel simulator is done by using LabVIEW.
The LabVIEW can be used as basic software and can be turned into hardware part by connecting to other
devices for real-time channel simulation.
To presence the real time measurement for the reliable wireless communication system designs, the basic-design
software which suitable to the generic channel modeling is used. Wideband Digital Scanning Transceiver is
basically RF record and playback system which are practical solutions for testing receivers under signal fading
and multipath conditions. Once a large amount of data is captured (hours or more of signal data), the recorded
signal can be regenerated in a controlled laboratory environment and directly connected to the receiver for
evaluation [5].Wideband Digital Scanning Transceiver is shown inFig.10and consists of
PXIe-1065,18-Slot 3U PXIe/PXI Chassis [6]
NI PXIe-8840 core i5-4400E 2.7GHz, Dual core, Win7 (64 bit) [7]
0 2 4 6 8 10 12 14 16 18 20
10-4 10-3 10-2 10-1 100 SNR (dB) B it E rr o r R a te
BER for different scenarios
625 | P a g e
NI 8260, 4-Drive , 3TB HDD High Speed Storage Module, Win7 [8]
NI PXIe-5663E 6.6 GHz RF Vector Signal Analyzer w/64MB RAM [9]
NI PXIe-5672 2.7GHz RF Vector Signal Generator (32 MB)[10]
Fig. 10 Wideband Digital Scanning Transceiver
The block diagram for entire setup is shown in Fig. 11.
Fig. 11 Block diagram
The RF signal from digital radio 1 is fed to wide band digital scanning transceiver. Which consist of Vector
Signal Analyzer (VSA) and Vector Signal Generator (VSG). The function of vector signal analyzer is to record
the RF signal as IQ data, channel impairments which are nothing but the real world environments are added to
this signal. Original signal with channel impairments is play-backed using the vector signal generator. Thus
faded signal is generated by the vector signal generator and given to the digital radio 2.
Both the transmitter and receiver signals are compared by BER (bit error rate).A Virtual Instrument (VI) in
LabVIEW for VSA Configure and Record data for test panel is shown in Fig. 12 [11], [12].
626 | P a g e
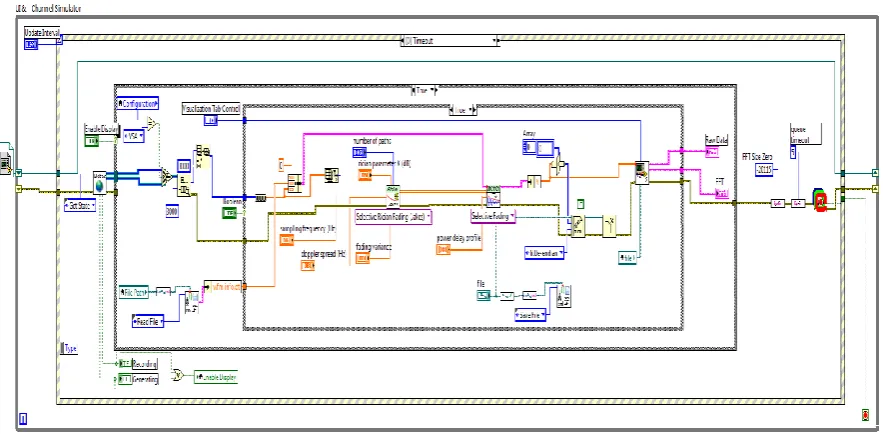
A VI for rician channel is shown in Fig. 13.Fig. 13Rician Channel
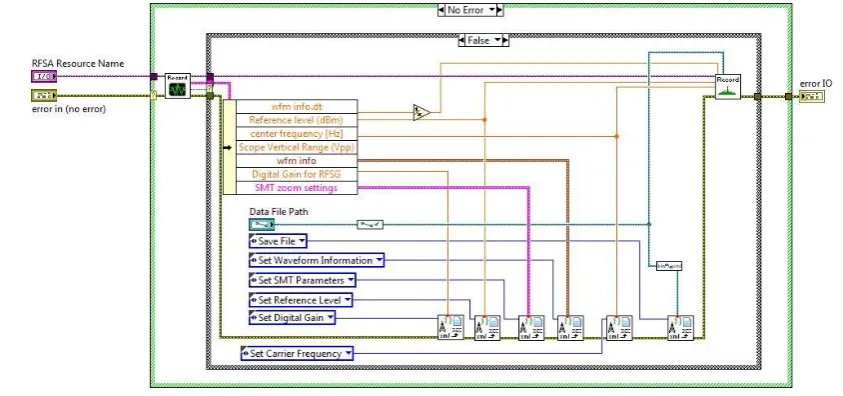
A VI for VSG Playback data for test panel is shown in Fig. 14.
Fig. 14 Playback data for test panel
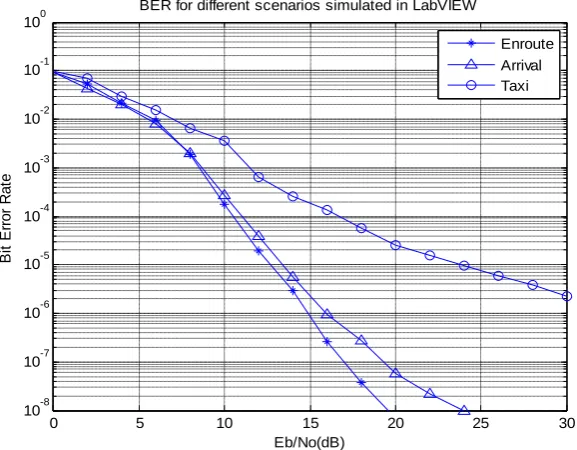
IV. RESULTS
The Offset quadrature phase-shift keying (OQPSK) signal of 200 KHz bandwidth and 64Kbps data rate from
Digital Radio 1 is given to VSA. The VSA record the OQSK signal with and passed through the channel
simulator and faded signal is generated by VSG and given to the Digital Radio2. The bit error rate (BER) values
for different are obtained and by these values BER performance for the en-route, arrival and taxi scenarios is
627 | P a g e
0 5 10 15 20 25 30
10-8 10-7 10-6 10-5 10-4 10-3 10-2 10-1 100 Eb/No(dB) B it E rr o r R a te
BER for different scenarios simulated in LabVIEW
Enroute Arrival Taxi
Fig. 15 BER performance for different scenarios by real time simulation
V. CONCLUSIO
Due to the high speed of the aircraft, the Doppler spread will be very serious. For en-route scenario the Doppler
shift is 7333.3Hz and Delay is 33 µs, for arrival scenario the Doppler shift is 2500Hz and Delay=7µs and for
taxi scenario Doppler shift is 250Hz and Delay is 0.7µs. Even though the maximum Doppler and maximum
delay are decreased, the decrease in Rice factor of taxi scenario compared to en-route and arrival will lead to
severe fading of the signal.In MATLAB real time simulations cannot be performed. Real time measurement for
the reliable wireless communication system designs cannot be done by MATLAB. Real time faders are present
but which are very expensive. Hence a Channel simulator is developed on Wideband Digital Scanning
Transceiver using LabVIEW. By this real time measurements can be done. Finally simulation results show the
necessity to distinguish between the different scenarios due to the different effects they have on the transmitted
signal. Taxi scenario has worst performance compared to en-route and arrival scenarios.
REFERENCES
[1]E. Haas, “Aeronautical channel modelling,” Vehicular Technology IEEE Transactions on, vol. 51, no. 2, pp.
254-264, 2002.
[2] R. H. Clarke, “A statistical theory of mobile-radio reception,” Bell Syst.Tech. J., vol. 47, pp. 957–1000,
July–Aug. 1968.
[3] M. J. Gans, “A power-spectral theory of propagation in the mobile-radio environment,” IEEE Trans. Veh.
Technol., vol. VT-21, pp. 27–38, Feb. 1972.
[4] P. Hoeher, “A statistical discrete-time model for the WSSUS multipath channel,” IEEE Trans. Veh.
Technol., vol. 41, pp. 461–468, Nov. 1992.
628 | P a g e
[6] http://www.testequip.com/sale/catalogs//NI/0/NI_PXIE-1065.pdf[7] http://www.ni.com/pdf/manuals/375447a
[8] http://www.ni.com/pdf/products/us/cat_ni8260.pdf
[9] http://www.ni.com/pdf/products/us/cat_PXIe_5663.pdf
[10]www.findrf.com/common/download?id=6eb29f8182e046d8bb887b5983adc6bc
[11] http://www.ni.com/white-paper/7209/en/