Using Machine Translation Evaluation Techniques to Determine
Sentence-level Semantic Equivalence
Andrew Finch
ATR Research Institute
2-2-2 Hikaridai
“Keihanna Science City”
Kyoto 619-0288
JAPAN
[email protected]Young-Sook Hwang
ATR Research Institute
2-2-2 Hikaridai
“Keihanna Science City”
Kyoto 619-0288
JAPAN
Eiichiro Sumita
ATR Research Institute
2-2-2 Hikaridai
“Keihanna Science City”
Kyoto 619-0288
JAPAN
Abstract
The task of machine translation (MT) evaluation is closely related to the task of sentence-level semantic equiv-alence classification. This paper in-vestigates the utility of applying stan-dard MT evaluation methods (BLEU, NIST, WER and PER) to building clas-sifiers to predict semantic equivalence and entailment. We also introduce a novel classification method based on PER which leverages part of speech information of the words contributing to the word matches and non-matches in the sentence. Our results show that MT evaluation techniques are able to produce useful features for para-phrase classification and to a lesser ex-tent entailment. Our technique gives a substantial improvement in paraphrase classification accuracy over all of the other models used in the experiments.
1
Introduction
Automatic machine translation evaluation is a means of scoring the output from a machine trans-lation system with respect to a small corpus of reference translations. The basic principle being that an output is a good translation if it is ‘close’ in some way to a member of a set of perfect trans-lations for the input sentence. The closeness that these techniques are trying to capture is in essence the notion of semantic equivalence. Two
sen-tences being semantically equivalent if they con-vey the same meaning.
MT evaluation techniques have found appli-cation in the field of entailment recognition, a close relative of semantic equivalence determina-tion that seeks methods for deciding whether the information provided by one sentence is included in an another. (Perez and Alfonseca, 2005) di-rectly applied the BLEU score to this task and (Kouylekov and Magnini, 2005) applied both a word and tree edit distance algorithm. In this pa-per we evaluate these techniques or variants of them and other MT evaluation techniques on both entailment and semantic equivalence determina-tion, to allow direct comparison to our results.
correct-ness to translation candidates, by scoring them with respect to a reference set. These correctness labels were used as the ‘ground truth’ for classi-fiers for the correctness of translation candidates for candidate sentence confidence estimation. We too adopt sentence level versions of these scores and use them to classify paraphrase candidates.
The motivation for these experiments is two-fold: firstly to determine how useful the features used by these MT evaluation techniques to se-mantic equivalence classifiers. One would ex-pect that systems that perform well in one domain should also perform well in the other. After all, determining sentence level semantic equivalence is “part of the job” of an MT evaluator. Our sec-ond motivation is the conjecture that successful techniques and strategies will be transferable be-tween the two tasks.
2
MT Evaluation Methods
MT evaluation schemes score a set of MT sys-tem output segments (sentences in our case)S= {s1, s2, ..., sI}with respect to a set of references R corresponding to correct translations for their respective segments. Since we classify sentence pairs, we only consider the case of using a single reference for evaluation. Thus the set of refer-ences is given by:R={r1, r2, ..., rI}.
2.1 WER
Word error rate (WER) (Su et al., 1992) is a mea-sure of the number of edit operations required to transform one sentence into another, defined as:
W ER(si, ri) =
I(si, ri) +D(si, ri) +S(si, ri) |ri|
whereI(si, ri),D(si, ri)andS(si, ri)are the number of insertions, deletions and substitutions respectively.
2.2 PER
Position-independent word error rate (PER) (Till-mann et al., 1997) is similar to WER except that word order is not taken into account, both sen-tences are treated as bags of words:
P ER(si, ri) =
The BLEU score (Papineni et al., 2001) is based on the geometric mean ofn-gram precision. The score is given by:
BLEU =BP×exp
whereN is the maximumn-gram size. Then-gram precisionpnis given by:
pn =
where count(ngram) is the count of ngram found in bothsiandri andcountsys(ngram)is the count ofngraminsi.
The brevity penalty BP penalizes MT output for being shorter than the corresponding refer-ences and is given by:
BP =exp
whereLsysis the number of words in the MT output sentences andLrefis the number of words in the corresponding references.
The BLEU brevity penalty is a single value computed over the whole corpus rather than an average of sentence level penalties which would have made its effect too severe. For this reason, in our experiments we omit the brevity penalty from the BLEU score. Its effect is small since the reference sentences and system outputs are drawn from the same sample and have approximately the same average length.
We ran experiments for N = 1...4, these are referred to as BLEU1 to BLEU4 respectively.
2.4 NIST
Sentence pair 1 (semantically equivalent):
1. Amrozi accused his brother, whom he called “the witness”, of deliberately distorting his evidence. 2. Referring to him as only “the witness”, Amrozi accused his brother of deliberately distorting his evidence.
Sentence pair 2 (not semantically equivalent):
1. Yucaipa owned Dominick’s before selling the chain to Safeway in 1998 for $2.5 billion.
2. Yucaipa bought Dominick’s in 1995 for $693 million and sold it to Safeway for $1.8 billion in 1998.
Sentence pair 3 (semantically equivalent):
1. The stock rose $2.11, or about 11 percent, to close Friday at $21.51 on the New York Stock Exchange. 2. PG&E Corp. shares jumped $1.63 or 8 percent to $21.03 on the New York Stock Exchange on Friday.
Figure 1: Example sentences from the Microsoft Research Paraphrase Corpus (MSRP)
inf ois defined to be:
inf o(ngram) =log2
count
((n−1)gram)
count(ngram)
wherecount(ngram)is the count ofngram =
w1w2. . . wn in all the reference translations, and (n−1)gramisw1w2. . . wn−1.
For NIST the brevity penalty is computed on a segment-by-segment basis and is given by:
BP =exp
"
β log2min
"
Lsys Lref
,1
##
where Lsys is the length of the MT system output, Lref is the average number of words in a reference translation and β is chosen to make BP = 0.5when Lsys
Lref =
2 3.
We ran experiments forN = 1...5, these are referred to as NIST1 to NIST5 respectively. We include the brevity penalty in the scores used for our experiments.
2.5 Introducing Part of Speech Information
Early experiments based on the PER score re-vealed that removing certain classes of function words from the edit distance calculation had a positive impact on classification performance. In-stead of simply removing these words, we cre-ated a mechanism that would allow the classifier to learn for itself the usefulness of various classes of word. For example, one would expect edits volving nouns or verbs to cost more than edits in-volving interjections or punctuation. We used a POS tagger for the UPENN tag set (Marcus et al., 1994) to label all the data. We then divided the
total edit distance, into components, one for each POS tag which hold the amount of edit distance that words bearing this POS tag contributed to the total edit distance. The feature vector therefore having one element for each UPENN POS tag. Let W−
be the bag of words fromsi that have no matches inriand letW+be the bag of words fromsithat have matches inri. The value of the feature vectorf~−
corresponding to the contribu-tion to the PER from POS tagtis given by:
f− t =
P
w∈W−count − t (w) |si|
wherecount−
t (w)is the number of times word woccurs inW−
with tagt.
The feature vector defined above characterizes the nature of the words in the sentences that do not match. However it might also be important to include information on the words in the sentence that match. To investigate this, we augment the feature vector f~− with an analogous set of fea-turesf~+ (again one for each UPENN POS tag) that represent the distribution over the tag set of word unigram precision, given by:
ft+=
P
w∈W+count+t (w) |si|
wherecount+t (w)is the number of times word woccurs inW+with tagt.
MSRP PASCAL CD IE MT QA RC PP IR
Sentence1 length 21.6 27.8 24.0 27.4 36.7 31.5 27.9 24.0 24.6
Sentence2 length 21.6 11.6 16.1 8.4 19.2 8.7 10.2 11.2 7.2
Length difference ratio 0.14 0.54 0.32 0.66 0.46 0.68 0.60 0.46 0.66
Edit distance 11.3 22.0 18.2 22.2 28.1 26.8 21.8 17.3 21.0
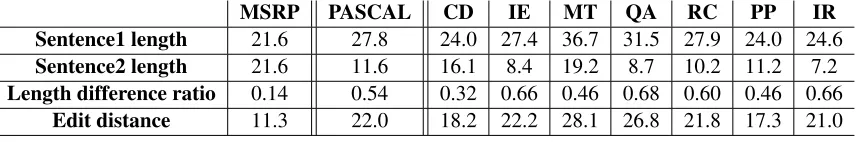
Table 1: Corpus statistics (columns CD-IR are sub-tasks of PASCAL), “length difference ratio” is explained in Section 3, “edit distance” is the average Levenstein distance between the sentences of the pairs
used in combination the method differs again by utilizing information about the nature of both the matching words and the non-matching words.
We will refer to the system based only on the feature vector f~− as POS- , that based only on
~
f+as POS+ and that based on both as POS.
2.6 Dealing with Synonyms
Often in paraphrases the semantic information carried by a word in one sentence is conveyed by a synonymous word in its paraphrase. To cover these cases we investigated the effect of allow-ing words to match with synonyms in the edit distance calculations. Another pilot experiment was run with a modified edit distance that al-lowed words in the sentences to match if their semantic distance was less than a specific thresh-old (chosen by visual inspection of the output of the system). The semantic distance measure we used was that of (Jiang and Conrath, 1997) de-fined using the relationships between words in the WordNet database (Fellbaum, 1998). A perfor-mance improvement of approximately 0.6% was achieved on the semantic equivalence task using the strategy.
3
Experimental Data
Two corpora were used for the experiments in this paper: the Microsoft Research Paraphrase Corpus (MSRP) and the PASCAL Challenge’s entailment recognition corpus (PASCAL). Corpus statistics for these corpora (after processing) are pre-sented in Table 1.
The MSRP corpus consists of 5801 sentence pairs drawn from a corpus of news articles from the internet. The sentences were annotated by hu-man annotators with labels indicating whether or not the two sentences are close enough in
mean-ing to be close paraphrases. Multiple annotators were used to annotate each sentence: two anno-tators labeled the data and a third resolved the cases where they disagreed. The average inter-annotator agreement on this task was 83%, indi-cating the difficulty in defining the task and the ambiguity of the labeling. Approximately 67% of the sentences were judged to be paraphrases. The data was divided randomly into 4076 training sen-tences and 1725 test sensen-tences. For full details of how the corpus was collected we refer the reader to the corpus documentation. To give an idea of the nature of the data and the difficulty of the task, three sentences from the corpus are shown in Fig-ure 1. The example sentences show the ambigu-ity inherent in this task. The first sentence pair is clearly a pair of paraphrases. The second pair of sentences share semantic information, but were judged to be not semantically equivalent. The third pair are not paraphrases, they are clearly de-scribing the movements of totally different stocks, but the sentences share sufficient semantic con-tent to be labeled equivalent.
For the MSRP corpus we present results using the provided training and test sets to allow com-parison with our results. To obtain more accurate figures and to get an estimate of the confidence intervals we also conducted experiments by 10-fold jackknifing over all the data. The results from each fold were then averaged and 95% confidence intervals were estimated for the means.
the/DTcat/NN sat/VBD on/IN the/DT mat/NN the/DTdog/NN sat/VBD on/IN the/DT mat/NN
DT
2/6 NN
1/6 VBD
1/6 IN
1/6
DT
0/6 NN
1/6 VBD
0/6 IN
0/6
Matches Non-matches
Sentence 1: Sentence 2:
Feature Vector = (0.33, 0.16, 0.16, 0.16, 0, 0.16, 0, 0):
Figure 2: Example of a POS feature vector. The sentences are presented in word/TAG format, and the feature vector is labeled with these POS tags (in the upper part of the squares)
the corpus documentation1. The data differs from
the MSRP corpus in that it is annotated for en-tailment rather than semantic equivalence. This explains the asymmetry in the sentence lengths, which is apparent even in the PP component of the corpus. We do not present results for 10-fold jackknifing on the PASCAL data since the data were too small in number for this type of analy-sis.
In Table 1 “Sentence 1” refers to the first sen-tence of a sensen-tence pair in the corpus, and “Sen-tence 2” the second. The length distance ratio (LDR) is defined to be the average over the corpus of:
LDR(si, ri) =
||si| − |ri|| max(|si|,|ri|)
This measures the similarity of the lengths of the sentences in the pairs, it has the property of being 0 when all sentence pairs have sentences of the same length and 1 when all sentence pairs dif-fer maximally in length. For the PASCAL corpus the LDR is around 0.5 for the corpus as a whole, corresponding to a large difference in the sentence lengths. The CD component of the corpus being considerably more consistent in terms of sentence length. The differences among the tasks in terms of edit distance are less clear-cut, with the PP task having the lowest average edit distance despite its higher LDR. The MSRP corpus has an LDR of only 0.14. The sentences pairs are more similar in terms of their length and edit distance than those in the PASCAL corpus. We will argue later that this length similarity has a significant effect on the performance and applicability of these tech-niques.
1http://www.pascal-network.org/Challenges/RTE/
4
Experimental Methodology
4.1 Tokenization
In order that the sentences could be tagged with UPENN tags (Marcus et al., 1994), they were pre-processed by a tokenizer. After tokenization the average MSRP sentence length was 21 words.
4.2 Stemming
Stemming conflates morphologically related words to the same root and has been shown to have a beneficial effect on IR tasks (Krovetz, 1993). A pilot experiment showed that the performance of a PER-based system degraded if the stemmed form of the word was used in place of the surface form. However, if the stemmer was applied only to words labeled by a POS tagger as verbs and nouns, a performance improvement of around 0.8% was observed on the semantic equivalence task. Therefore, for the purposes of the experiments, the nouns and verbs in the sentences were all pre-processed by a stemmer.
4.3 Classification
5
Results
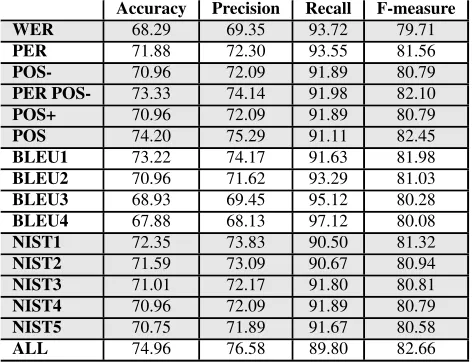
5.1 MSRP Corpus
The results for the jackknifing experiments are shown in Table 2 and the results using the pro-vided training and test sets are shown in Table 3. In the tables the rows labeled “PER POS+”, re-fer to models built using feature vectors made by combining both the PER and POS+ feature vec-tors. The rows labeled POS refer to models built from the combination of features from the POS+ and POS- models. The rows labeled ALL refer to models built from combining all of the features used in these experiments.
The results show that decomposing the PER edit distance score into components for each POS tag is not able to better the classification perfor-mance of PER. The accuracy (jackknifing) for PER alone was 71.25% and the accuracy for the analogous technique which divides this informa-tion in contribuinforma-tions for each POS tag (POS-) was 70.99%. However, when the features from PER and POS- are combined there is an improvement in performance (to 72.71%) indicating that the components for each POS tag are useful, but only in addition to the more primitive feature encod-ing the total edit distance. Moreover, comparencod-ing the results from POS-, POS+ and POS it is clear that there lot to be gained by considering the con-tributions from both the matching words and the non-matching words. Using both together gives a classification performance of 74.2% whereas us-ing either component in isolation can give a per-formance no better than 71.5%.
The one of the worst performing systems was that based on the WER score. However, it is possible that the way the sentences were selected handicapped this system, since only sentences pairs with a word-based Levenshtein distance of 8 or higher were included in the corpus. Choosing sentence pairs with larger edit distances makes large structural differences more likely, and the editing effort needed to correct such structural dif-ferences may obscure the lexical comparison that this score relies upon.
The results for the BLEU score were unex-pected because the performance degrades as the order ofn-gram considered increases. This effect is much less apparent in the NIST scores where
the performance degrades but to a lesser extent. Paraphrases exhibit variety in their grammatical structure and perhaps changes in word ordering can explain this effect. If so, the geometric mean employed in the BLEU score would make the ef-fect of higher ordern-grams considerably more detrimental than with the arithmetic mean used in the NIST score.
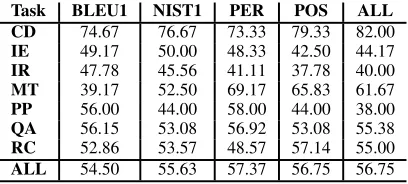
5.2 PASCAL Challenge Corpus
The results for the PASCAL corpus are given in Table 4. As expected our results are consistent with those of (Perez and Alfonseca, 2005). The 5% overall gain in accuracy may be accounted for by the stemming and synonym extensions to our technique and the fact that we used BLEU1. Our approach also differs by being symmetrical over source and reference sentences, however it is not clear whether this would improve perfor-mance. The number of test examples for the sub-experiments for each task is low (50 to 150), therefore the results here are likely to be noisy, but it is apparent from our results that the CD task is the most suitable for approaches based on word/n-gram matching. Our POS technique per-formed well on overall and particularly well on the CD and MT tasks, but the overall performance improvement relative to the other techniques is not as clear-cut. We believe this is due to difficul-ties arising from the asymmetrical nature of the data, and we explore this in the next section.
5.3 Sentence length similarity
Accuracy Precision Recall F-measure ±95% conf. ±95% conf. ±95% conf. ±95% conf. WER 68.80±0.90 69.89±1.08 94.20±0.99 80.22±0.69
PER 71.25±1.03 72.05±1.23 93.58±0.59 81.39±0.72
POS- 70.99±1.16 72.07±1.43 92.99±1.52 81.15±0.79 PER POS- 72.71±1.34 73.99±1.47 91.67±0.53 81.86±0.97 POS+ 71.56±0.99 72.51±1.20 93.02±1.50 81.46±0.74 POS 74.18±0.94 75.52±1.16 91.13±0.59 82.58±0.76 BLEU1 72.30±1.10 73.71±1.30 91.41±0.70 81.59±0.83 BLEU2 70.26±1.37 71.55±1.46 92.65±0.66 80.72±0.95 BLEU3 68.30±1.42 69.40±1.25 94.54±0.87 80.03±0.97 BLEU4 67.64±1.22 68.46±1.13 96.18±0.67 79.97±0.86
NIST1 71.78±1.44 73.95±1.55 89.65±1.06 81.02±1.04
NIST2 71.64±1.12 73.64±1.43 90.13±0.25 81.03±0.81
NIST3 71.59±1.17 72.94±1.36 91.82±0.39 81.28±0.87
NIST4 71.56±1.17 72.82±1.35 92.08±0.38 81.30±0.87
NIST5 71.52±1.14 72.75±1.33 92.18±0.45 81.30±0.85
ALL 75.35±1.13 77.35±1.10 89.54±0.90 82.99±0.89
Table 2: Experimental Results (10-fold Jackknifing)
Accuracy Precision Recall F-measure WER 68.29 69.35 93.72 79.71
PER 71.88 72.30 93.55 81.56
POS- 70.96 72.09 91.89 80.79
PER POS- 73.33 74.14 91.98 82.10
POS+ 70.96 72.09 91.89 80.79
POS 74.20 75.29 91.11 82.45
BLEU1 73.22 74.17 91.63 81.98
BLEU2 70.96 71.62 93.29 81.03
BLEU3 68.93 69.45 95.12 80.28
BLEU4 67.88 68.13 97.12 80.08
NIST1 72.35 73.83 90.50 81.32
NIST2 71.59 73.09 90.67 80.94
NIST3 71.01 72.17 91.80 80.81
NIST4 70.96 72.09 91.89 80.79
NIST5 70.75 71.89 91.67 80.58
ALL 74.96 76.58 89.80 82.66
Table 3: Experimental Results (Microsoft’s Provided Train and Test Set)
sorted the sentences pairs of the MSRP corpus according to the length difference ratio (LDR) de-fined in Section 3, and partitioned the sorted cor-pus into two: low and high LDR. We then selected as many sentences as possible from the corpus such that the training and test sets for each data set (high and low LDR) contained the same num-ber positive and negative examples. This gave two sets (high and low LDR) of 1008 training exam-ples and 438 test examexam-ples, all training and test data consisiting of 50% positive and 50% nega-tive examples. The results are shown in Table 5. The experimental results validate our concerns. In all of the cases the performance was higher on
the data with low LDR. Moreover, the effect was most for the BLEU and NIST scores for which we have an explanation of the cause.
6
Conclusion
Task BLEU1 NIST1 PER POS ALL CD 74.67 76.67 73.33 79.33 82.00
IE 49.17 50.00 48.33 42.50 44.17
IR 47.78 45.56 41.11 37.78 40.00
MT 39.17 52.50 69.17 65.83 61.67
PP 56.00 44.00 58.00 44.00 38.00
QA 56.15 53.08 56.92 53.08 55.38
RC 52.86 53.57 48.57 57.14 55.00
ALL 54.50 55.63 57.37 56.75 56.75
Table 4: Accurracy Results (PASCAL Train and PASCAL Test Set)
BLEU1 NIST1 PER POS ALL Low LDR 76.71 77.85 72.15 75.80 76.48
High LDR 68.49 70.09 69.63 72.83 73.52
Table 5: Accuracy Results Length Similarity (MSRP)
This research begs the important question “Is there any correlation between performance on the semantic equivalence classification task and per-formance of the underlying evaluation technique on the task of MT evaluation?”. Intuitively at least, there certainly should be. If there is, it may be possible to use the task of classifying sentences for semantic equivalence as a proxy for the com-plex and time-consuming task of evaluating eval-uation schemes by correlating automatic scores with human scores during the development pro-cess of MT evaluation techniques. In future work we look forward to addressing this question, as well as incorporating new features into the mod-els to increase their potency.
7
Acknowledgments
The research reported here was supported in part by a contract with the National Institute of Infor-mation and Communications Technology entitled “A study of speech dialogue translation technol-ogy based on a large corpus”.
References
J. Blatz, E. Fitzgerald, G. Foster, S. Gandrabur, C. Goutte, A. Kulesza, A. Sanchis, and N. Ueffing. 2004. Confidence estimation for machine transla-tion. Technical report, Final report JHU / CLSP 2003 Summer Workshop, Baltimore.
G. Doddington. 2002. Automatic Evaluation of Machine Translation Quality Using N-gram Co-Occurrence Statistics. InProceedings of the HLT Conference, San Diego, California.
C. Fellbaum. 1998. WordNet: An Electronic Lexical Database. MIT Press.
Jay J. Jiang and David W. Conrath. 1997. Seman-tic similarity based on corpus statisSeman-tics and lexical taxonomy.CoRR, 9709008.
Milen Kouylekov and Bernardo Magnini. 2005. Recognizing textual entailment with tree edit dis-tance algorithms. In Proceedings PASCAL Chal-lenges Worshop on Recognising Textual Entailment, Southampton, UK.
Robert Krovetz. 1993. Viewing morphology as an inference process. Technical Report UM-CS-1993-036, University of Mass-Amherst, April.
Mitchell P. Marcus, Beatrice Santorini, and Mary Ann Marcinkiewicz. 1994. Building a large annotated corpus of english: The penn treebank. Computa-tional Linguistics, 19(2):313–330.
K. Papineni, S. Roukos, T. Ward, and W.J. Zhu. 2001.
Bleu: a Method for Automatic Evaluation of
Ma-chine Translation. IBM Research Report rc22176
(w0109022), Thomas J. Watson Research Center.
Diana Perez and Enrique Alfonseca. 2005. Appli-cation of the bleu algroithm for recognising tex-tual entailments. In Proceedings PASCAL Chal-lenges Worshop on Recognising Textual Entailment, Southampton, UK.
K.Y. Su, M.W. Wu, and J.S. Chang. 1992. A new quantitative quality measure for machine transla-tion systems. InProceedings of COLING-92, pages 433–439, Nantes, France.
C. Tillmann, S. Vogel, H. Ney, A. Zubiaga, and H. Sawaf. 1997. Accelerated dp based search for statistical translation. In Proceedings of
Eurospeech-97, pages 2667–2670, Rhodes, Greece.