Investigating the features that affect cue usage of non-native speakers of
English
Xinyu Deng Kyoto University Yoshida Honmachi, Sakyoku
Kyoto, 606-8501, Japan
Jun-ichi Nakamura Kyoto University Yoshida Honmachi, Sakyoku
Kyoto, 606-8501, Japan
Abstract
At present, the population of non-native speakers is twice that of native speak-ers. It is necessary to explore the text generation strategies for non-native users. However, little has been done in this field. This study investigates the features that affect the placement (where to place a cue) of because for non-native speakers. A machine learn-ing program – C4.5 was applied to in-duce the classification models of the placement.
1 Introduction
As an international language, English has become more and more important for non-native speak-ers. However, almost all English documents are written for the native speakers. To some degree, some documents can not be understood quite well by non-native speakers. This paper concentrates on exploring the differences in cue usage at dis-course level between native and non-native speak-ers. The aim is to find the decision-making mech-anisms of text generation for users at different reading levels.
While investigating texts written for non-native speakers, we found that cue phrase because some-times occurs in the first span of a discourse rela-tion. This is different from the conclusion men-tioned in (Quirk and Greenbaum and Leech and Svartvik, 1972), that is, (for native speakers) be-cause typically occurs in the second span. This problem could be considered from the viewpoint
of text generation as well. The following three texts may have the same abstract text structure, though the differences among them are apparent. E.g., cue placement is different. In text (1), cue phrase because occurs at first span of discourse relation “explanation”, while in (2) and (3), be-cause occurs in the second span.
Example 1.1:
1. Global warming will be a major threat to the whole world over the next century. But be-cause it will take many years for our actions to produce a significant effect, the problem needs attention now.
2. Global warming will be a major threat to the whole world over the next century, but the problem needs attention now, because it will take many years for our actions to produce a significant effect.
3. Global warming will be a major threat to the whole world over the next century. But the problem needs attention now, because it will take many years for our actions to produce a significant effect.
Section 4 shows the method of annotating cor-pora. Section 5 demonstrates the difference in us-age of because between two corpora. In section 6, a machine learning program – C4.5 is introduced. Section 7 shows the experimental results. Section 8 draws a conclusion.
2 Related work
Almost all researches on cue phrases have been done for native speakers. (Elhadad and McKe-own, 1990) explored the problem of cue selec-tion. They presented a model that distinguishes a small set of similar cue phrases. (Moser and Moore, 1995a) put forward a method to identify the features that predict cue selection and place-ment. (Eugenio and Moore and Paolucci, 1997) used C4.5 to predict cue occurrence and place-ment. Until now, the research similar to ours is the GIRL system (Williams, 2004) which gener-ates texts for poor readers and good readers of native speakers. The author measured the differ-ences of reading speed (especially cue phrases) between good readers and bad readers, by which they inferred how discourse level choice (e.g., cue selection) makes the difference for the two kinds of readers.
3 Creating two corpora
We used two corpora (SUB-BNC and CNNSE) to investigate difference in cue usage between native and non-native speakers. The two corpora have the same size (200,000 words each). According to the Flesch Reading Ease scale, the readability of SUB-BNC and CNNSE is 47.5 (difficult) and 68.7 (easy) respectively.
The two corpora are comparable. SUB-BNC is a sub-corpus of BNC (British National Corpus). While creating SUB-BNC, we selected the writ-ten texts according to the three features: domain (“natural and pure science”), medium (“book”), target audience (“adult”). CNNSE (Corpus of Non-Native Speaker of English) was created by the first author. Non-native speakers have three levels: primary (middle school student level), in-termediate (high school student level) and ad-vanced (university student level). The users of this study are assumed to be at intermediate level. We extracted English texts (written or rewritten
by native speakers) from the books published in China and in Japan. The target audiences of these books were high school students in the two coun-tries. The domain of the selected texts is natural and pure science as well.
4 Annotating two corpora
We followed (Carlson and Marcu and Okurowski, 2001) to classify the discourse relations. In the manual, some relations share some type of rhetor-ical meaning, so we defined several relations as follows:
1. background: background, circumstance
2. cause: cause, result, consequence
3. comparison: comparison, preference, anal-ogy, proportion
4. condition: condition, hypothetical, contin-gency, otherwise
5. contrast: contrast, concession, antithesis
6. elaboration: elaboration-additional, elaboration-general-specific, elaboration-part-whole, elaboration-process-step, elaboration-object-attribute, elaboration-set-member
7. enablement: purpose, enablement
8. evaluation: evaluation, interpretation, con-clusion, comment
9. explanation: evidence, explanation-argumentative, reason
10. summary: summary, restatement
At the second stage, two coders annotated the boundary of nucleus and satellite of each dis-course selected. Moreover, a selected disdis-course could be a span (nucleus or satellite) of another one (we call it embedding structure). The coders labeled the discourse relation of the embedding structure and determined the boundary of its nu-cleus and satellite. Example 4.1 shows an exam-ple.
Example 4.1
[Global warming will be a major threat to the whole world over the next century.]–S– contrast –N–[But [because it will take many years for our actions to produce a significant effect,]– S–explanation –N–[the problem needs attention now.]] (From CNNSE)
In order to assess reliability of annotation, we fol-lowed (Moser and Moore, 1995b)’s approach to compare the disagreements of results annotated by two independent coders from three aspects. First, the boundary of nucleus and satellite of the relation signaled by because. The disagree-ments occurred 7 times (96.9% agreement). Sec-ond, the discourse relation of embedding struc-ture. The disagreements occurred 16 times (93% agreement). Third, the boundary of nucleus and satellite of the embedding structure. The dis-agreements occurred 9 times (96.1% agreement). That is, the agreement of the two coders is 86%. This is better than that mentioned in (Moser and Moore, 1995b).
5 Analyzing the usage of because within two corpora
Through investigating annotated SUB-BNC, we found that there are 104 “explanation” relations signaled by because, in which 96/104 (92.3%) (Table 1) occurs in the second span. This con-clusion is the same as (Quirk and Greenbaum and Leech and Svartvik, 1972) and (Moser and Moore, 1995b)’ opinion, i.e., because typically occurs in the second span. However, within CNNSE, we found that only 88/124 (71%) occurs in the second span. This result is quite different from that of SUB-BNC. Moreover, Chi Square critical values (χ2 = 16.54, p <0.001) also
sup-port this conclusion.
Corpus First span Second span
SUB-BNC 8 96
CNNSE 36 88
Table 1: Placement of because within two corpora (χ2= 16.54, p<0.001)
6 Machine learning program – C4.5
6.1 Evaluation method
The results of C4.5 are learned classification mod-els from the training sets. The error rates of the learned models are estimated by cross-validation (Weiss and Kulikowski, 1991), which is widely applied to evaluating decision trees, especially whose dataset is relatively small. Data for learn-ing is randomly divided into N test sets. The pro-gram is run for N times, each run uses (N-1) test sets as the training set and the remaining one as the test set. The error rate of a tree obtained by us-ing the whole dataset for trainus-ing is then assumed to be the average error rate on the test set over the N runs (Eugenio and Moore and Paolucci, 1997). The advantage of this method is that all data are eventually used for testing, and almost all exam-ples are used in any given training run (Litman, 1996). This study follows (Eugenio and Moore and Paolucci, 1997) (Litman, 1996)’ s approach to identify the best learned models by comparing their error rates to the error rates of the other mod-els. The method of determining whether two error rates are significantly different is by computing and comparing the 95% confidence intervals for the two error rates. If the upper bound of the 95% confidence interval for error rateε1 is lower than the lower bound of the 95% confidence interval for ε2, then the difference between ε1 andε2 is considered to be significant.
6.2 Features
Mean-while, nucleus structure (Ns) and satellite struc-ture (Ss) were considered.
Another group of features reflect information of the embedding structures that contain relations signaled by because. R represents discourse re-lation of the embedding structure. C represents whether the embedding structure is cued or not. N-Sindicates that in the embedding structure, the relation signaled by because could be either nu-cleus or satellite.Pindicates that the relation sig-naled by because could occur either in the first span or in the second span. Bs represents the structure of the span containing the relation sig-naled by because. Osrepresents the structure of the span not containing the relation signaled by because. Features used in the experiments are as follows:
• Sentence features
– Nt. Tense of nucleus: past, present, fu-ture.
– St. Tense of satellite: past, present, fu-ture.
– Nv. Voice of nucleus: active, passive. – Sv. Voice of satellite: active, passive. – Ng. Length of nucleus (in words):
inte-ger.
– Sg. Length of satellite (in words): inte-ger.
– Ns. Structure of nucleus: simple, other. – Ss. Structure of satellite: simple, other.
• Embedding structure features
– R. Discourse relation of embedding structure: attribution, background, cause, comparison, condition, con-trast, elaboration, example, enable-ment, evaluation, explanation, list, summary, temporal.
– C. Signaled by cue or not: yes, no. – N-S. Role of the relation signaled by
because: nucleus, satellite.
– P. Position of relation signaled by be-cause: first span, second span.
– Bs. Structure of the span containing the relation signaled by because: complex sentence, other.
– Os. Structure of the span not contain-ing the relation signaled by because: simple sentence, other.
7 Experiments
We divided the experiments into four sets. Exper-iment Set 1 were run for examining the best indi-vidual feature whose predictive power was better than the baseline. Experiment Set 2, 3 and 4 were run for classifying the placement of because. In Experiment Set 2, we only used sentence features. In Experiment Set 3, we used both sentence fea-tures and embedding structure feafea-tures. Experi-ment Set 4 were run using only embedding struc-ture feastruc-tures.
7.1 Experiment Set 1
First we introduce a concept – baseline, which can be obtained by choosing the majority class. E.g., 71.0% (88/124) because occurs in the sec-ond span. That is, if because is placed directly in the second span, one would be wrong 29% of the times. So 29% is the error rate of the baseline model that is used in the experiment.
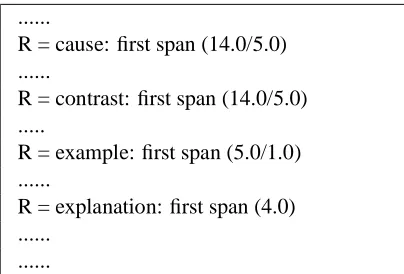
We ran the experiment 14 times using each feature mentioned above. By analyzing the re-sults, we found that only featureRhas predictive power. Because the 95% confidence interval of its error rate was 16.2±0.7, whose upper bound for error rate (16.9%) was much lower than the base-line (29%). Table 2 shows the results by using featureR. When discourse relation of the embed-ding structure is “cause”, “contrast”, “example”, or “explanation”, because occurs in the first span.
...
R = cause: first span (14.0/5.0) ...
R = contrast: first span (14.0/5.0) ...
R = example: first span (5.0/1.0) ...
R = explanation: first span (4.0) ...
...
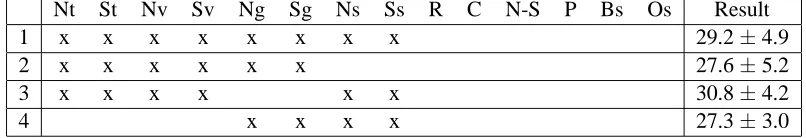
Nt St Nv Sv Ng Sg Ns Ss R C N-S P Bs Os Result
1 x x x x x x x x 29.2±4.9
2 x x x x x x 27.6±5.2
3 x x x x x x 30.8±4.2
4 x x x x 27.3±3.0
Table 3: Feature sets and 95%-confidence intervals for the error rates (%) of classification models in Experiment Set 2
Nt St Nv Sv Ng Sg Ns Ss R C N-S P Bs Os Result
1 x x x x x x x x x x x x x x 23.5±2.5
2 x x x x x 31.7±2.6
3 x x x x x x x x x 33.3±3.3
4 x x x x x x x x x x 26.9±3.0
Table 4: Feature sets and 95%-confidence intervals for the error rates (%) of classification models in Experiment Set 3
7.2 Experiment Set 2
Experiment Set 2 had four subsets. Each exper-iment was run only using sentence features (Ta-ble 3). In the first experiment, all eight sen-tence features were used. However, the upper bound of the 95% confidence interval for error rate (34.1%) was higher than the baseline (29%). So the learned model was not a good one. Then we ran three other experiments using a combina-tion of different sentence features. In subset 2, the features representing span structure (NsandSs) were deleted. In subset 3, compared with the first one, span length (Ng and Sg) were deleted. In subset 4, only the features relating to span length (NgandSg) and span structure (NsandSs) were used. However, no good classification model was obtained.
7.3 Experiment Set 3
Experiment Set 3 had four subsets as well. In the first subset, experiment was run using all sentence features and embedding structure features. Ex-perimental results show that the upper bound of the 95% confidence interval for error rate (26%) was lower than the baseline (29%). It means that embedding structure feature(s) could improve the accuracy of the learned classification models. In the next three experiments, we tried three other feature combinations. One feature set concerned with the placement of because (P) and span struc-ture (Ns and Ss, Bs and Os). Experimental
results show that the average error rate is higher than the baseline. In subset 3, two sentence fea-tures (Ngand Sg) and two embedding structure features (Cand N-S) were added. However, the average error rate of the learned model was still higher than the baseline. It means that these four features can not help to improve the accuracy of classification models. In subset 4, featureRwas added. Though the average error rate was lower than subset 2 and 3, its upper bound of the 95% confidence interval for error rate was higher than the baseline. The fourth learned model can not be regarded as a good one.
7.4 Experiment Set 4
Nt St Nv Sv Ng Sg Ns Ss R C N-S P Bs Os Result
1 x x x x x x 22.8±3.2
2 x x x x x 30.1±4.8
3 x x x x x 22.6±2.8
4 x x x x x 21.2±3.7
5 x x x x 21.9±3.6
Table 5: Feature sets and 95%-confidence intervals for the error rates (%) of classification models in Experiment Set 4
andPdo not affect the accuracy of learned mod-els. In the subset 5, features Bs and Os were deleted from the subset 1. The experimental re-sult did not change so much as well. So we can infer that span structure do not affect the accuracy of the learned model.
7.5 Discussion
The experimental results show that machine learning program C4.5 is useful to induce a clas-sification model of placement of because for non-native speakers. The results of Experiment Set 1 demonstrate that feature R is the best individ-ual feature whose predictive power is better than the baseline. Experiment Set 2 and 3 show that good learned model can not be obtained using sentence features, or the combination of sentence features and embedding structure features. The results of Experiment Set 4 demonstrate that high performing classification models can be obtained by combining featureRwith several other embed-ding structure features. However, the best learned model can’t be obtained.
8 Conclusion
This study proves that the placement of because is connected with reading ease. We used a ma-chine learning program to induce the best classi-fication model of placement of because for non-native speakers. The experiment results show that discourse relation of embedding structure is the most powerful feature to predict the placement of because. E.g., when relation is “cause”, “con-trast”, “example” or “explanation”, because oc-curs in the first span. The heuristics obtained from machine learning experiments can be applied to NLG systems.
References
Barbara Eugenio and Johanna Moore and Massimo Paolucci. 1997. Learning Features that Predict
Cue Usage. Proceedings of the 35th Conference of
the Association for Computational Linguistics.
Diane Litman. 1996. Cue Phrase Classification
Us-ing Machine LearnUs-ing. Journal of Artificial
Intelli-gence Research, Vol.5, 53-94.
Julia Hirschberg and Diane Litman. 1993.
Empiri-cal studies on the disambiguation of cue phrases.
Computational Linguistics, 19(3) 501–530.
Lynn Carlson and Daniel Marcu and Mary Okurowski. 2001. Discourse tagging reference manual. USC Information Science Institute (ISI) technical report.
Megan Moser and Johanna Moore. 1995a. Using
dis-course analysis and automatic text generation to study discourse cue usage. AAAI Spring
Sympo-sium Series: Empirical Methods in Discourse Inter-pretation and Generation, 92-98.
Megan Moser and Johanna Moore. 1995b.
Investi-gating cue selection and placement in tutorial dis-course. Proceedings of the 33rd Annual Meeting of
the Association for Computational Linguistics.
Michael Elhadad and Kathleen McKeown. 1990.
Generating connectives. Proceedings of the 12th
International Conference on Computational Lin-guistics.
Randolph Quirk and Sidney Greenbaum and Geoffrey Leech and Jan Svartvik. 1972. A Grammar of
con-temporary English. Longman, London.
Sandra Williams. 2004. Natural language generation
(NLG) of discourse relations for different reading levels. Ph.D. Thesis, University of Aberdeen.
Sholom Weiss and Casimir Kulikowski. 1991.
Com-puter Systems That Learn: Classification and Pre-diction Methods from Statistics, Neural Nets, Ma-chine Learning, and Expert Systems. San Mateo,