What Causes the Differences in Communication Styles?
A Multicultural Study on Directness and Elaborateness
Juliana Miehle
1, Wolfgang Minker
1, Stefan Ultes
21Institute of Communications Engineering, Ulm University, Albert-Einstein-Allee 43, 89081 Ulm, Germany 2Department of Engineering, University of Cambridge, Trumpington Street, Cambridge CB2 1PZ, UK
[email protected], [email protected], [email protected]
Abstract
With the aim of designing a Spoken Dialogue System which adapts to the user’s communication idiosyncrasies, we present a multi-cultural study to investigate the causes of differences in the communication styleselaboratenessanddirectnessin Human-Computer Interaction. By adapting the system’s behaviour to the user, the conversation agent may appear more familiar and trustworthy. 339 persons from Germany, Russia, Poland, Spain and the United Kingdom participated in this web-based study. The participants had to imagine that they are talking to a digital agent. For every dialogue turn, they had to read four different variants of the system output and indicate their preference. With the results of this study, we could demonstrate the influence of the user’s culture and gender, the frequency of use of speech based assistants as well as the system’s role on the user’s preference concerning the system’s communication style in terms of itselaboratenessand itsdirectness.
Keywords:Spoken Dialogue System, User Adaptation, Communication Idiosyncrasies
1.
Introduction
For humans, speech is the most intuitive and most natu-ral way to communicate. Therefore, scientists and engi-neers aim to realise methods and systems that enable not only interpersonal communication but also interaction with machines through natural spoken language. Today, we are able to communicate with various computer applications via speech. However, the usability and acceptance of Spo-ken Dialogue Systems is rather low and in public opinion, such systems often fall into disrepute (Hempel, 2008). For Human-Human Interaction, it has been shown that peo-ple adapt their interaction styles to one another across many levels of utterance production when they communicate, e.g. by matching each other’s behaviour or synchronising the timing of behaviour (Burgoon et al., 2007; Niederhoffer and Pennebaker, 2002; Brennan, 1996; Pickering and Gar-rod, 2004; Nenkova et al., 2008). Moreover, various stud-ies suggest to adapt Spoken Dialogue Systems to the user in a similar way (Cassell and Bickmore, 2003; Forbes-Riley et al., 2008; Stenchikova and Stent, 2007; Reitter et al., 2006; Mairesse and Walker, 2010). By adapting the system’s behaviour to the user, the conversation agent may appear more familiar and trustworthy and the dialogue may be more effective. Therefore, current research focuses on user-adaptive Spoken Dialogue Systems, e.g. (Honold et al., 2014; Ultes et al., 2015; Casanueva et al., 2015). Pragst et al. (2015) specifically focus on the adaptiveness of Dialogue Management to the cultural background and the emotional state of the user.
Our aim is to design a Spoken Dialogue System which adapts to the user’s communication idiosyncrasies. Accord-ing to various cultural models for Human-Human Interac-tion (Hofstede, 2009; Elliott et al., 2016; Kaplan, 1966; Lewis, 2010), different cultures prefer different communi-cation styles. Moreover, Burleson (2003) presents a study of culture and gender differences in close relationships, emotion and interpersonal communication. Empirical re-search assessing gender, ethnic and cultural differences is
reviewed. It is shown that social constructionist theories, like the different cultures view of gender, anticipate dif-ferences among social groups. These difdif-ferences influence forms and functions of social relationships, the character of emotional experiences and the uses to which communica-tion is put.
However, it is unclear which cultural idiosyncrasies found in Human-Human Interaction may be transferred to Human-Computer Interaction as it has been shown that there exist clear differences in Human-Human Interaction and Human-Computer Interaction (Doran et al., 2003). Miehle et al. (2016) showed that communication idiosyn-crasies found in Human-Human Interaction may also be observed during Human-Computer Interaction in a Spoken Dialogue System context. Moreover, cultural differences between Germany and Japan have been identified. How-ever, not all results are consistent with the existing cultural models for Human-Human Interaction and the authors infer that the communication patterns are not only influenced by the culture, but also by the dialogue domain and other user states and traits.
styleselaboratenessanddirectnessas Pragst et al. (2017) shows that these dimensions influence the user’s percep-tion of a dialogue and are therefore valuable possibilities for adaptive Dialogue Management. With the findings of our study, we demonstrate which dimensions cause the dif-ferences in the communication styleselaboratenessand di-rectnessin Human-Computer Interaction.
The structure of the paper is as follows: In Section 2., the experimental setting for the multicultural user study will be described. Afterwards, the evaluation results will be pre-sented in Section 3., before concluding in Section 4.
2.
Experimental Setting
We have designed a multicultural user study to investigate what causes the differences in the communication styles elaboratenessanddirectnessin Human-Computer Interac-tion. To do this, We created three dialogues where the dig-ital agent assumed three different roles. For every dialogue step, we formulated four options of how the agent talks to the user:
• direct, elaborate (D, E) • direct, concise (D, C) • indirect, elaborate (I, E) • indirect, concise (I, C)
As described by Pragst et al. (2017), elaboratenessrefers to the amount of additional information provided to the user anddirectnessdescribes how concretely the informa-tion that is to be conveyed is addressed by the speaker. If the user, for example, asks the digital agent called Kristina whether she can tell him about today’s weather, the four variations of the system output look as follows:
• It will be cloudy mostly and it might rain during the afternoon. (D, E)
• It will rain. (D, C)
• I would propose to take an umbrella. A scarf and gloves would be good as well. (I, E)
• You should take an umbrella. (I, C)
This example shows that in the concise version of a sys-tem utterance only the requested information is given to the user, while the elaborate version of the same utterance results in giving a more detailed weather forecast. More-over, the direct option gives an accurate description of the weather, whereas the indirect approach to answering that question is the advise to take an umbrella. In this case, the weather is not stated directly but can be inferred from the given information.
The study has been conducted on-line. The participants had to imagine that they are talking to a digital assistant. They were shown the three dialogues, including the user input and different options for the system output. An exemplary dialogue turn (as it has been presented to the study partici-pant) can be seen in the following:
YOU: Kristina, can you tell me about the weather to-day?
KRISTINA: I would propose to take an umbrella. A scarf and gloves would be good as well.
KRISTINA: It will be cloudy mostly and it might rain during the afternoon.
KRISTINA: You should take an umbrella. KRISTINA: It will rain.
For each dialogue turn, the participants had to read the four different variants of the system output carefully and decide afterwards which one they prefer. All descriptions and all dialogues have been provided in the participants’ mother tongues (German, English, Polish, Russian and Spanish). The translations have been made by native speakers who were instructed to be aware of the linguistic features and details of the differences to assure equivalence in the trans-lations. Moreover, the quality of the translations has been assured by the use of backward translations.
In the following, we describe the three dialogues as well as the group of participants.
2.1.
Description of the dialogues
The application of our digital agent Kristina is to help peo-ple in European countries get health-related information. For the user study, we have created three dialogues where Kristina assumed three different roles.
In the first dialogue, the agent took the role of a social com-panion. The dialogue is chat-oriented and Kristina and the user make small talk about the weather and the user’s mood. The study participants had to imagine that they are talking to Kristina about the weather as they want to go swimming later on.
For the second dialogue, the participants had to put them-selves in the shoes of a parent who asks Kristina for help to bathe their baby. Kristina assumed the role of an ex-pert providing the user with facts and descriptions regard-ing baby care. In contrast to the first dialogue, this one is task-oriented with the purpose of information retrieval. During the third dialogue, Kristina acted as a personal as-sistant. The users had to imagine that they are looking after Eugene who is in need of care and ask Kristina about his sleeping habits. Kristina retrieved useful information about the sleeping routine of the care recipient Eugene from per-sonal profile data and provided it to the user.
2.2.
The study participants
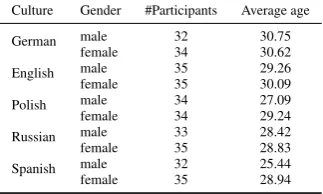
Altogether, 339 persons from Germany, Russia, Poland, Spain and the United Kingdom participated in the user study. They have been recruited and paid using the Click-worker Survey Service1where the target group can be de-fined according to demographic data. The participants were aged between 18 and 55 years, 166 of them have been male (48.97%), 173 have been female (51.03%). The partici-pants’ detailed gender and age distribution is shown in Ta-ble 1. It can be seen that the number of participants is evenly distributed among the five different cultures. More-over, the average age of the ten different groups ranges be-tween 25.44 and 30.75 years.
Culture Gender #Participants Average age
German male 32 30.75 female 34 30.62 English male 35 29.26 female 35 30.09 Polish male 34 27.09 female 34 29.24 Russian male 33 28.42 female 35 28.83 Spanish male 32 25.44 female 35 28.94
Table 1: The participants’ gender and age distribution.
The participants were asked how often they use a speech based assistant like Apple Siri, Google Assistant or Mi-crosoft Cortana. The results are shown in Table 2. It can be seen that 35.69% stated that they use speech based assis-tants a couple of times a month, 27.73% indicated that they never use such systems, 24.78% use them several times a week and only 11.80% use them every day.
Usage #Participants %
every day 40 11.80 several times a week 84 24.78 a couple of times a month 121 35.69
never 94 27.73
Table 2: The participants’ frequency of use of speech based assistants.
3.
Evaluation results
In this section, the results of our user study are described. For the evaluation of the results, we do not take into ac-count the first and the last dialogue turn of every dialogue as these system outputs have been used for greeting and leave-taking in order to have complete dialogues for the survey. This results in three dialogues, the first one contains four system utterances, the second one three utterances and the third one five utterances.
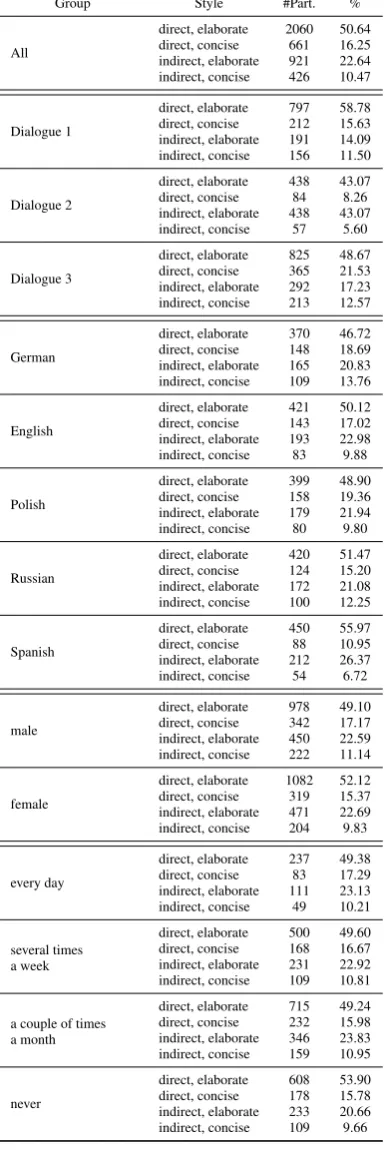
The overall evaluation results can be seen in Table 3. The first part (“All”) as well as Figure 1 show the average across all twelve utterances and all ten user groups shown in Table 1. It can be seen that 50.64% selected the direct and elabo-rate (D, E) version of the system utterances, while 16.25% selected the direct and concise (D, C) version, 22.64% se-lected the indirect and elaborate (I, E) version and only 10.47% selected the indirect and concise (I, C) version. Iso-lating the two dimensionsdirectnessandelaborateness, we get the result that 66.89% selected the direct (D) version of the system utterances, while only 33.11% chose the indi-rect (I) version. Moreover, 73.28% selected the elaborate (E) and 26.72% the concise (C) version of the system ut-terances. This indicates that the participants tend to prefer the direct and elaborate variations. Furthermore, the elabo-ratenessof the system has a greater influence on the user’s preference than thedirectness.
Following the same approach, we investigated the influence of the system’s role (second part in Table 3 containing the rows “Dialogue 1”, “Dialogue 2” and “Dialogue 3”) as well as the user’s culture (third part in Table 3 containing the
0% 10% 20% 30% 40% 50% 60% 70% 80% 90% 100%
D, E I, C
D, C I, E
D
C
E I
Figure 1: The overall evaluation results, averaging across all twelve utterances and all ten user groups.
rows “German”, “English”, “Polish”, “Russian” and “Span-ish”), gender (fourth part in Table 3 containing the rows “male” and “female”) and frequency of use of speech based assistants (last part in Table 3 containing the rows “every day”, “several times a week”, “a couple of times a month” and “never”). In the following, the detailed discussion of the results will be presented.
3.1.
Influence of the system’s role
First of all, the influence of the system’s role is exam-ined. As described in Section 2.1., the digital agent called Kristina assumed three different roles during the dialogues. The results concerning theelaboratenessare shown in Fig-ure 2, those concerning thedirectnessare depicted in Fig-ure 3. In Dialogue 1, where the agent’s role was the social companion, 72.86% chose the elaborate and 74.41% chose the direct versions of the system utterance. This leads to significantly more direct choices than the average over all three dialogues (66.89%). In Dialogue 2, where the agent acted as an expert, 86.14% chose the elaborate and 51.33% chose the direct versions of the system utterance. This means that the elaborate options have been chosen signifi-cantly more often than the average over all three dialogues (73.28%). Moreover, the direct options have been chosen significantly less often than the average over all three dia-logues (66.89%). In Dialogue 3, where the agent assumed the role of an assistant, 65.90% chose the elaborate and 70.21% chose the direct versions of the system utterance. This means that the elaborate options have been preferred significantly less often than the average over all three dia-logues (73.28%). Moreover, the direct options have been chosen significantly more often than the average over all three dialogues (66.89%).
Group Style #Part. %
All
direct, elaborate 2060 50.64 direct, concise 661 16.25 indirect, elaborate 921 22.64 indirect, concise 426 10.47
Dialogue 1
direct, elaborate 797 58.78 direct, concise 212 15.63 indirect, elaborate 191 14.09 indirect, concise 156 11.50
Dialogue 2
direct, elaborate 438 43.07 direct, concise 84 8.26 indirect, elaborate 438 43.07 indirect, concise 57 5.60
Dialogue 3
direct, elaborate 825 48.67 direct, concise 365 21.53 indirect, elaborate 292 17.23 indirect, concise 213 12.57
German
direct, elaborate 370 46.72 direct, concise 148 18.69 indirect, elaborate 165 20.83 indirect, concise 109 13.76
English
direct, elaborate 421 50.12 direct, concise 143 17.02 indirect, elaborate 193 22.98 indirect, concise 83 9.88
Polish
direct, elaborate 399 48.90 direct, concise 158 19.36 indirect, elaborate 179 21.94 indirect, concise 80 9.80
Russian
direct, elaborate 420 51.47 direct, concise 124 15.20 indirect, elaborate 172 21.08 indirect, concise 100 12.25
Spanish
direct, elaborate 450 55.97 direct, concise 88 10.95 indirect, elaborate 212 26.37 indirect, concise 54 6.72
male
direct, elaborate 978 49.10 direct, concise 342 17.17 indirect, elaborate 450 22.59 indirect, concise 222 11.14
female
direct, elaborate 1082 52.12 direct, concise 319 15.37 indirect, elaborate 471 22.69 indirect, concise 204 9.83
every day
direct, elaborate 237 49.38 direct, concise 83 17.29 indirect, elaborate 111 23.13 indirect, concise 49 10.21
several times a week
direct, elaborate 500 49.60 direct, concise 168 16.67 indirect, elaborate 231 22.92 indirect, concise 109 10.81
a couple of times a month
direct, elaborate 715 49.24 direct, concise 232 15.98 indirect, elaborate 346 23.83 indirect, concise 159 10.95
never
direct, elaborate 608 53.90 direct, concise 178 15.78 indirect, elaborate 233 20.66 indirect, concise 109 9.66
Table 3: The overall evaluation results.
0%
Figure 2: In Dialogue 2, the elaborate options (dark) have been chosen significantly (p <0.001) more often than the average over all three dialogues (black line). In Dialogue 3, the concise options (light) have been chosen significantly (p <0.001) more often than the average over all three di-alogues. In Dialogue 1, there is no significant difference to the average over all three dialogues.
0%
0% 10% 20% 30% 40% 50% 60% 70% 80% 90% 100%
German English Polish Russian Spanish
Figure 4: Among all cultures, the elaborate versions (dark) of the system utterances have been chosen significantly (p < 0.001) more often than the concise versions (light). Moreover, there are significant differences to the average (black line) for German (p < 0.05) and Spanish (p < 0.001). There are no significant differences to the average for English, Polish and Russian.
3.2.
Influence of the user’s culture
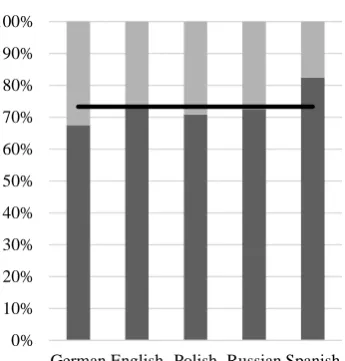
In this section, the influence of the user’s culture is dis-cussed. As described in Section 2.2., a total of 339 persons from five different cultures participated in the study. The results concerning theelaboratenessare shown in Fig-ure 4. It can be seen that the participants of all cultFig-ures se-lected the elaborate versions (dark) of the system utterances significantly more often than the concise versions (light). This shows that all five cultures prefer an elaborate commu-nication style. However, there are small differences among the investigated cultures. While the German participants selected the elaborate options significantly less often than the average (73.28%), the Spanish participants selected the elaborate options significantly more often than the average. The results concerning thedirectness, which are depicted in Figure 5, show that the participants of all cultures selected the direct versions (dark) of the system utterances signif-icantly more often than the indirect versions (light). This indicates that all five cultures prefer a direct communica-tion style. Moreover, there are no significant differences to the average (66.89%).
This leads us to the conclusion that there is no difference between the investigated European cultures concerning the directnessof the system’s output. In contrast, there are in-deed significant differences on the user’s preference of the system’selaborateness.
3.3.
Influence of the user’s gender
In the following, the influence of the user’s gender is inves-tigated. As described in Section 2.2., altogether 166 male and 173 female persons participated in our study.
The results are depicted in Figures 6 and 7. It can be seen that both the male and the female participants selected the elaborate and direct versions (dark) of the system utterances
0% 10% 20% 30% 40% 50% 60% 70% 80% 90% 100%
German English Polish Russian Spanish
Figure 5: Among all cultures, the direct versions (dark) of the system utterances have been chosen significantly (p < 0.001) more often than the indirect versions (light). There are no significant differences to the average (black line).
significantly more often than the concise and indirect ver-sions (light) and that there are no significant differences to the averages. Moreover, no significant difference be-tween the two groups could be found concerning the sys-tem’sdirectnesswhereas the women selected the elaborate options significantly more often than the men. This leads us to the conclusion that the gender does not influence the user’s preference concerning thedirectnessof a system ut-terance. In contrast, the gender seems to influence the pref-erence concerning theelaborateness. Even if both genders prefer the elaborate options over the concise options, the female participants selected the elaborate options signifi-cantly more often than the male participants did.
3.4.
Influence of the user’s culture and gender
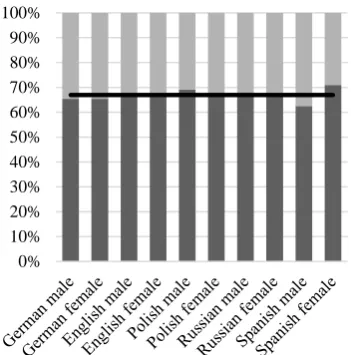
In Sections 3.2. and 3.3., the participants’ culture and gen-der have been consigen-dered separately. In the following, we will examine whether there are gender differences within the cultures.
The results concerning theelaboratenessare shown in Fig-ure 8. The German female participants selected the elabo-rate options significantly more often than the German male participants did and the Polish female participants selected the elaborate options significantly more often than the Pol-ish male participants did. These results support the conclu-sion drawn from the results depicted in Figure 6 that the gender may influence the user’s preference concerning the elaboratenessof the system utterances. In contrast, there are no significant differences between men and women for English, Russian and Spanish, what leads us to the conclu-sion that it depends on the culture whether there are gender differences concerning theelaborateness.
sig-nificant differences between men and women for German, English, Polish and Russian. This shows that in some cul-tures the gender may indeed influence the user’s preference concerning thedirectnessof the system utterances and that the conclusion drawn from the results depicted in Figure 7 are not valid for all cultures.
0% 10% 20% 30% 40% 50% 60% 70% 80% 90% 100%
male female
Figure 6: Both the male and the female participants se-lected the elaborate versions (dark) of the system utterances significantly (p <0.001) more often than the concise ver-sions (light). Moreover, there is a significant (p < 0.05) difference between the two groups. There are no signifi-cant differences to the average (black line).
0% 10% 20% 30% 40% 50% 60% 70% 80% 90% 100%
male female
Figure 7: Both the male and the female participants se-lected the direct versions (dark) of the system utterances significantly (p < 0.001) more often than the indirect ver-sions (light). There is no significant difference between the two groups and there are no significant differences to the average (black line).
0% 10% 20% 30% 40% 50% 60% 70% 80% 90% 100%
Figure 8: Among all cultures and genders, the elaborate versions (dark) of the system utterances have been chosen significantly (p <0.001) more often than the concise ver-sions (light). Moreover, there are significant differences be-tween men and women for German (p <0.005) and Polish (p <0.005). There are no significant differences between men and women for English, Russian and Spanish.
0% 10% 20% 30% 40% 50% 60% 70% 80% 90% 100%
0% 10% 20% 30% 40% 50% 60% 70% 80% 90% 100%
every day several times a week
a couple of times a
month
never
Figure 10: Among all four groups, the elaborate versions (dark) of the system utterances have been chosen signifi-cantly (p < 0.001) more often than the concise versions (light). There are no significant differences to the average (black line).
3.5.
Influence of the user’s frequency of use of
speech based assistants
In this section, the influence of the user’s frequency of use of speech based assistants like Apple Siri, Google Assistant or Microsoft Cortana is discussed. As described in Section 2.2., the study participants had to rate how often they use a speech based assistant on the following scale:
• every day
• several times a week • a couple of times a month • never
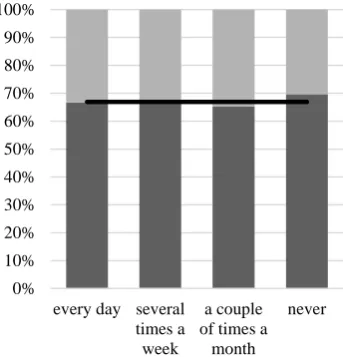
The results concerning theelaboratenessare shown in Fig-ure 10, those concerning thedirectnessare depicted in Fig-ure 11. It can be seen that among all four groups, the elabo-rate and the direct versions (dark) of the system utterances have been chosen significantly more often than the concise and the indirect versions (light). Moreover, for both the elaborateness and thedirectness, there are no significant differences to the averages. Therefore, we conclude that the user’s frequency of use of speech based assistants does not influence their preference in the system’s communica-tion style.
3.6.
Summary of the findings
Summing up the results of the user study which have been described in Sections 3.1.-3.5., we conclude:
• The system’s role significantly influences the user’s preference in the system’s communication style. • There is no difference between the investigated
Euro-pean cultures concerning thedirectnessof the system’s output.
0% 10% 20% 30% 40% 50% 60% 70% 80% 90% 100%
every day several times a week
a couple of times a
month
never
Figure 11: Among all four groups, the direct versions (dark) of the system utterances have been chosen signifi-cantly (p < 0.001) more often than the indirect versions (light). There are no significant differences to the average (black line).
• In contrast, there are cultural differences on the user’s preference of the system’selaborateness.
• It depends on the culture whether there are gender dif-ferences concerning theelaboratenessanddirectness of the system utterances.
• The user’s frequency of use of speech based assis-tants does not influence their preference in the sys-tem’s communication style.
4.
Conclusion and Future Directions
In this work, we presented a multicultural study investigat-ing what causes the differences in the communication styles directnessandelaboratenessin Human-Computer Interac-tion. Our aim was to explore the influence of the user’s culture and gender, the frequency of use of speech based assistants as well as the system’s role. Therefore, we cre-ated three dialogues with different options for the system output and conducted a user study with 339 participants from Germany, Russia, Poland, Spain and the United King-dom. The study participants had to indicate their prefer-ence concerning the system output in every dialogue turn. With the results of this study, we have shown that the sys-tem’s role significantly influences the user’s preference in the system’s communication style. Moreover, we recog-nised differences among the cultures even though five Euro-pean cultures were examined whose communication styles are very alike. We also showed that it depends on the cul-ture whether there are gender differences concerning the user’s preference in the system’s communication style and that the user’s frequency of use of speech based assistants has no influence on the user’s preference in thedirectness andelaboratenessof the system.
Dialogue Management to design a Spoken Dialogue Sys-tem which adapts its behaviour to the user’s communication idiosyncrasies.
5.
Acknowledgements
This work is part of a project that has received funding from theEuropean Union’s Horizon 2020 research and innova-tion programmeunder grant agreement No 645012.
6.
Bibliographical References
Brennan, S. E. (1996). Lexical entrainment in spontaneous dialog. Proceedings of ISSD, 96:41–44.
Burgoon, J. K., Stern, L. A., and Dillman, L. (2007). Inter-personal adaptation: Dyadic interaction patterns. Cam-bridge University Press.
Burleson, B. R. (2003). The experience and effects of emo-tional support: What the study of cultural and gender differences can tell us about close relationships, emo-tion, and interpersonal communication. Personal Rela-tionships, 10(1):1–23.
Casanueva, I., Hain, T., Christensen, H., Marxer, R., and Green, P. (2015). Knowledge transfer between speakers for personalised dialogue management. In16th Annual Meeting of the Special Interest Group on Discourse and Dialogue, page 12.
Cassell, J. and Bickmore, T. (2003). Negotiated collusion: Modeling social language and its relationship effects in intelligent agents. User Modeling and User-Adapted In-teraction, 13(1):89–132.
Doran, C., Aberdeen, J., Damianos, L., and Hirschman, L. (2003). Comparing several aspects of human-computer and human-human dialogues. In Current and new di-rections in discourse and dialogue, pages 133–159. Springer.
Elliott, C., Adams, R. J., and Sockalingam, S. (2016). Multicultural toolkit: Toolkit for cross-cultural collaboration. Awesome Library.
http://www.awesomelibrary.org/
multiculturaltoolkit.html. Accessed:
2016-05-01.
Forbes-Riley, K., Litman, D., and Rotaru, M. (2008). Re-sponding to student uncertainty during computer tutor-ing: An experimental evaluation.Lecture Notes in Com-puter Science, 5091:60–69.
Hempel, T. (2008). Usability of speech dialog systems: lis-tening to the target audience. Springer Science & Busi-ness Media.
Hofstede, G. (2009).Culture’s Consequences: Comparing Values, Behaviors, Institutions and Organizations Across Nations. Sage.
Honold, F., Bercher, P., Richter, F., Nothdurft, F., Geier, T., Barth, R., Hoernle, T., Sch¨ussel, F., Reuter, S., Rau, M., Bertrand, G., Seegebarth, B., Kurzok, P., Schatten-berg, B., Minker, W., Weber, M., and Biundo, S. (2014). Companion-technology: Towards user- and situation-adaptive functionality of technical systems. In10th In-ternational Conference on Intelligent Environments (IE 2014), pages 378–381. IEEE.
Kaplan, R. B. (1966). Cultural thought patterns in inter-cultural education. Language learning, 16(1-2):1–20.
Lewis, R. D. (2010). When Cultures Collide: Leading Across Cultures. Brealey.
Mairesse, F. and Walker, M. A. (2010). Towards personality-based user adaptation: psychologically in-formed stylistic language generation. User Modeling and User-Adapted Interaction, 20(3):227–278.
Miehle, J., Yoshino, K., Pragst, L., Ultes, S., Nakamura, S., and Minker, W. (2016). Cultural communication idiosyncrasies in human-computer interaction. In Pro-ceedings of the 17th Annual Meeting of the Special Inter-est Group on Discourse and Dialogue (SIGDIAL), pages 74–79, Los Angeles, USA, September. Association for Computational Linguistics.
Nenkova, A., Gravano, A., and Hirschberg, J. (2008). High frequency word entrainment in spoken dialogue. In Pro-ceedings of the 46th annual meeting of the association for computational linguistics on human language tech-nologies: Short papers, pages 169–172. Association for Computational Linguistics.
Niederhoffer, K. G. and Pennebaker, J. W. (2002). Lin-guistic style matching in social interaction. Journal of Language and Social Psychology, 21(4):337–360. Pickering, M. J. and Garrod, S. (2004). Toward a
mecha-nistic psychology of dialogue. Behavioral and brain sci-ences, 27(2):169–190.
Pragst, L., Ultes, S., Kraus, M., and Minker, W. (2015). Adaptive dialogue management in the kristina project for multicultural health care applications. InProceedings of the 19thWorkshop on the Semantics and Pragmatics of Dialogue (SEMDIAL), pages 202–203.
Pragst, L., Minker, W., and Ultes, S. (2017). Exploring the applicability of elaborateness and indirectness in di-alogue management. InProceedings of the 8th Interna-tional Workshop On Spoken Dialogue Systems (IWSDS). Reitter, D., Keller, F., and Moore, J. D. (2006). Compu-tational modelling of structural priming in dialogue. In Proceedings of the Human Language Technology Con-ference of the NAACL, Companion Volume: Short Pa-pers, pages 121–124. Association for Computational Linguistics.
Stenchikova, S. and Stent, A. (2007). Measuring adapta-tion between dialogs. InProc. of the 8th SIGdial Work-shop on Discourse and Dialogue.