Visualisation and Exploration of High-Dimensional Distributional Features in
Lexical Semantic Classification
Maximilian K¨oper
1, Melanie Zaiß
2, Qi Han
2, Steffen Koch
2, Sabine Schulte im Walde
11Institut f¨ur Maschinelle Sprachverarbeitung 2Institut f¨ur Visualisierung und Interaktive Systeme
Universit¨at Stuttgart, Germany
1
{maximilian.koeper,schulte}@ims.uni-stuttgart.de
2{firstname.lastname}@vis.uni-stuttgart.de
Abstract
Vector space models and distributional information are widely used in NLP. The models typically rely on complex, high-dimensional objects. We present an interactive visualisation tool to explore salient lexical-semantic features of high-dimensional word objects and word similarities. Most visualisation tools provide only one low-dimensional map of the underlying data, so they are not capable of retaining the local and the global structure. We overcome this limitation by providing an additionaltrust-viewto obtain a more realistic picture of the actual object distances. Additional tool options include the reference to a gold standard classification, the reference to a cluster analysis as well as listing the most salient (common) features for a selected subset of the words.
Keywords:vectors space models, high-dimensional features, interactive visualisation
1.
Introduction
Vector space models (VSMs) and distributional information have been a steadily increasing, integral part of lexical se-mantic research over the past 20 years (Turney and Pantel, 2010): Relying on thedistributional hypothesisthat words which occur in similar contexts tend to have similar mean-ings (Harris, 1954; Firth, 1957), VSMs have been exploited to determine co-occurrence features of target words, and to explore the notion of “similarity” between target words within a geometric setting.
While the emergence of high-dimensional vector space mod-els is increasingly pervasive within data-intensive lexical semantics, and even though useful features have been identi-fied in general terms:1when it comes to a specific semantic phenomenon, we need to explore the semantically salient distributional features in order to investigate the respective phenomenon.
Our research focuses on lexical semantic classification: au-tomatic classification of words according to their meaning. The lexical classifications are typically related to the word class, i.e., we are interested in identifying semantic classes of verbs, or nouns, or prepositions, etc. For example, compu-tational semantic classes of nouns might resembleWordNet synsets (Miller et al., 1990); semantic classes of verbs might resembleFrameNetorVerbNetclasses (Fillmore et al., 2003; Kipper Schuler, 2006); semantic classes of prepositions might resemble thePreposition Projectclasses (Litkowski and Hargraves, 2005). We aim for a theoretically and cogni-tively adequate selection of distributional features to model word meaning and word relatedness, i.e., our goal is to op-timise the choice of high-dimensional salient features that best describe and distinguish the word meanings and the semantic classes of the words.
This paper presents an interactive visual exploration tool that supports our high-dimensional models of
lexical-1
See Agirre et al. (2009) and Bullinaria and Levy (2007; 2012), among others, for systematic comparisons of co-occurrence fea-tures on various semantic relatedness tasks.
semantic objects, features and classes. Based on high-dimensional word co-occurrence features, the tool provides low-dimensional maps of the underlying objects enhanced by atrust-viewto obtain a more realistic picture of the ac-tual word distances. The word view is accompanied by a reference to a gold standard, and by a reference to a cluster analysis. These two references are optional, as there might or might not be gold standards and/or automatic classifi-cations. Furthermore, the tool allows to explore the most salient features for a selected subset of the words, according to feature overlap.
2.
System Overview
The visualisation tool is written in Java, based on the external
PREFUSEVisualisation Library (Heer et al., 2005). As input, the tool requires a text file with the high-dimensional objects and features, relying on three comma-separated columns per line: hword, feature, co-occurrence frequencyi. Option-ally, the user may provide text files with the gold standard and/or automatic class assignments, relying on two comma-separated columns per line:hword, classi.
B
B
A
A
C
C
D
D
E
E
Figure 1: Verbs are mapped into the visual representation A according to the similarity of their high-dimensional context vectors. Verbs of the gold standard classWeatherare selected in C and highlighted in A. Navigation bar B lets users switch data sets as well as load, store and recompute visual mappings. With D precomputed clusterings can be highlighted and E offers details if vectors are compared.
Main Window [A]:
The main window presents the visualisation of the T-SNE-reduced two-dimensional data points. The example in Fig-ure 1 presents a set of German verbs, where in the cur-rent screen shot the verbs belonging to the semantic class Weatherhave purple dots, see explanations for [C]:blitzen ‘to lighten’,donnern‘to thunder’,nieseln‘to drizzle’,
reg-nen‘to rain’, andschneien‘to snow’. The main window enables the user to get an overview of the spatial locations of the target objects, and their distances from each other. For example, the plot nicely shows that the three weather verbsnieseln, regnen, schneienare close to each other and comparably far away from all other verbs, and thatdonnern (which is ambiguous and has a second sense of ‘to drive with a loud sound’) is close in space tofahren‘to drive’. This window supports three interactive operations:
1. The current view permits planning operations: the view can be moved on the horizontal and the vertical axes by clicking into the space and moving the cursor.
2. Thetrust-viewcan be enabled by moving the cursor over a single object (see Section 3. for details).
3. Overlapping features between two elements are dis-played by clicking consecutively on individual ele-ments (see [E]).
Navigation Bar [B]:
The top navigation bar provides the following options: Safe Coords. allows to save the current x and y coordinates of the data points. This option is useful if the
user wants several T-SNE analyses of the same data objects and features, to exploit common and differing properties of various runs. Load Coords. allows to re-load thex andycoordinates of the data points from a previous T-SNE analysis. Refreshcreates a new visualisation, either for the same data points or for a new set of data points and/or a new set of features, as defined byFeatures. The data points may or may not have a gold standard reference, as defined byGoldstandard. Finally,Load Clust. allows to display an additional cluster analysis of the data objects.
Goldclass Assignments [C]: The gold class window is located at the upper right-hand side of the main window. It displays the gold standard class labels. Selecting a label marks all elements in window [A] with the same colour. In the example case, the semantic classWeatherhas been selected, and the weather verbs are marked by purple dots (see description above).
Optional Cluster Assignments [D]: If a cluster anal-ysis file is loaded, this window allows highlighting cluster memberships. In Figure 1, we can see that a cluster analysis with six clusters has been loaded. Clicking on any of the Cluster-Xlabels would highlight the respective verbs in the main window in the same way as the gold class assignments, by marking the verb dots.
same semantic gold standard class. For example, we could explore the clusters with regard to the five weather verbs mentioned above: How many and which of the weather verbs appear in the same cluster, and are these verbs closer to each other than verbs from other semantic classes in the same cluster?
Common Features Display [E]
When selecting an individual element in the main window [A], the entire main window freezes. Clicking on an addi-tional element then displays common features of the selected elements in window [E], i.e. words that co-occur with both elements. These features are sorted according to feature scores, where the scores are based on the information pro-vided by the input file (feature and co-occurrence value). This information is especially useful for us regarding fea-ture exploration. Here we can check which feafea-tures cause two objects being located close to each other in space. In Figure 1, the feature set underlying the verb feature vectors refers to probabilities of subcategorisation frames: Based on a parsed corpus, we induced subcategorisation frames (i.e., combinations of verb complements, such ashsubj,objaccior
hsubj,objdat,objacci) as verb features and calculated prob-abilities for verb–frame pairs. The example frames in [E] are abbreviations of such frames, withx referring to an expletive usage (such ases regnet‘it rains’ in German),n referring to an intransitive usage,nareferring to a transitive usage with a direct (accusative) object, andns-2referring to a subcategorised clause.
In Figure 1, we can see that an extremely dominating feature that causesregnen‘to rain’ andschneien‘to snow’ being located close to each other is the expletive frame type x, which is indeed a very clear indicator for weather verbs.
3.
Trust-View
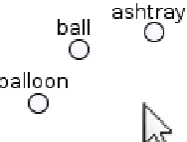
The reduction of high-dimensional feature vectors into a low-dimensional visualisation helps users to comprehend general semantic relations between vectors, by maintaining the idea that representations of similar vectors are shown closer together than dissimilar ones. While such a visual rep-resentation certainly offers a good overview, the dimensional reduction comes at the cost of information loss, leading to distortions in the displayed distances of vectors in the low dimensional space. As a consequence, there is a risk of misinterpreting semantic relatedness of feature vectors, es-pecially if specific word vectors are compared (Chuang et al., 2012). To diminish this problem, thetrust-viewlets users inspect a vector interactively by hovering it with the mouse. In response to this interaction, all other word vector representations are moved radially to the hovered element in an animation, since showing correct distances relatively to a single item is perfectly possible in a 2D view. In addition to the animation, the original position of moved items is depicted in light gray to help users preserve their mental map of the initial representation. Figures 2 and 3 illustrate the trust view tool feature: the standard distances locate ”ashtray“ and ”balloon“ close to ”ball“. Once the mouse is
located over ”ball“ a more realistic picture is obtained. Equation 1 shows how we obtain the new 2D location of an element, relying on both the original high-dimensional
Figure 2: The standard view shows the 2d-mapping of word vectors computed with t-SNE.
distances divided by the average high-dimensional distance, and a normalisation factor. This normalisation factor is com-puted by considering the distances of the k-nearest neigh-bours in the 2d-representation.2
dist2d= ( disthd meanhd
)·mean2d−kN N (1)
Figure 3: Hovering a visual term representation activates thetrust-viewshowing more realistic distances (similarities) of other objects with respect to the hovered one (’ball’). For better understanding, the transition of visual representation is animated, and original positions are depicted in light gray.
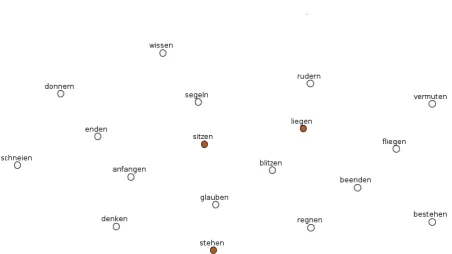
A more complex example of the trust view interaction is illustrated by Figure 4 (showing the initial situation) in con-trast to Figure 5 (showing the triggered trust-view). In this example, the three verbsliegen‘to lie‘,sitzen‘to sit’, and stehen‘to stand’ from the gold standard classPositionare marked in red, and the verbliegenis chosen for the trust-view. We can see that – while in the initial view the three verbs are located in some distances from each other, with verbs from other semantic classes between them – the trust-view brings them close to each other in 2d-trust-view. The exam-ples demonstrate that, with this mechanism, the trust-view offers both a good overview and the reliable analysis of se-mantic relations between a user-selected word vector and its neighbourhood.
4.
Related Work
A growing number of literature considers text visualisations. This is often done for collections of documents, e.g. Wise et al. (1999) developed a tool to analyse large amounts of documents. There is also a rich tradition of visualisation
2Empirical evidence showed thatk= 5neighbours is a good
Figure 4: Standard view, with distances based on T-SNE. The verbs highlighted in red belong to the gold standard class Position:liegen‘to lie‘,sitzen‘to sit’,stehen‘to stand’.
Figure 5:Trust-Viewwith respect to the position verbliegen‘to lie’.
approaches with respect to topic models, such as Sievert and Shirley (2014) who make use of Latent Dirichlet allocation
an important aspect in Chuang et al. (2012), who developed a visual analysis tool based on 9,000 Ph.D. theses for in-vestigating shared ideas and interdisciplinary collaboration between academic departments.
There is comparable little work with respect to visualisation in lexical semantics: Kievit-Kylar and Jones (2012) present a tool that allows to identify relations between words in a graph structure, where words are visualised as nodes, and word similarities are shown as directed edges. In contrast to our proposed tool, the actual position of a word is how-ever not determined by its underlying feature distribution, and can even be changed using click and drag. Heylen et al. (2012) used Google Chart Tools together with multidi-mensional scaling to obtain a two-dimultidi-mensional visualisation based on the occurrences of Dutch nouns.
5.
Conclusion
We presented a novel interactive tool to visualise and explore high-dimensional distributional features in lexical semantic classification. The tool provides a visual overview that approximates the relation of objects, and in addition offers atrust-viewfor the reliable interpretation of distances if one specific element is in focus. Our tool is especially useful when explicit feature information and classification assignments are available.
6.
Acknowledgements
The research was supported by the DFG Collaborative Re-search Centre SFB 732 (Maximilian K¨oper) and the DFG Heisenberg Fellowship SCHU-2580/1 (Sabine Schulte im Walde).
7.
Bibliographical References
Agirre, E., Alfonseca, E., Hall, K., Kravalova, J., Pasca, M., and Soroa, A. (2009). A study on similarity and related-ness using distributional and WordNet-based approaches. InProceedings of the North American Chapter of the Association for Computational Linguistics and Human Language Technologies Conference, pages 19–27. Bullinaria, J. A. and Levy, J. P. (2007). Extracting
se-mantic representations from word co-occurrence statis-tics: A computational study. Behavior Research Methods, 39(3):510–526.
Bullinaria, J. A. and Levy, J. P. (2012). Extracting semantic representations from word co-occurrence statistics: Stop-lists, stemming, and SVD. Behavior Research Methods, 44:890–907.
Chuang, J., Ramage, D., Manning, C. D., and Heer, J. (2012). Interpretation and trust: Designing model-driven visualizations for text analysis. InACM Human Factors in Computing Systems, pages 443–452.
Fillmore, C. J., Johnson, C. R., and Petruck, M. R. (2003). Background to FrameNet.International Journal of Lexi-cography, 16:235–250.
Firth, J. R. (1957). Papers in Linguistics 1934-51.
Harris, Z. (1954). Distributional structure. Word, 10(23):146–162.
Heer, J., Card, S. K., and Landay, J. A. (2005). Prefuse: A toolkit for interactive information visualization. In Pro-ceedings of the SIGCHI Conference on Human Factors in Computing Systems, pages 421–430.
Heylen, K., Speelman, D., and Geeraerts, D. (2012). Look-ing at word meanLook-ing: An interactive visualization of se-mantic vector spaces for Dutch synsets. InProceedings of the EACL 2012 Joint Workshop of LINGVIS & UNCLH, pages 16–24.
Kievit-Kylar, B. and Jones, M. N. (2012). Visualizing mul-tiple word similarity measures. Behavior Research Meth-ods, 44(3):656–674.
Kipper Schuler, K. (2006). VerbNet: A Broad-Coverage, Comprehensive Verb Lexicon. Ph.D. thesis, University of Pennsylvania, Computer and Information Science. Litkowski, K. C. and Hargraves, O. (2005). The preposition
project. InProceedings of the 2nd ACL-SIGSEM Work-shop on The Linguistic Dimensions of Prepositions and their Use in Computational Linguistics Formalisms and Applications, pages 171–179.
Miller, G. A., Beckwith, R., Fellbaum, C., Gross, D., and Miller, K. J. (1990). Introduction to Wordnet: An on-line lexical database. International Journal of Lexicography, 3(4):235–244.
Sievert, C. and Shirley, K. (2014). LDAvis: A method for visualizing and interpreting topics. InProceedings of the Workshop on Interactive Language Learning, Visualiza-tion, and Interfaces, pages 63–70.
Smith, A., Hawes, T., and Myers, M. (2014). Hiearchi`e: Visualization for hierarchical topic models. In Proceed-ings of the Workshop on Interactive Language Learning, Visualization, and Interfaces, pages 71–78.
Turney, P. D. and Pantel, P. (2010). From frequency to meaning: Vector space models of semantics.Journal of Artificial Intelligence Research, 37:141–188.
van der Maaten, L. J. and Hinton, G. E. (2008). Visualizing high-dimensional data using t-SNE.Journal of Machine Learning Research, 9:2579–2605.