CHARACTERIZING α-SYNUCLEIN MEMBRANE BOUND STRUCTURE
Thesis by Bert Tsunyin Lai
In Partial Fulfillment of the Requirement for the Degree of
Doctor of Philosophy
California Institute of Technology Pasadena, California
2008
ACKNOWLEDGEMENTS
As I am writing my thesis, I am just very grateful to so many people for this experience. I have learned so much from various people. First of all, I would like to thank Prof. Harry Gray for granting me this wonderful opportunity. I am constantly inspired by his enthusiasm towards science. To Dr. Jay Winkler, I am deeply grateful to have a chance to learn from him, his vast amount of knowledge, his attitude
towards science, and his quest for perfection.
To Prof. Judy Kim, thank you for inspiring me to be the best graduate student I can be. But, my project would not have gone this far without the guidance of Dr. Jennifer Lee. I have also had a great opportunity to work with some brilliant undergraduate students, namely Dustin Hawker, Stephanie Schulze, and Matthew Robinson. My learning process has also become much more enjoyable with my three wonderful colleagues, Crystal Shih, Melanie Pribisko, and Dr. Gitrada Arjara.
ABSTRACT
A feature of Parkinson's disease is the presence of fibrillar protein deposits composed mostly of α-synuclein and calcium ions in the brain’s substantia nigra region. Although α-synuclein is natively unfolded, the N-terminal region of the protein is highly helical in the presence of membrane mimics, such as acidic phospholipid vesicles and SDS micelles. The C-terminal region of α-synuclein is known to bind to calcium ions and modulates aggregation. In this thesis, the structure of α-synuclein variants, incorporated with tryptophan and 3-nitrotyrosine as donor and energy acceptor pairs, have been characterized in the presence of SDS micelles, small unilammelar vesicles, and calcium ions by various techniques. Distance
distributions extracted from time-resolved fluorescence energy-transfer measurements provide site-specific information on the protein conformations. In addition, similar studies using mutants linked to early onset Parkinson’s disease were also performed to investigate the structural effect caused by these mutations. Furthermore, single tryptophan mutants have been designed as fluorescent reporters. The locations of these different tryptophan residues in the bilayer were probed by lipids labeled with bromine and dinitrophenol quenchers. Finally, preliminary studies of the
TABLE OF CONTENTS
Acknowledgements…...…....………..………...…….. iii
Abstract…....………....… iv
Table of Contents……….………v
List of Tables, Figures, and Schemes………..……….…….………. viii
CHAPTER 1: α-Synuclein: Background, Methods, and Initial Studies……….1
Introduction……….………...2
Materials and Methods…….……….……….………... 5
Results and Discussions………...9
Acknowledgement.……… 16
References……...……….………..16
CHAPTER 2: Phospholipid Interaction Sites of α-Synuclein Determined by Tryptophan………...18
Abstract…..……….……...19
Introduction……….……...20
Methods………...……….……. 21
Results and Discussions………...24
Acknowledgement………. 42
References……..………... 42
CHAPTER 3: α-Synuclein Membrane-bound Structures Characterized by Fluorescence Energy-transfer Kinetics………..………44
Abstract…..………...45
Methods……….……….………... 49
Results and Discussions………...50
Acknowledgement………. 60
References……...………...60
CHAPTER 4: Calcium Binding Behavior of α-Synuclein’s C-terminal Tail….62 Abstract…..………...63
Introduction………....64
Methods………...……….……. 67
Results and Discussions………...69
Acknowledgement………. 99
References…...………...99
CHAPTER 5: Structural Effect on α-Synuclein Caused by Two Single-point Mutations Related to Familial Parkinson’s Disease……….102
Abstract………...103
Introduction……….……...104
Methods………...……….. 106
Results and Discussions.………106
Acknowledgement……..………... 125
References…...…………..……….125
CHAPTER 6: Highly Fluorescent Dye for α-Synuclein Aggregation Studies... 127
Abstract………...128
Results and Discussions.………141
Acknowledgement……..………... 154
References..………..………. 154
CHAPTER 7: α-Synuclein Intramolecular Aggregation Studies.………...155
Abstract………...156
Introduction……….……...157
Methods………...……….. 157
Results and Discussions.………160
Acknowledgement……..………... 175
LIST OF TABLES, FIGURES, AND SCHEMES
CHAPTER 1: α-Synuclein: Background, Methods, and Initial Studies
Figure 1.1: Human α-Syn Sequence..………...………... 4 Figure 1.2: Structures of Lipids Used………...………...10 Figure 1.3: CD Spectra of Wild-type of α-Syn in Various Environments……...11 Figure 1.4: Steady-state Fluorescence Spectra of α-Syn Mutant……….13 Figure 1.5: α-Syn Insertion Monitored by Steady-state Fluorescence………….15 CHAPTER 2: Phospholipid Interaction Sites of α-Synuclein Determined by Tryptophan
Figure 3.2: DLS Correlation Function of 1:1 POPC:POPA SUVs………..51 Figure 3.3: D-A Distance Distributions for α-Syn N-terminal Helix Mutants… 55 Figure 3.4: D-A Distance Distributions for α-Syn C-terminal Helix Mutants… 56 Figure 3.5: D-A Distance Distributions for α-Syn Turn Mutants………59 Table 3.1: Fluorescence Maxima of α-Syn Mutants in Buffer and Membranes..53 CHAPTER 4: Calcium Binding Behavior of α-Synuclein’s C-terminal Tail
Figure 4.18: Amino Acid Sequence of the C-terminal Tail of α-Syn…………..98
Table 4.1: Electron Transfer Rates for α-Syn Mutants………79
CHAPTER 5: Structural Effect on α-Synuclein Caused by Two Single-point Mutations Related to Familial Parkinson’s Disease Figure 5.1: D-A Distributions of W4/Y19/A53T and Y19/W39/A53T…...…... 107
Figure 5.2: D-A Distributions of Y74/W94 and Its Disease-related Mutants…. 110 Figure 5.3: D-A Distributions of Y39/W94 and Its Disease-related Mutants…. 111 Figure 5.4: D-A Distributions of W39/Y55 and Its Disease-related Mutants…. 113 Figure 5.5: The Effect of A30P and A53T on the N-terminal Mutants………...115
Figure 5.6: D-A Distributions of W125/Y136/A30P (and A53T) in HEPES…..117
Figure 5.7: D-A Distributions of W94/Y113/A30P (and A53T) in HEPES……118
Figure 5.8: D-A Distributions of W94/Y125/A30P (and A53T) in HEPES……120
Figure 5.9: D-A Distributions of W94/Y125/A30P (and A53T) in SUVs…… 121
Figure 5.10: D-A Distributions of W94/Y113/A30P (and A53T) in SUVs…… 122
Figure 5.11: D-A Distributions of W125/Y136/A30P (and A53T) in SUVs….. 124
CHAPTER 6: Highly Fluorescent Dye for α-Synuclein Aggregation Studies Figure 6.1: Structures of Fluorescent Labels and Model Complexes……..…....131
Figure 6.2: FPLC Trace of Dansyl-labeled Protein Purification………... 143
Figure 6.3: FPLC Trace of the Double-labeled Protein………...144
Figure 6.4: Overlapping between Fluorescent Dyes and Cyt c…………... 147
Figure 6.5: Fluorescence Spectra of phI-SHark Labeled Cyt c………... 148
Figure 6.8: Fluorescence Decay Rates of phI-SHark Model Complex…... 152 Figure 6.9: Overlapping between phI-SHark and Nitrophenol…………...153 Table 6.1: Fluorescence Characteristics of Dyes………...146 CHAPTER 7: α-Synuclein Intramolecular Aggregation Studies
Chapter 1
1.1 INTRODUCTION
α-Synuclein.
Parkinson’s disease develops from the loss of dopaminergic neurons in the substania nigra region located in the brain stem. It also can be characterized by the
presence of intracellular inclusions, namely Lewy bodies,1 which are mostly comprised of α-synuclein (α-syn).2,3 Although the detailed role of α-syn in the pathogenic mechanism is unclear, the protein is commonly found in the cytosol and presynaptic nerve terminals of a neuron.4-6 The localization mechanism of α-syn is not well understood. Unlike other presynaptic proteins, α-syn does not tightly associate with the synaptic plasma membrane or the synaptic vesicle.7,8
Though the protein is characterized to be unstructured in vitro,9 numerous experimental data now indicate that α-syn is not a random coil, but contains regions of structural preferences.10-15 In the presence of acidic phospholipid vesicles, the protein will adopt α-helical structures. Notably, α-syn does not appear to interact with neutral phospholipid vesicles.16 These structures have been characterized by circular dichroism (CD),17 nuclear magnetic resonance (NMR),18-20 and electron paramagnetic resonance (EPR) spectroscopies.21,22 These conformers are particularly important because α-helical dimers and multimers have been observed in lipid
The primary amino acid sequence of human α-syn has been illustrated in Figure 1.1. The N-terminal region of α-syn includes seven imperfect repeats
10 20 30 40 50 MDVFMKGLSKAKEGVVAAAEKTKQGVAEAAGKTKEGVLYVGSKTKEGVVH 60 70 80 90 100 GVATVAEKTKEQVTNVGGAVVTGVTAVAQKTVEGAGSIAAATGFVKKDQL
110 120 130 140 GKNEEGAPQEGILEDMPVDPDNEAYEMPSEEGYQDYEPEA
1.2 MATERIALS AND METHODS
Materials.
Lipids were purchased in chloroform from Avanti Polar Lipids (Alabaster, AL). N-acetyl-tryptophanamide (NATA), sodium dodecyl sulfate (SDS), and
tetranitromethane (TNM) were used as received from Sigma. BL21(DE3)pLysS was obtained from Stratagene.
Protein Preparation, Modification, and Characterization.
M. Goedert (Medical Council Research Laboratory of Molecular Biology, Cambridge, U.K.) provided the wild-type human α-syn expression vector.8 Mutations were introduced in three various positions by site-directed mutagenesis. All the sequences were confirmed by DNA sequencing.
Expression and purification of mutants were achieved following previously published protocols with minor modifications.31 The mutant plasmids were
α-Syn was extracted from the frozen cells by boiling and acid precipitation. The crude protein solution was then purified by Q-Sepharose Fast Flow 16/10 column (Amersham Biosciences) by fast protein liquid chromatography (FPLC) equilibrated with 20 mM Tris buffer (pH 8.0). The protein was eluted with a gradient from 0 to 0.5 M NaCl. The semi-pure protein fractions were combined and further purified on a Mono-Q 10/10 column (Amersham Biosciences).
Proteins were nitrated following published protocol with minor
modification.32 Purified and concentrated (~100 μM) α-syn in 20 mM Tris buffer with 200-300 mM NaCl at pH 8.0 was stirred under Ar for 20 min in the dark. To the stirring protein solution (850 μL), TNM in ethanol [1% (vol/vol), 75 μL] was added dropwise. A second aliquot of TNM solution was added after 10 min. After another 10 min, the reaction was desalted by gel filtration chromatography (HiPrep Desalting 26/10, Amersham Biosciences) using FPLC. The desalted protein was then purified on a Mono-Q 10/10 column.
The concentration of non-nitrated protein was determined using a molar extinction coefficient estimated by amino acid content: ε280 = 6 970 M-1·cm-1, while nitrated protein concentration was determined by literature molar extinction
coefficient: ε381 = 2 200 M-1· cm-1.33 Absorption measurements were carried out by a Hewlett-Packard 8452 diode array spectrophotometer. Purities of all protein samples were evaluated by SDS-PAGE on a Pharmacia PhastSystem (Amersham Biosciences). Molecular weights of all protein samples were determined by electrospray mass
Laboratory). All protein stock solutions were concentrated using Amicon YM-3 (molecular weight cutoff 3 kD; Millipore) and stored in -80 °C.
Preparation of Membrane Mimics.
Small Unilammelar Vesicles (SUVs) were made from published protocols.34 Chloroform from the lipid solutions was removed under a stream of Ar and then dried under vacuum. 20 mM sodium phosphate (NaPi) buffer (pH 7.4) was used to
resuspend the dried lipid into a concentration of 5 mg/mL. The lipid solution was then sonicated by a Branson ultrasonicator microtip (Plainview, NJ) for 30 min at 50% duty cycle (200 W). The sonicated SUVs were then diluted to a final
concentration of 2 mg/mL with NaPi buffer and equilibrated overnight at room temperature. Titanium dust and particulates were removed by centrifuging the SUV solution at 10,000 × g for 10 min. Freshly prepared SUVs were used for all
experiments. SDS micelles were made by preparing a 40 mM solution of SDS. The micelle solution was then filtered by 0.22 μm filter before use.
Steady-State Measurements.
band-spectropolarimeter (Aviv Associates, Lakewood, NJ) in a 1 mm cuvette at 25 °C. Measurements of 5 µM α-synuclein were recorded between 200 nm and 260 nm with a band-pass of 1.5 nm.
Time-Resolved Fluorescence Measurements.
Trp fluorescence-decay kinetics were measured as described in literature.35 The experimental samples were prepared as described above and deoxygenated by 30 cycles of evacuation/Ar-fill on a Schlenk line. The Trp was excited by a 292 nm polarized pulse (35° from vertical) from a regeneratively amplified femtosecond Ti:sapphire laser (Spectra-Physics). Interference filters were used to select Trp emissions between 325 and 400 nm. The Trp fluorescence decay kinetics were recorded in single photon counting mode by a picosecond streak camera (Hamamatsu Photonics C5680, Hamamatsu City, Japan). Control experiments were performed using the Trp model complex, NATA.
Data Analysis.
Trp fluorescence decay kinetics were modeled with Equation 1, where I0(t) is the Trp fluorescent decay without the presence of quencher, P(r) is the probability of observing the donor-acceptor distance r, and ket(r) is the energy transfer rate at distance r.
∫
−=I t P r k r t dr t
I( ) 0( ) ( )exp( et( ) ) (1)
constrained by the requirement of P(r) ≥ 0. The narrowest P(k) distributions were projected by a linear least-squares (LLS) MATLAB (Mathworks, Natick, MA) algorithm with a non-negative constraint (LSQNONNEG). The P(k) distribution obtained from the above fitting routine was recasted into a distribution of r using the Förster equation (Equation 2), where kR is the measured radiative decay rate constant of excited NATA.
6 / 1 0( DkR /ket) R
r = Φ (2)
1.3 RESULTS AND DISCUSSION
Different SUVs studies.
Five types of lipids have been utilized in this thesis (Figure 1.2). Previous work has suggested that α-syn will only form a helical structure when acidic SUVs are present. Therefore, most of the SUVs were made of a 1:1 molar mixture of sn-glycero-3-phosphocholine (POPC) and palmitoyl-2-oleoyl-sn-glycero-3-phosphate (POPA). The other three types of lipids used were
palmitoyl-2-stearoyl(6,7-dibromo)-sn-glycero-3-phosphocholine (6,7-DiBr),
1-palmitoyl-2-stearoyl(11,12-dibromo)-sn-glycero-3-phosphocholine (11,12-DiBr), and N-dinitrophenyl phosphatidylethanolamine (DNP).
(a)
(b)
(c)
(d)
[image:21.612.107.517.95.551.2](e)
Figure 1.2. Structure of (a) 1-palmitoyl-2-oleoyl-sn-glycero-3-phosphocholine
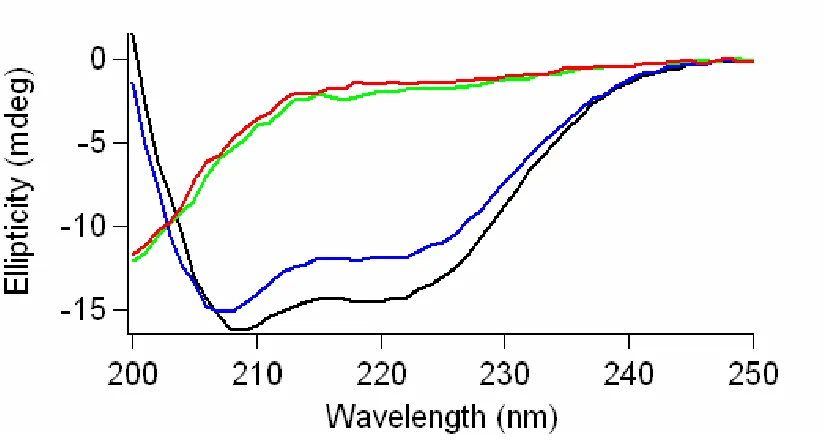
POPC:POPA SUVs and SDS micelles. However, the CD spectra are comparable in solution and POPC SUVs, implying that minimal structures were induced when neutral vesicles are utilized.
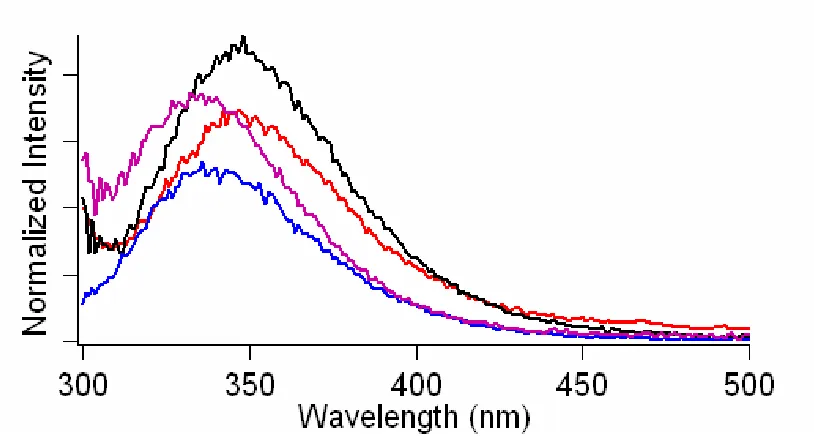
This phenomenon was further proven by submitting a Trp-containing α-syn mutant (W39/Y55) to steady-state fluorescence spectroscopy in the aforementioned environments (Figure 1.4). Protein local environments can often be elucidated from Trp emissions.36-39 The data suggests the λmax of Trp emission for this α-syn mutant in solution is 347 nm. This emission maxima is similar when the mutant was placed in POPC SUVs (λmax = 348 nm).
α-Syn Insertion Studies.
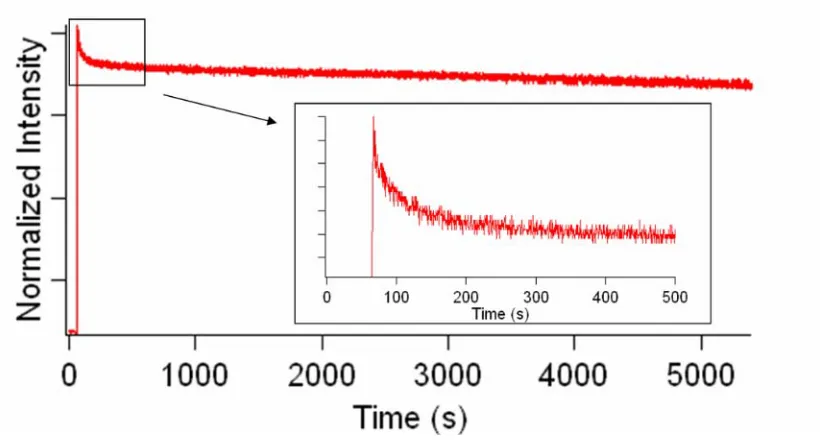
It is important to determine the timescale for α-syn insertion into the bilayer to ensure that spectroscopic studies will be carried out after the samples have been fully equilibrated. As mentioned above, the quantum yield of Trp increases when it is placed in a more hydrophobic environment. We took advantage of this phenomenon to study the insertion kinetics of α-syn. The emission was monitored in 350 nm. Therefore, when the Trp is inserted into the bilayer, the fluorescence will increase significantly.
Figure 1.5 shows the fluorescence spectra when W4 was mixed with 1:1
POPC:POPA SUVs. A concentrated W4 solution was injected into a cuvette of SUVs when time = 62 s. Therefore, a significant increase of emission was observed at that point. After the sharp increase, there was a step of an appreciable decrease of fluorescence that lasts approximately another 150 s (inset). This implies that the insertion of α-syn into the lipid bilayer is almost instantaneous, followed by an equilibration step that lasts for minutes.
Figure 1.5. Steady-state fluorescence of Trp4 inserting into 1:1 POPC:POPA SUVs
1.4 ACKNOWLEDGEMENT
This work is completed in collaboration with Dr. Jennifer C. Lee.
1.5 REFERENCE
(1) Galvin, J. E.; Lee, V. M.; Schmidt, M. L.; Tu, P. H.; Iwatsubo, T.; Trojanowski, J. Q..Adv. Neurol. 1999, 808, 313–324.
(2) Spillantini, M. G.; Crowther, R. A.; Jakes, R.; Hasegawa, M.; Goedert, M. Proc. Natl. Acad. Sci. U. S. A. 1998, 95, 6469–6473.
(3) Spillantini, M. G.; Schmidt, M. L.; Lee, V. M. Y.; Trojanowski, J. Q.; Jakes, R.; Goedert, M. Nature 1997, 388, 839–840.
(4) George, J. M.; Jin, H.; Woods, W. S.; Clayton, D. F. Neuron 1995, 15, 361– 372.
(5) Iwai, A.; Masliah, E.; Yoshimoto, M.; Ge, N. F.; Flanagan, L.; Desilva, H. A. R.; Kittel, A.; Saitoh, T. Neuron 1995, 14, 467–475.
(6) Irizarry, M. C.; Growdon, W.; Gomez-Isla, T.; Newell, K.; George, J. M.; Clayton, D. F.; Hyman, B. T. J. Neuropath. Exp. Neur. 1998, 57, 334–337. (7) Maroteaux, L.; Scheller, R. H. Mol. Brain Res. 1991, 11, 335–343.
(8) Jakes, R.; Spillantini, M. G.; Goedert, M. Febs. Lett. 1994, 345, 27–32. (9) Weinreb, P. H.; Zhen, W. G.; Poon, A. W.; Conway, K. A.; Lansbury, P. T.
Biochemistry 1996, 35, 13709–13715.
(10) Bertoncini, C. W.; Jung, Y. S.; Fernandez, C. O.; Hoyer, W.; Griesinger, C.; Jovin, T. M.; Zweckstetter, M. Proc. Natl. Acad. Sci. U. S. A. 2005, 102, 1430–1435.
(11) Lee, J. C.; Gray, H. B.; Winkler, J. R. J. Am. Chem. Soc. 2005, 127, 16388– 16389.
(12) Lee, J. C.; Langen, R.; Hummel, P. A.; Gray, H. B.; Winkler, J. R. Proc. Natl. Acad. Sci. U. S. A. 2004, 101, 16466–16471.
(13) Lee, J. C.; Lai, B. T.; Kozak, J. J.; Gray, H. B.; Winkler, J. R. J. Phys. Chem. B 2007, 111, 2107–2112.
(14) Dedmon, M. M.; Lindorff-Larsen, K.; Christodoulou, J.; Vendruscolo, M.; Dobson, C. M. J. Am. Chem. Soc. 2005, 127, 476–477.
(15) Bernado, P.; Bertoncini, C. W.; Griesinger, C.; Zweckstetter, M.; Blackledge, M. J. Am. Chem. Soc. 2005, 127, 17968–17969.
(16) Conway, K. A.; Harper, J. D.; Lansbury, P. T. Biochemistry 2000, 39, 2552– 2563.
(17) Davidson, W. S.; Jonas, A.; Clayton, D. F.; George, J. M. J. Biol. Chem. 1998, 273, 9443–9449.
(18) Eliezer, D.; Kutluay, E.; Bussell, R.; Browne, G. J. Mol. Biol. 2001, 307, 1061–1073.
(19) Bussell, R.; Eliezer, D. J. Mol. Biol. 2003, 329, 763–778.
(21) Ramakrishnan, M.; Jensen, P. H.; Marsh, D. Biochemistry 2003, 42, 12919– 12926.
(22) Jao, C. C.; Der-Sarkissian, A.; Chen, J.; Langen, R. Proc. Natl. Acad. Sci. U. S. A. 2004, 101, 8331–8336.
(23) Narayanan, V.; Scarlata, S. Biochemistry 2001, 40, 9927–9934. (24) Lee, H. J.; Choi, C.; Lee, S. J. J. Biol. Chem. 2002, 277, 671–678. (25) Volles, M. J.; Lansbury, P. T. Biochemistry 2002, 41, 4595–4602. (26) Zhu, M.; Li, J.; Fink, A. L. J. Biol. Chem. 2003, 278, 40186–40197.
(27) Perrin, R. J.; Woods, W. S.; Clayton, D. F.; George, J. M. J. Biol. Chem. 2000, 275, 34393–34398.
(28) McLean, P. J.; Kawamata, H.; Ribich, S.; Hyman, B. T. J. Biol. Chem. 2000, 275, 8812–8816.
(29) Jo, E. J.; McLaurin, J.; Yip, C. M.; St George-Hyslop, P.; Fraser, P. E. J. Biol. Chem. 2000, 275, 34328–34334.
(30) Ueda, K.; Fukushima, H.; Masliah, E.; Xia, Y.; Iwai, A.; Yoshimoto, M.; Otero, D. A. C.; Kondo, J.; Ihara, Y.; Saitoh, T. Proc. Natl. Acad. Sci. U. S. A. 1993, 90, 11282–11286.
(31) Winkler, G. R.; Harkins, S. B.; Lee, J. C.; Gray, H. B. J. Phys. Chem. B 2006, 110, 7058–7061.
(32) Rischel, C. J. Mol. Biol. 1996, 257, 877–885.
(33) Riordan, J. F.; Vallee, B. L. Meth. Enzymol. 1972, 25, 515–521.
(34) Kim, J. E.; Arjara, G.; Richards, J. H.; Gray, H. B.; Winkler, J. R. J. Phys. Chem. B 2006, 110, 17656–17662.
(35) Wu, P. G.; Brand, L. Anal. Biochem. 1994, 218, 1–13.
(36) Reshetnyak, Y. K.; Koshevnik, Y.; Burstein, E. A. Biophys. J. 2001, 81, 1735–1758.
(37) Kleinschmidt, J. H.; den Blaauwen, T.; Driessen, A. J. M.; Tamm, L. K. Biochemistry 1999, 38, 5006–5016.
(38) Doring, K.; Konermann, L.; Surrey, T.; Jahnig, F. Eur. Biophys. J. 1995, 23, 423–432.
Chapter 2
2.1 ABSTRACT
A hallmark of Parkinson's disease is the presence of fibrillar α-synuclein deposits in the brain. Although its function is ill defined, α-synuclein is found to associate with synaptic vesicles. Interestingly, α-synuclein appears to be natively unfolded in vitro. However, in the presence of membrane mimics (e.g., SDS micelles and acidic phospholipid vesicles), the protein adopts a highly helical conformation. We have prepared six single tryptophan-containing variants (W4, W39, W94, W101, W125, and W136). Their interactions with phospholipid vesicles by steady-state and time-resolved fluorescence measurements were probed. Using energy-transfer
2.2 INTRODUCTION
Though α-syn is characterized to be unstructured in vitro,1 numerous
experimental data now indicate that α-syn is not a random coil, but contains regions of structural preferences.2-7 In the presence of acidic phospholipid vesicles, the protein will adopt α-helical structures. Notably, α-syn does not appear to interact with neutral phospholipid vesicles.8 These structures have been characterized by circular dichroism (CD),9 nuclear magnetic resonance (NMR),10-12 and electron paramagnetic resonance (EPR) spectroscopies.13,14
Previously, Ulmer et al.15 have investigated the structure of α-syn in
association with SDS micelles using NMR. Their results show that two α-helices are formed within the N-terminal region (residues 3-37 and 45-92) in an antiparallel arrangement, joined by a short linker (residues 38-44). The C-terminal tail remains unstructured. In a separate study, Langen and coworkers14 have characterized the location of residues 8-89 when associated with small unilammelar vesicles (SUVs) using site-directed spin labeling. In contrast to the micellar bound conformer, each eleven-residue repeat folds into three α-helical turns. This arrangement can be attributed to the charge distribution of the amino acids within the repeats: the
In this study, measurements of steady-state and time-resolved fluorescence were employed to characterize the interactions of SUVs with α-syn. A single
tryptophan mutation was incorporated into six different sites (W4, W39, W94, W101, W125, and W136) to serve as a fluorescent probe for distinct regions of the protein: W4 on the N-terminus, W39 in the linker region, W94 on the C-terminal end of the NAC sequence, W101, W125, and W136 in the highly acidic C-terminus. In addition, we utilized commercially available phospholipids containing heavy-atom (Br) and energy-transfer (dinitrophenol) quenchers to elucidate the specific location of the individual Trp residues with respect to the lipid bilayer.
2.3 METHODS
Preparation of Small Unilamellar Vesicles (SUVs).
SUVs were prepared from a 1:1 molar mixture of lipids, phosphocholine (POPC), and
1-palmitoyl-2-oleoyl-sn-glycero-3-phosphate (POPA) following published protocols and was described in Chapter 1.16 Brominated lipids chosen for this experiment were 1-palmitoyl-2-stearoyl(6,7-dibromo)-sn-glycero-3-phosphocholine (6,7-DiBr) and 1-palmitoyl-2-stearoyl(11,12-dibromo)-sn-glycero-3-phosphocholine (11,12-DiBr); mixed vesicles were made in a 1:2:1 molar ratio of POPC:POPA:Di-Br. The distances between the
phosphatidylethanolamine (DNP), located at the head group, were used in a molar ratio of 4:5:1 POPC:POPA:DNP.
Protein Preparation, Modification, and Characterization.
The protein preparation, modification, and characterization processes were described in Chapter 1. Site-directed mutagenesis was performed to introduce tryptophan at six different sites (W4, W39, W94, W101, W125, and W136). All mutated sequences were confirmed by DNA sequencing (California Institute of Technology DNA Sequencing Core Facility).
Steady-state Absorption and Fluorescence Spectroscopy.
Using gel filtration chromatography (PD-10 desalting columns, GE
To evaluate the amount of quenching for α-syn mutants in 25% 6,7-DiBr and 25% 11,12-DiBr SUVs, the ratios of quenched-to-unquenched emission (F/F0) were calculated. Emissions were integrated between 300 nm and 500 nm after background substrations. The ratio was then obtained by comparing the integrated emissions of
α-syn mutants between brominated SUVs and quencher-free SUVs.
Time-resolved Fluorescence Measurements.
Time-resolved fluorescence decay experiments were carried out as previously described in Chapter 1. For anisotropy decay kinetics measurements, samples were excited by a vertically polarized laser pulse and both polarizations (IVV and IVH) were collected simultaneously for each sample.
Data Analysis.
The measured fluorescence decay kinetics were fitted by previously described procedures.5 Kinetics traces were logarithmically compressed (100 points per time decade) and modeled with NNLS fitting protocol to project the narrowest P(k) distributions from the fluorescence kinetics.4 To provide more information on the amount of quenching for α-syn mutants in SUVs containing brominated lipids, quenched-to-unquenched lifetime ratio (τ/τ0) was also determined by comparing their weighed fluorescent decay rate.
luminescence spectra obtained from NATA. Then, the anisotropy value (r) could be obtained by applying this equation,
VH VV VH VV GI I GI I r 2 + − = .
The anisotropy decay curve was then fitted against single exponential decay to determine the rotational correlation time of each mutant in POPC:POPA SUVs.
2.4 RESULTS AND DISCUSSIONS
Steady-state Fluorescence.
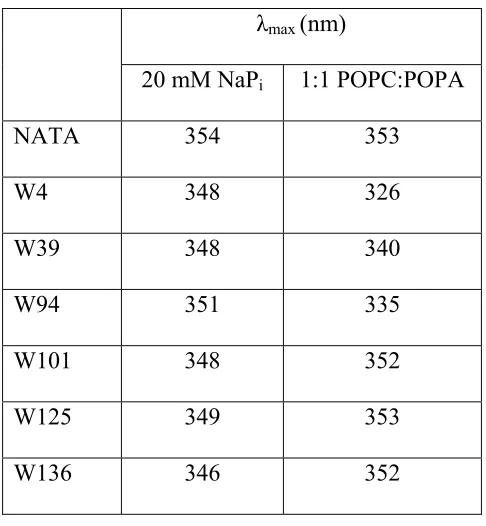
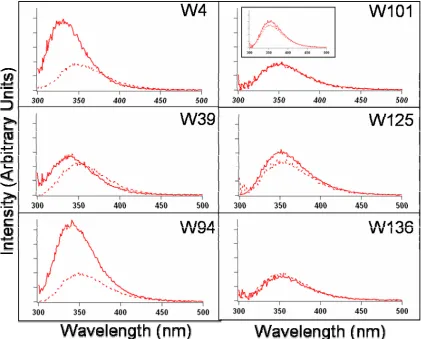
Tryptophan emission is an extremely sensitive probe of protein local environments.20-23 Shown in Figure 2.1 and Table 2.1 are the fluorescence
properties of Trp mutants in NaPi buffer and when bound to SUVs (1:1 POPC:POPA). For the model complex, NATA, and the C-terminal mutants, the Stokes shifts (59 nm) are similar for both buffer and vesicle solutions. These shifts are characteristic of a completely water-exposed indole (Figure 2.1). In contrast, the three N-terminal α -syn variants exhibit smaller Stokes shifts upon the addition of vesicles, revealing that the three Trp residues are located in more hydrophobic environments, while the C-terminal mutants remain in hydrophilic environments.
λmax (nm)
20 mM NaPi 1:1 POPC:POPA
NATA 354 353
W4 348 326 W39 348 340 W94 351 335
W101 348 352
W125 349 353
[image:36.612.194.437.68.331.2]W136 346 352
Figure 2.1. Steady-state fluorescence spectra of NATA (inset), W4 (top-left panel),
W39 protein exhibits the smallest quantum yield, suggesting that this residue is located closest to the surface of the SUV.
Using SUVs containing brominated lipids, distances between Trp and bromine quencher can be extrapolated empirically according to the degree of quenching by the bromine atoms.24 W39 shows modest amount of quenching (< 10%) in the presence of the heavy atoms (Table 2.2), indicating that the tryptophan residue is at least > 14 Å away from both sites (6,7- and 11,12-DiBr, structures are shown in Figure 1.2). In contrast, nearly complete quenching (> 90% with 6,7- and ~ 40% with 11,12-Di-Br) is observed for the N-terminal W4, indicating that this indole is the most deeply inserted side-chain amongst the fluorophores.
For the C-terminal mutants, only 6,7-DiBr SUVs were examined because W101 and W136 showed minor quenching (< 10%) in the presence of the brominated lipids, while W125 fluorescence is unaffected. This agrees closely to previously published data that suggest that the C-terminal fragment is not involved in membrane binding.11-14,25,26 However, our results reveal that W101 and W136 may be located closer to the membrane than W125.
F/F0 Trp-Br Distance (Å) τ/τ0
W4 25 % 6,7-DiBr 0.1 6 0.1
25 % 11,12-DiBr 0.6 11 0.2
W39 25 % 6,7-DiBr 0.8 > 14 0.9
25 % 11,12-DiBr 0.9 > 14 1.0
W94 25 % 6,7-DiBr 0.6 11 0.2
25 % 11,12-DiBr 0.7 14 0.4
W101 25 % 6,7-DiBr 0.9 > 14 0.8
W125 25 % 6,7-DiBr 1.0 > 14 0.9
W136 25 % 6,7-DiBr 0.9 > 14 0.9
Table 2.2. Ratios of unquenched emission (F/F0), and
measurements were required to assess the Trp→DNP quenching.
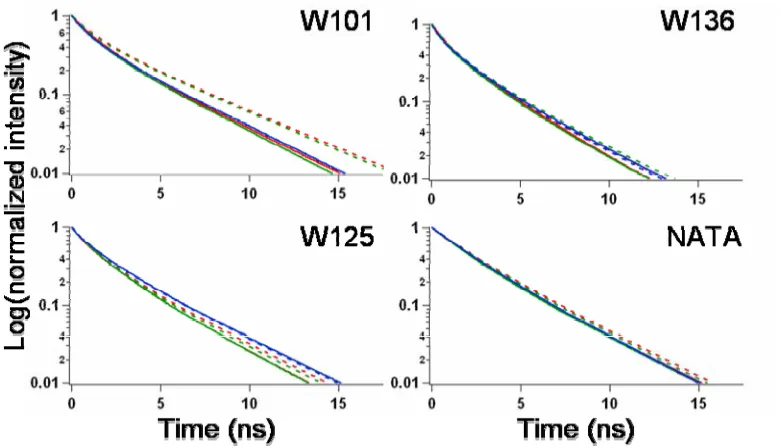
Time-resolved Fluorescence Kinetics.
To probe for phospholipid-protein interactions, Trp fluorescence decay kinetics were examined in the presence of 1:1 POPC:POPA vesicles (Figure 2.2). The fits extracted from non-negative linear least-squares (NNLS) analysis show that there are two dominant components, 3 x 10⁻⁹ s–1 (60%) and 1 x 10⁻⁹ s–1 (40%), for NATA in buffer. Indeed, all the α-syn mutants investigated show similar
biexponential decays in the presence or absence of 1:1 POPC:POPA (Figure 2.3 and Figure 2.4).
Again, SUVs containing brominated lipids were used to determine the
position of Trps when folded into the vesicles. The FET kinetics data were collected and fitted using the NNLS method (Figure 2.5 and 2.6). The degree of quenching (Table 2.1) can be evaluated by the quenched-to-unquenched ratio (τ/τ0) of the Trp lifetimes. Conclusions on the relative location of Trps when inserted into the SUVs are similar to the predictions drawn from the steady state fluorescence studies.
Fitting the FET kinetics data in the presence of 10% DNP SUVs using the NNLS method can reveal the locations of tryptophan residues with respect to the surface of the vesicle. The appearance of ultra-fast lifetimes (< 0.1 ns) corresponds to energy transfer to the dinitrophenol group. The Förster distance between Trp-DNP is calculated to be 27.5 Å. The data indicate that W39 contains the highest
Figure 2.2. Time-resolved fluorescent kinetics of W4 (top left), W39 (top right),
W94 (middle left), W101 (middle right), W125 (bottom left), and W136 (bottom right)
Figure 2.3. Distributions of tryptophan decay rate constants (k) for W4 (top), W39
Figure 2.4. Distributions of tryptophan decay rate constants (k) for W101 (top),
Figure 2.5. Distributions of tryptophan decay rate constants (k) for W4 (top), W39
Figure 2.6. Distributions of tryptophan decay rate constants (k) for W101(top),
Figure 2.7. Distributions of tryptophan decay rate constants (k) for W4 (top left),
W39 is located closest to the surface of the SUV. Notably, W4 is also the farthest away from the surface of the membrane when the protein associated with the phospholipid bilayer. Similarly, time-resolved fluorescence data obtained with brominated lipids gave the same order of proximity (W39 > W94 > W4) to the hydrocarbon core of the bilayer.
Similar experiments were performed on the C-terminal tail mutants, and the results were compared to the N-terminal tail mutants (Figure 2.7). The ultra-fast lifetimes observed for the N-terminal tail mutants were not present in the C-terminal tail positions, suggesting that these residues are not inserted in the interfacial region. However, the population of fast decay component (~ 1 x 10⁻⁹ s–1) does increase, where W101 exhibits a sizable amplitude (41%) when it is associated with 10% DNP SUVs, suggesting that although it is not directly associated in the polar headgroup region, it is in close proximity to the surface (d ~ 30 Å). On the contrary, W136 shows considerably much less quenching in the ultra-fast population (14%), while W125 shows a negligible amount of quenching (2%). Along with the steady-state fluorescence results, we can deduce that W101 is located closest to the membrane surface, followed by W136 and W125.
Fluorescence Anisotropy Decay Kinetics.
Fluorescence anisotropy decay measurements were employed to characterize the Trp microenvironments and gain better understanding on the structural
(a)
(b)
Figure 2.8. (a) Anisotropy decay for W4 (blue), W39 (black), and W94 (red) in 1:1
presence of 1:1 POPC:POPA SUVs. Rotation correlation times (θ) were extracted from the anisotropy decays. Since rotation correlation times are related to the size and flexibility of the molecule, it is possible to draw conclusions regarding how embedded the Trp residues are in the membrane.
When α-syn is in solution, all Trp mutants demonstrate small rotation
correlation times (θ ~ 1–2.5 ns). In association of SUVs, W4 has the highest rotation correlation time (θ ~ 8.3 ns). On the other hand, W39 and W94 are nearly identical θs (3.4 ns for W39 and 3.2 ns for W94). Among the C-terminal tail tryptophans, W101 has the slowest correlation time (θ ~ 2.3 ns), followed by W136 (θ ~ 1.4 ns) and W125 (θ ~ 1.1 ns). The rotation correlation times for these three mutants in solution and in vesicles show minimal increases, implying minimal insertion into the bilayer. The longest θ from W4 suggests that it is the most inserted into the membrane among the six mutants studied, followed by W94 and W39.
Other than comparing θs, anisotropy at time zero (r0) can also be utilized to illustrate the degree of insertion of a Trp. In previous studies, it has been
Clearly, the C-terminal Trp residues are much more flexible than the ones near the N-terminal sites. Unexpectedly, not all the C-terminal Trp data are
equivalent. Our data suggest that the whole C-terminal tail is not free from influence from the membrane; in particular, in the vicinity of W101, likely through the
anchoring at position 94, there is a measurable increase in local environment viscosity and polypeptide rigidity. The overall conclusions drawn from the fluorescence anisotropy measurements agree with the data collected from the other studies we performed, but differences were revealed amongst the C-terminal sites, especially in W101.
α-Syn Structure in Association with SUVs.
In summary, we can propose the following phospholipid-protein interactions illustrated in Figure 2.9. W39 is positioned near the surface of the SUVs, while W4 is the most inserted into the lipid bilayer among the six α-syn mutants investigated. W94 is shown to be inserted into the lipid bilayer, implying that the whole NAC region and the N-terminus participate in the α-helical structure when the protein is associated with acidic SUVs.
Since tyrosine and tryptophan both possess highly hydrophobic and
Y39 is the cause for the presence of the short linker when α-syn is associated with the membrane mimics.11
While the N-terminus forms a helical structure across the surface of the membrane, the C-terminal tail has been suggested to remain unstructured in the presence of acidic SUVs. Although we do agree that the C-terminal tail is not inserted in nor tightly associated to the lipid bilayer, our data suggest the possibility that W101 is in close proximity to the membrane surface and exhibits limited
mobility compared to the rest of the C-terminus. This observation can be attributed to the residue being in proximity to the highly helical region.
Interestingly, we also have demonstrated that W136 has a closer interaction with the lipid bilayer than W125. It has been suggested by previous work that α-syn may possess nonrandom structure in solution.2,3,5-7,29 Therefore, it is highly likely that the far end of the C-terminus of α-syn also has some propensity to interact closer to the membrane in the presence of acidic SUVs.
Positions for W4 and W94 when α-syn is associated with SUVs were not characterized by Langen et al. in their EPR study. They have concluded that α-syn forms three helical turns for every eleven amino acids in the region where there are seven imperfect repeats. Continuing this trend, we can postulate that W4 should be lipid exposed and W94 should be solvent exposed. Although our experimental results show that W4 is embedded into the SUV, W94 is not solvent exposed. This
demonstrates that the helical property of α-syn may be contained outside of the 11-residue repeat region. On the other hand, the discrepancy observed for W94 can be attributed to the fact that the binding pattern of α-syn with membranes after residue 89 is not as structured as the repeat region.
These studies have provided additional structural insights on the folded membrane bound α-syn and serve as a foundation for future investigations. More spectroscopic studies, such as fluorescence energy transfer and dynamic contact quenching, will be employed to provide information on heterogeneous distance distributions and tertiary contacts formed in the protein, respectively.
2.5 ACKNOWLEDGEMENTS
This work was completed with Dr. Jennifer Lee’s guidance.
2.6 REFERENCES
(1) Weinreb, P. H.; Zhen, W. G.; Poon, A. W.; Conway, K. A.; Lansbury, P. T. Biochemistry 1996, 35, 13709–13715.
(3) Lee, J. C.; Gray, H. B.; Winkler, J. R. J. Am. Chem. Soc. 2005, 127, 16388– 16389.
(4) Lee, J. C.; Langen, R.; Hummel, P. A.; Gray, H. B.; Winkler, J. R. Proc. Natl. Acad. Sci. U. S. A. 2004, 101, 16466–16471.
(5) Lee, J. C.; Lai, B. T.; Kozak, J. J.; Gray, H. B.; Winkler, J. R. J. Phys. Chem. B 2007, 111, 2107–2112.
(6) Dedmon, M. M.; Lindorff-Larsen, K.; Christodoulou, J.; Vendruscolo, M.; Dobson, C. M. J. Am. Chem. Soc. 2005, 127, 476–477.
(7) Bernado, P.; Bertoncini, C. W.; Griesinger, C.; Zweckstetter, M.; Blackledge, M. J. Am. Chem. Soc. 2005, 127, 17968–17969.
(8) Conway, K. A.; Harper, J. D.; Lansbury, P. T. Biochemistry 2000, 39, 2552– 2563.
(9) Davidson, W. S.; Jonas, A.; Clayton, D. F.; George, J. M. J. Biol. Chem. 1998, 273, 9443–9449.
(10) Eliezer, D.; Kutluay, E.; Bussell, R.; Browne, G. J. Mol. Biol. 2001, 307, 1061–1073.
(11) Bussell, R.; Eliezer, D. J. Mol. Biol. 2003, 329, 763–778.
(12) Chandra, S.; Chen, X. C.; Rizo, J.; Jahn, R.; Sudhof, T. C. J. Biol. Chem. 2003, 278, 15313–15318.
(13) Ramakrishnan, M.; Jensen, P. H.; Marsh, D. Biochemistry 2003, 42, 12919– 12926.
(14) Jao, C. C.; Der-Sarkissian, A.; Chen, J.; Langen, R. Proc. Natl. Acad. Sci. U. S. A. 2004, 101, 8331–8336.
(15) Ulmer, T. S.; Bax, A.; Cole, N. B.; Nussbaum, R. L. J. Biol. Chem. 2005, 280, 9595–9603.
(16) Kim, J. E.; Arjara, G.; Richards, J. H.; Gray, H. B.; Winkler, J. R. J. Phys. Chem. B 2006, 110, 17656–17662.
(17) McIntosh, T. J.; Holloway, P. W. Biochemistry 1987, 26, 1783–1788. (18) Jakes, R.; Spillantini, M. G.; Goedert, M. FEBS Letters 1994, 345, 27–32. (19) Winkler, G. R.; Harkins, S. B.; Lee, J. C.; Gray, H. B. J. Phys. Chem. B 2006,
110, 7058–7061.
(20) Reshetnyak, Y. K.; Koshevnik, Y.; Burstein, E. A. Biophys. J. 2001, 81, 1735–1758.
(21) Kleinschmidt, J. H.; den Blaauwen, T.; Driessen, A. J. M.; Tamm, L. K. Biochemistry 1999, 38, 5006–5016.
(22) Doring, K.; Konermann, L.; Surrey, T.; Jahnig, F. Eur. Biophys. J. 1995, 23, 423–432.
(23) Surrey, T.; Jahnig, F. Proc. Natl. Acad. Sci. U. S. A. 1992, 89, 7457–7461. (24) Bolen, E. J.; Holloway, P. W. Biochemistry 1990, 29, 9638–9643.
(25) Narayanan, V.; Scarlata, S. Biochemistry 2001, 40, 9927–9934. (26) Lee, H. J.; Choi, C.; Lee, S. J. J. Biol. Chem. 2002, 277, 671–678.
(27) Jonas, A.; Privat, J. P.; Wahl, P.; Osborne, J. C. Biochemistry 1982, 21, 6205– 6211.
Chapter 3
3.1 ABSTRACT
A hallmark of Parkinson’s disease is the presence of fibrillar protein deposits in the brain, composed mostly of α-synuclein. Although its function is unknown, α -synuclein is found to associate with synaptic vesicles. Interestingly, α-synuclein appears to be natively unfolded in vitro. However, in the presence of membrane mimics, such as SDS micelles and acidic phospholipid vesicles, α-synuclein adopts a highly helical conformation. We have characterized the structures of α-synuclein variants, incorporated with tryptophan and 3-nitrotyrosine as donor and energy acceptor pairs, in the presence of SDS micelles and small unilammelar vesicles by time-resolved fluorescence energy-transfer measurements. Distance distributions extracted from these data provide site-specific information on the protein
3.2 INTRODUCTION
Previously, Ulmer et al. have employed NMR to characterize the structure of
α-syn in the presence of SDS micelles.1 The 20 lowest conformations of the structure (PDB file: 1XQ8) demonstrated that α-syn forms two helices, residues 3-37 (referred to as the N-terminal helix) and residues 45-92 (referred to as the C-terminal helix). These two helices are arranged in an antiparallel fashion and joined by a linker consisting of residues 38 through 44. The highly acidic C-terminal tail remains unstructured.
On the other hand, Langen et al. have investigated the structure of α-syn in the presence of acidic small unilammelar vesicles (SUVs) using EPR.2 They concluded that residues 8 to 89 arrange themselves into three helices every 11 amino acids (α11/3 helices). They have also observed the formation of the motif of two helices and a linker. However, the helices do not arrange themselves in an antiparallel fashion.
SDS micelles have been typically estimated to have a circumference of 15 nm,3 while the SUVs used for this study are approximately ten times larger in surface area. Since micelles are much smaller in size compared to SUVs, it was suggested by Bussell et al. that α-syn must adopt a more compact structure when it is associated with micelles.4 They also reported that α-syn forms α11/3 helices in the presence of micelles and SUVs.
donor-acceptor (D-A) distances,5 it is possible to extract probability distributions of D-A distances from the fluorescence decay kinetics.6-9 Fluorescent donor and energy acceptor chosen for this study were the fluorescent amino acid tryptophan (Trp) and a chemically modified tyrosine (Tyr), 3-nitrotyrosine [Y(NO2)], respectively. This D-A pair has a Förster distance of 26 Å,10 with a maximum extractable distance of 40 Å.
Six D-A pairs have been placed in strategic positions to probe the behavior of
α-syn in sodium phosphate (NaPi) buffer, SDS micelles, and acidic SUVs. The positions of the mutations have been highlighted in Figure 3.1.11 W4/Y19(NO2) and Y19(NO2)/W39 were engineered to examine the N-terminal helix, while
3.3 METHODS
Protein Preparation, Modification, and Characterization.
A single Trp mutation was introduced in three various positions to replace an aromatic amino acid (F4, Y39, and F94) by site-directed mutagenesis. Except for Y39/W94, where three of the four native tyrosines were mutated into phenylalanines, all four tyrosines were mutated to phenylalanines, and an additional tyrosine residue was introduced in four various positions (A19, V55, V74, and F94). All the
sequences were confirmed by DNA sequencing (California Institute of Technology DNA Sequencing Core Facility). Expression and purification of mutants were achieved by following protocols outlined in Chapter 1.
Preparation of Membrane Mimics.
SDS micelles and SUVs were fabricated according to procedures located in Chapter 1. SUVs were made from a 1:1 molar mixture of lipids, phosphocholine (POPC), and 1-palmitoyl-2-oleoyl-sn-glycero-3-phosphate (POPA), following published protocols.12 The SUVs were characterized by dynamic light scattering.
Dynamic Light Scattering.
Inc., Bellingham, MA). The DLS sample was illuminated with a diode laser operating at 658 nm at a scattering angle of 90°. The radii populations were extrapolated from the collected correlation functions by Precision Deconvolve32 software.
Spectroscopic Measurements.
Prior to preparing samples for measurements, oligomeric materials in the concentrated protein stock were removed by filtration through Microcon YM-100 spin filter units (molecular weight cutoff 100 kD; Millipore). The protein samples were also exchanged into 20 mM NaPi buffer (pH 7.4). Protein samples (5 μM) were measured at 25 °C. For samples containing SDS micelles and 1:1 POPC:POPA SUVs, a final concentration of 31 mM micelles and 1.4 mg/mL of vesicles were achieved, respectively. Luminscence spectra and time-resolved fluorescence measurements were obtained by methods outlined in Chapter 1. The time-resolved fluorescent energy transfer kinetics were fitted using the NNLS practice.
3.4 RESULTS AND DISCUSSIONS
Dynamic Light Scattering.
Figure 3.2 shows the distance distribution extracted from the DLS correlation
Figure 3.2. The fitted spectra for DLS correlation function of 0.1 mg/mL of 1:1
vesicles are perfect spheres, the surface area of the vesicles is more than ten times larger than that of the micelles.
Trp fluorescence.
Trp was incorporated into all the mutants at three different sites (W4, W39, and W94). Trp emission is a useful probe to determine the local environment of Trp.13-16 Table 3.1 shows the fluorescence maxima of the Trp mutants and NATA, in NaPi buffer, SDS micelles, and 1:1 POPC:POPA vesicles. The results shown are similar to the fluorescence maxima reported in previously published work.17,18 It is shown that the fluorescence maxima in NaPi buffer are similar between NATA and all Trp mutants.
In the presence of SDS micelles, it is shown all three Trp emissions exhibit a prominent blue shift. This blue shift is indicative that the Trp residues are located in a more hydrophobic environment. Further blue shifts of the fluorescence maxima are only observed when W4 and W94 are introduced into SUVs. On the contrary, there is a slight red-shift in emission for W39 inserted into SUVs vs. micelles. The difference of Trp behavior between micelles and SUVs implies that different
λmax (nm)
20 mM NaPi SDS micelles 1:1 POPC:POPA
NATA 354 352 353
F4W 348 328 326
Y39W 348 338 340
F94W 351 338 335
Time-resolved fluorescence kinetics.
Since α-syn is unstructured in solution, most of the mutants are expected to have distances longer than 40 Å. Figure 3.3 to Figure 3.5 shows the D-A distance populations extrapolated from the time-resolved fluorescence energy-transfer kinetics when the α-syn mutants were in solution (top panel), 1:1 POPC:POPA SUVs (middle panel), and SDS micelles (bottom panel).
W4/Y19(NO2) and Y19(NO2)/W39 were mutants used to investigate the behavior of the N-terminal helix when α-syn was present in solution, SUVs, and
micelles. Figure 3.3a and 3.3b displays the distances extracted from the experiments. These figures suggest that the size of the N-terminal helix formed when α-syn is
associated with 1:1 POPC:POPA and with SDS micelles are comparable.
W4/Y19(NO2) has a population of intermediate polypeptides with distance of 24 Å (~ 50%) in SUVs, compared to 23 Å (~ 50%) in micelles. Similar conclusions can be drawn for Y19(NO2)/W39 (23 Å, 32% in SUVs vs. 21 Å, 44% in micelles).
The structure of the C-terminal helix was probed by introducing
Y39(NO2)/W94 and Y74(NO2)/W94. The D-A distances extracted (Figure 3.4a and 3.4b) show distance distributions of these mutants when they were in association with
(a)
(b)
Figure 3.3. D-A distance distributions extrapolated from FET kinetics for (a)
(c)
(d)
Figure 3.4. D-A distance distributions extrapolated from FET kinetics for (c)
When comparing the previously published structures of α-syn as associated with SUVs and micelles, the most prominent difference is the arrangement of the two helices. A turn region between residues 38 and 45 brings the two helices in
antiparallel arrangement when α-syn is associated with SDS micelles. However, while the linker between the two helices was observed, the helices of α-syn were not brought closer together in the presence of SUVs. Therefore, W4/Y94(NO2) and W39/Y55(NO2) were introduced to investigate whether the two helices were brought together in antiparallel fashion.
The W4/Y94(NO2) mutant is expected to have long D-A distances in NaPi buffer and SUVs, while the antiparallel motif of the helices should provide a much shorter D-A distance when this α-syn mutant is present in SDS micelles. For
W39/Y55(NO2), W39 is located at the end of the N-terminal helix while Y55(NO2) is located ten residues from the beginning of the C-terminal helix. Therefore, the D-A distances should be the shortest when the mutant is associated with SDS micelles, followed by SUVs and solution.
Figure 3.5a shows that the extracted distance ensembles confirm this
For the W39/Y55(NO2) mutant (Figure 3.5b), the ensemble of D-A distances for the micelle-associated structure consists of short (15 Å, 18%), intermediate (21 Å, 44%) and extended (> 40 Å, 38%) polypeptides. The majority of the extracted distances belong to the intermediate polypeptides, agreeing with the proposed distances by NMR micellear structure. On the other hand, the SUV associated structure has a population of short (18 Å, ~ 11%), intermediate (28 Å, ~57%) and extended (> 40 Å, 32%) polypeptides. This above implies that a more compact structure at the turn region is formed when α-syn is associated with micelles than with SUVs, hence matching our prediction. Interestingly, the longest polypeptide
(e)
(f)
Figure 3.5. D-A distance distributions extrapolated from FET kinetics for (e)
In conclusion, our results suggest that the linker brings the helices into close proximity when α-syn is in association with SDS micelles. When 1:1 POPC:POPA SUVs were introduced, this phenomenon was not observed. It is also noted that the C-terminal helix is tighter than the N-terminal helix when SDS micelles are present. The opposite phenomenon was observed when SUVs were added. A plausible explanation is that the C-terminal helix has more amino acids (48 residues) to fit into limited spaces than the N-terminal helix (35 residues). Therefore, in small membrane mimics, like SDS micelles, α-syn must create a tighter C-terminal helix for steric purposes. While in association with larger membrane mimics, namely 1:1
POPC:POPA, sterics are no longer an issue and therefore, the C-terminal helix can be relatively relaxed.
3.5 ACKNOWLEDGEMENTS
This work was completed in collaboration with Dr. Jennifer C. Lee.
3.6 REFERENCES
(1) Ulmer, T. S.; Bax, A.; Cole, N. B.; Nussbaum, R. L. J. Biol. Chem. 2005, 280, 9595–9603.
(2) Jao, C. C.; Der-Sarkissian, A.; Chen, J.; Langen, R. Proc. Natl. Acad. Sci. U. S. A. 2004, 101, 8331–8336.
(3) Gennis, R. B. Biomembranes: Molecular Structure and Function; Springer: New York, 1989.
(4) Bussell, R.; Eliezer, D. J. Mol. Biol. 2003, 329, 763–778. (5) Forster, T. Ann. Phys.-Berlin 1948, 2, 55–75.
(6) Beechem, J. M.; Haas, E. Biophys. J. 1989, 55, 1225–1236.
(8) Lyubovitsky, J. G.; Gray, H. B.; Winkler, J. R. J. Am. Chem. Soc. 2002, 124, 14840–14841.
(9) Lee, J. C.; Engman, K. C.; Tezcan, F. A.; Gray, H. B.; Winkler, J. R. Proc. Natl. Acad. Sci. U. S. A. 2002, 99, 14778–14782.
(10) Wu, P. G.; Brand, L. Anal. Biochem. 1994, 218, 1–13.
(11) DeLano, W. L. The PyMOL User's Manual; Palo Alto, CA. 2002.
(12) Kim, J. E.; Arjara, G.; Richards, J. H.; Gray, H. B.; Winkler, J. R. J. Phys. Chem. B 2006, 110, 17656–17662.
(13) Reshetnyak, Y. K.; Koshevnik, Y.; Burstein, E. A. Biophys. J. 2001, 81, 1735–1758.
(14) Kleinschmidt, J. H.; den Blaauwen, T.; Driessen, A. J. M.; Tamm, L. K. Biochemistry 1999, 38, 5006–5016.
(15) Doring, K.; Konermann, L.; Surrey, T.; Jahnig, F. Eur. Biophys. J. 1995, 23, 423–432.
(16) Surrey, T.; Jahnig, F. Proc. Natl. Acad. Sci. U. S. A. 1992, 89, 7457–7461. (17) Lee, J. C.; Lai, B. T.; Kozak, J. J.; Gray, H. B.; Winkler, J. R. J. Phys. Chem.
B 2007, 111, 2107–2112.
Chapter 4
4.1 ABSTRACT
A feature of Parkinson's disease is the presence of fibrillar protein deposits composed mostly of α-synuclein and calcium ions in the substantia nigra region of the brain. Although α-synuclein is natively unfolded, the N-terminal region of the protein is highly helical in the presence of membrane mimics, such as acidic phospholipid vesicles. It has been postulated that calcium ions bind to the acidic C-terminal tail of α-synuclein. We have incorporated three tryptophan variants (W101, W125, and W136) in that region and investigated the interactions between the phospholipid vesicles and calcium ions by steady-state and time-resolved
fluorescence spectroscopy. We have also prepared seven mutants (W94/Y113(NO2), W94/Y125(NO2), W94/Y136(NO2), W101/Y74(NO2), W101/Y125(NO2),
4.2 INTRODUCTION
α-Syn is a 140-residue protein with unknown function.1 The protein is commonly classified into three regions. The C-terminal domain consists of residues 96–140. This region has been noted by the large number of acidic residues (10 Glus and 5 Asps) and its ability to bind to calcium ions,2,3 copper ions,4 microtubule-associated proteins 1B,5 and polyamines.6
The C-terminal domain has been demonstrated to be multi-functional and is strongly related to the aggregation properties of α-syn. It is responsible for the protein’s stability at high temperature,7 acts as a solubilizing domain for chaperone function,8-11 and prevents aggregation. It has been previously shown that α-syn with a truncated C-terminal tail has a tendency to aggregate at a faster rate.12-14
Post-translational modifications of some C-terminal tail residues can also change the susceptibility for α-syn to aggregate.15,16 Although the C-terminal tail is responsible for mediating aggregation, it is structurally found on the surface of the fibrils, rather than being incorporated into the core.17-19
In the presence of membrane mimics, such as SDS micelles and acidic SUVs, the N-terminal portion of α-syn becomes highly helical, while the C-terminal tail has been shown to remain largely unstructured. De Laureto et al. have previously studied the influence of calcium ions on the structure of the C-terminal tail α-syn by
proteolysis.26 They have observed that, in the presence of calcium ions, thermolysin, proteinase K, and Glu-specific V8-protease can degrade α-syn into various small fragments in solution. However, in the presence of 10 mM SDS micelles,
fragmentation sites were only identified at the C-terminal end of residues 111, 113, and 123. This result illustrates that the C-terminal tail can be made rigid by the presence of membrane mimics.
Separately, Tamamizu-Kato et al. introduced a pyrene fluorophore onto residue 125 of α-syn.20 They have observed an increase in the band III fluorescence emission upon addition of calcium ions, thus suggesting that there is increased interaction between residue 125 and the membrane. It has been proposed that the N-terminal domain and lipids first interact with each other, then the C-N-terminal tail is associated with the lipid bilayer triggered by the addition of calcium ions.
In this study, we first investigated whether the C-terminal tail of α-syn binds to the surface of SUVs in the presence of calcium ions by steady-state and time-resolved fluorescence spectroscopy. Single Trp mutants (W101, W125, and W136) were employed as a fluorescent probe and represent different regions of the C-terminal tail. Phospholipids containing heavy-atom (Br) and energy-transfer
Time-resolved fluorescent energy-transfer (FET) was then used to probe the structural changes in the C-terminal tail of α-syn in solution and acidic SUVs upon the addition of calcium ions. Since fluorescent donor-acceptor (D-A) distance is inversely proportional to the FET rate,28 probability distribution of D-A distances can be extracted.27,29-33 Seven α-syn mutants have been expressed with D-A placed along various parts of the C-terminal tail to further probe behavior in the presence of SUVs and calcium ions.
The fluorescent amino acid tryptophan (Trp) has been chosen as the fluorescent donor for this study. A chemically modified tyrosine, 3-nitrotyrosine [Tyr(NO2)], was utilized as an energy acceptor. The Förster distance for this D-A pair is 26 Å.34 The N-terminal and C-terminal interface was probed by
Y74(NO2)/W101, W94/Y113(NO2). The whole C-terminal tail was characterized by W94/Y125(NO2), W94/Y136(NO2), W101/Y125(NO2), W101/Y136(NO2). The extreme C-terminal end of the protein was studied by W125/Y136(NO2).
It is also our interest to study the effect of calcium ions on the tertiary contact formation of the C-terminal tail of α-syn. Photoinduced electron transfer (ET) from the triplet excited state of tryptophan to 3-nitrotyrosine can be measured to determine the contact formation in various environments.35,36 Time-resolved absorption
4.3 METHODS
Protein Expression, Modification, and Purification.
The plasmid of wild-type α-syn was provided by M. Goedert 37. For the single Trp studies, site-directed mutagenesis was employed to introduce Trp in five different sites (W4, W94, W101, W125, and W136). For studies involving Trp as a donor and Tyr as an acceptor, a single Trp was mutated into the sequence (W101, W125, and W136). Extra Tyrs were also mutated away into Phes. One Tyr was introduced or remained in the sequence as the nitration site.
Expression, modification, purification, and nitration protocols have been adopted from Chapter 1. The purity of protein samples were evaluated by SDS-PAGE on a Pharmacia Phastsystem (Amersham Biosciences) and mass spectrometry (California Institute of Technology Protein/Peptide Microanalytical Laboratory).
SUVs Fabrication.
Quencher-free SUVs were made with 1:1 molar mixture of two lipids, namely sn-glycero-3-phosphocholine (POPC) and palmitoyl-2-oleoyl-sn-glycero-3-phosphate (POPA). For SUVs containing brominated lipids,
used to fabricate SUVs with a quencher installed at the head group. A molar ratio of 4:5:1 POPC:POPA:DNP was achieved in these SUVs.
SUVs were fabricated following protocol in Chapter 1. Lipid solutions were dried under a stream of Ar for 5 min and under vacuum for 30 min. Dried lipids were suspended in 10 mM HEPES (pH 7.4) at a concentration of 5 mg/mL. The lipid solution was then sonicated by a Branson ultrasonicator microtip (Plainview, NJ) for 30 min at 50% duty cycle (200 W). The sonicated SUVs were then diluted with HEPES to yield a final concentration of 2 mg/mL and equilibrated at room
temperature overnight. However, for ET experiments, lipid solutions were sonicated and equilibrated at 10 mg/mL. The SUV solution was then centrifuged at 10,000 × g for 10 min to remove titanium dust and particulates. Freshly prepared SUVs were used for all experiments.
Sample Preparation and Steady-state Fluorescence Experiments.
Sample preparation and data processing procedures for fluorescence studies have been described in Chapter 1, except all protein samples were exchanged into 10 mM HEPES (pH 7.4). All experimental samples contained 5 μM protein with 1.4 mg/mL SUVs. However, for ET experiments, 15 μM protein with 4.2 mg/mL SUVs was used. Calcium ions were supplied by CaCl2.
Time-resolved Absorption Experiment.
sample. 3W* was generated by exciting the sample with the second harmonic (290 nm) of a nanosecond Nd:YAG pumped optical parametric oscillator laser (Spectra-Physics). An Ar-ion laser (457.9 nm) was used as a source of probe light. The sensitivity of our measurements was improved by passing the probe light through the sample multiple times, thus increasing the path length from 1 to 7 cm. Transient absorption kinetics were detected by a photodiode and recorded using an 8-bit, 500-MHz digital oscilloscope (LeCroy 9354A).
For data analysis, the traces were transformed to absorbance changes [-log10(Isample/Ireference)]. They were then logarithmically compressed (100 points per decade) and normalized [OD(t) - OD(t∞)/OD(t0) - OD(t∞)]. The adjusted traces were
then fitted with NNLS.
4.4 DISCUSSIONS AND CONCLUSIONS.
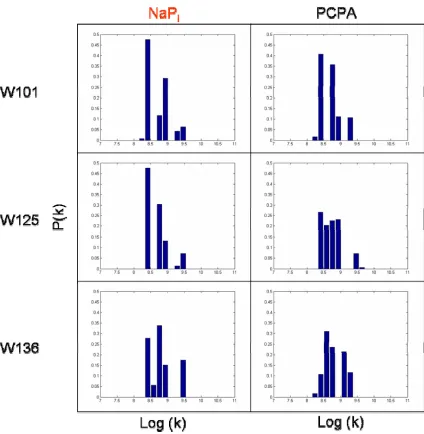
Calcium Ion Titration Curve.
To determine the amount of calcium ions needed to induce structural formation, steady-state fluorescence spectra of single Trp mutants at different
Figure 4.1a shows the integrated intensities of the three Trps (Trp101, Trp125,
and Trp136) and the tryptophan analog, NATA, in the presence of various calcium ion concentrations and SUVs. It is demonstrated that the integrated intensities remain relatively unchanged for W125, W136, and NATA between 0 - 1 mM of calcium ions. On the other hand, a steady increase of fluorescence intensity was observed as more calcium ions were added to the W101 sample, with the intensity reaching a steady maximum around 1 mM. This experiment implies that only Trp101 became more closely associated with the lipid bilayer when 1 mM calcium ions were added in the presence of SUVs. Adding more calcium ions yielded no changes to all three mutants studied, along with NATA (data not shown).
Similar calcium ion titration experiments were performed in the presence of SUVs. Figure 4.1b shows that the integrated fluorescence intensities for all three Trps and NATA remained largely unchanged when 1 mM calcium ions were added. Although this experiment shows that the Trps will remain in similar environments when calcium ions are added in the presence of SUVs, it is unclear whether the C-terminal tail binds to any calcium ions.
Time-resolved Fluorescent Lifetime Studies.
(a)
[image:82.612.111.511.141.630.2](b)
Figure 4.1. Integrated fluorescence intensity between 325 nm and 500 nm of W101
absence (solid traces) of calcium ions. W125 and W136 show time-resolved
fluorescent decay comparable to NATA in the various environments described above. Although W101 shows similar time-resolved fluorescent lifetimes in the absence of calcium ions, there is an increase in lifetimes when calcium ions are added into samples containing 1:1 POPC:POPA SUVs. The extended fluorescent lifetimes indicate that the Trp has displayed a higher quantum yield, thus implying that the Trp is in a more hydrophobic environment, such as the lipid bilayer. This experimental result demonstrates that W101 is more associated with the membrane in the presence both SUVs and calcium ions, but not W125 and W136.
We have previously employed SUVs incorporated with heavy atom (Br) and energy transfer (dinitrophenol) quenchers to predict the specific location of Trps when α-syn is folded into the membrane.29,44 Again, we used the brominated lipid DiBr, where the quencher Br atoms are 9 Å away from the headgroup.45 On the other hand, the dinitrophenol (DNP) has its quencher located on the lipid headgroup. By determining the amount of quenching of α-syn mutants in these quencher-containing SUVs, it is possible to elucidate how deep the C-terminal tail is inserted into the lipid bilayer in the presence of calcium ions.
As suggested by Figure 4.2, the fluorescent lifetimes for W101 are
comparable when the α-syn mutant was placed in 1:1 POPC:POPA SUVs and DiBr SUVs. The lack of quenching by the brominated lipids implies that W101 was not inserted deeply into the membrane.
resolved fluorescent kinetic traces were fitted using NNLS method, with special attention paid to the ultra-fast lifetimes (< 0.1 ns) related to the energy transfer from Trp to the dinitrophenol group. In our previous study, we have demonstrated that none of the C-terminal mutants have this ultra-fast lifetime component. However, based on the amplitude of the fast decay component (~ 1 x 10⁻⁹ s–1), Trp101 (38%) displays the highest population, followed by W136 (14%) then W125 (2%).
In this study, we focus on the populations of the fast lifetime components (> 1 x 10⁻⁹ s–1) of the Trp mutants in the presence of calcium ions and 10% DNP SUVs. If an increase of these fast lifetime components is observed, it can imply that calcium ions are mediating membrane association with the C-terminal tail region. Figure 4.3 shows that the change of amplitude for the fast lifetime components of NATA and W136 is minimal when calcium ions were introduced. This agrees with the time-resolved fluorescence data, suggesting that W136 does not become closely associated with the lipid bilayer upon the addition of calcium ions.
Figure 4.3. Distributions of tryptophan decay rate constants (k) for W101 (top left),