LEE, JAE JUN. Quantifying the Benefits of Improved Rolling of Chip Seals. (Under the direction of Dr. Y. Richard Kim).
This dissertation presents an improvement in the rolling protocol for chip seals based on an evaluation of aggregate retention performance and aggregate embedment depth. The flip-over test (FOT), Vialit test, modified sand circle test, digital image
by
Jaejun Lee
A dissertation submitted to the Graduate Faculty of North Carolina State University
in partial fulfillment of the requirements for the Degree of
Doctor of Philosophy
Civil Engineering Raleigh, North Carolina
2008 APPROVED BY:
_____________________________ Dr. Y. Richard Kim
Chair of Advisory Committee
_____________________________ Dr. Akhtarhusein A. Tayebali
_____________________________ Dr. Richard L. Lemaster
ii
DEDICATION
To My Family,
iii
BIOGRAPHY
Jae Jun Lee was born in Chonbuk, Korea on May 5, 1972, the son of Yoonhyoung Lee and Myoungsuk Choi. He received his Bachelor’s degree in Civil Engineering in 1997 from Chonbuk National University, Jeonju, Korea and Master’s degree in Civil Engineering in 1999 from Hanyang University, Seoul, Korea. During that time, he studied in structural materials (concrete). In May 1999, he was lucky to get married with Shin, Huieun, his lovely wife, with God’s blessing before his graduate study in abroad. In January of 2001, he began graduate studies at the City College of the City University of New York to pursue his second Master degree in Civil Engineering with a concentration in Structure Engineering. While he was studying there, he studied the concrete behavior at the early time with ultrasonic method. After graduated the CCNY, he enrolled to
iv
ACKNOWLEDGEMENTS
First of all, my genuine thanks and deep appreciation go to my advisor, Professor Y. Richard Kim, for his unfailing support and guidance during my doctoral program. He has been a continuous source of knowledge and encouragement. I was truly happy working with him and hope to continue doing so.
I do not know how to thank all my parents (mother: Myung-sook Choi, father-in-law: Moon-soon Shin, mother-in-father-in-law: Sook-hee Lee) enough for their unconditional love and support that allow me to finish my study in the United States. I thank my lovely wife Huieun Shin for her being sweet, patient, and kind all the times. Her encouragement made me feel energized whenever I was exhausted with school’s life. I will take care of you and support you until the end of my life. I love you.
I thank sisters and brothers-in-law who have always supported me to finish my study in the United States.
Also, I wish to thank the members of my dissertation committee members: Dr. Borden, Dr. Tayebali, and Dr. Lemaster, for their help and the time. They generously gave their time and expertise to better my work. I thank them for their contribution and their good natured support. I would like to acknowledge our alumni: Dr. Sug-joon Lee, Dr. Ju-Sang Lee and Dr. Ju-Sang-yum Lee help me to study asphalt at NC State. I express my deep gratitude to my fellow members: Chulmin Baek, Taeyoung Yoon, Shane Underwood, Andrew LaCroix, and Andrew Jerome.
v
TABLE OF CONTENTS
LIST OF TABLES ... ix
LIST OF FIGURES ... xi
1. Introduction ... 1
1.1 Research Needs and Significance ... 1
1.2 Research Objectives ... 2
1.3 Dissertation Organization ... 2
2. Literature Review ... 4
2.1 General ... 4
2.2 Adhesion between Aggregate and Emulsion ... 4
2.2.1 Factors Affecting the Adhesion ... 4
2.2.2 Emulsion Setting Behavior ... 5
2.3 Construction Factors of the Chip Seal ... 7
2.3.1 Roller Types ... 8
2.3.1.1 Pneumatic tire roller ... 8
2.3.1.2 Steel wheel roller ... 10
2.3.1.3 Rubber-coated steel drum roller ... 10
2.3.1.4 Combination roller ... 11
2.3.2 Number of Coverages ... 12
2.3.3 Rolling Pattern ... 12
2.4 Test of Chip Seal Performance ... 15
3. Experimental Test Program and Method ... 18
3.1 Experimental Program ... 18
3.2 Specimen Fabrication... 22
3.3 Materials ... 24
3.3.1 Material Selection ... 24
vi
3.3.3 Flakiness Index ... 24
3.4 Experimental Test Method ... 26
3.4.1 Vialit Test Procedure ... 26
3.4.2 Flip-Over Test ... 28
3.4.3 Ignition Oven Test ... 28
3.4.4 Embedment Depth ... 29
3.4.4.1 Sample preparation ... 29
3.4.4.2 Modified sand circle method ... 30
3.4.4.3 Calculation of loose unit mass of sand ... 30
3.4.4.4 Sand circle test procedure ... 31
3.4.5 MMLS 3 Performance Test Procedure ... 34
3.4.6 Digital Imaging of Cross-section of Epoxy-reinforced Asphalt Surface Treatment (AST) ... 37
4. Roller Types ... 38
4.1 Experimental Program ... 38
4.2 Sample Weight Variations ... 41
4.3 Test Results ... 43
4.3.1 Flip-Over Test ... 43
4.3.2 Vialit Test... 44
4.3.3 MMLS3 Test ... 46
4.3.4 Comprehensive Analysis ... 47
4.4 The Effect of Aggregate Shape with Roller Types ... 49
4.4.1 Experimental Program ... 50
4.4.2 Comparison Sample Variation with Statistical Analysis ... 51
4.4.3 Test Results ... 53
5. Optimal Number of Coverages ... 56
5.1 Experimental Program ... 56
5.2 Sample Weight Variations ... 57
vii
5.3.1 Ignition Oven Test and Determination of Aggregate Weight ... 60
5.3.2 Vialit Test... 62
5.3.3 Flip-Over Test ... 64
5.3.4 Embedment Depth of the Chip Seal ... 66
5.3.5 MMLS3 Test ... 68
5.3.6 Comprehensive Analysis ... 70
6. Coverage Distribution of Multilayers ... 73
6.1 Experimental Program ... 73
6.2 Split Seal Study ... 74
6.2.1 Split Seal Construction ... 74
6.2.2 Sample Weight Variations ... 75
6.2.3 Test Results ... 76
6.2.3.1 Ignition oven test for determination of aggregate weight ... 76
6.2.3.2 Flip-over test ... 78
6.2.3.3 Vialit test ... 80
6.2.3.4 MMLS3 test ... 81
6.2.3.5 Comprehensive analysis of split seal study ... 82
6.3 Triple Seal Study... 83
6.3.1 Triple Seal Construction ... 83
6.3.2 Sample Weight Variations ... 84
6.3.3 Test Results ... 85
6.3.3.1 Vialit test ... 85
6.3.3.2 Flip-over test ... 87
6.3.3.3 Determination of Stalite 5/16" weight ... 88
6.3.3.4 MMLS3 test ... 89
6.3.3.5 Comprehensive analysis of triple seal study ... 90
6.3.4 Results from the Digital Image Process ... 91
7. Rolling Patterns ... 97
viii
7.2 Rolling Patterns Using Two Combination Rollers ... 101
7.2.1 Sample Weight Variations: One Roller Type ... 101
7.2.2 Test Results ... 103
7.2.2.1 Flip-over test ... 103
7.2.2.2 Vialit test ... 104
7.2.2.3 MMLS3 test ... 104
7.2.2.4 Comprehensive analysis: using an one roller type ... 106
7.3 Rolling Patterns Using Two Types of Roller ... 107
7.3.1 Sample Weight Variations: Two Roller Types ... 107
7.3.2 Test Results ... 109
7.3.2.1 Flip-over test ... 109
7.3.2.2 Vialit test ... 109
7.3.2.3 MMLS3 test ... 110
7.3.2.4 Comprehensive analysis: using two roller types ... 112
7.4 Delayed Rolling Time ... 114
7.4.1 MMLS 3 Test Results ... 115
7.5 Comprehensive Analysis ... 120
8. Conclusions and Future Research Recommendations ... 128
ix
LIST OF TABLES
Table 3-1 Field Test Program ... 20
Table 3-2 Slot Size Required for Different Fractions (Mchattie 2001) ... 25
Table 3-3 Correction Factors for Each Type of Aggregate ... 28
Table 4-1 Results of Statistical Analysis of Sample Weights ... 42
Table 4-2 Results of ANOVA: Different Roller Types ... 47
Table 4-3 Summary of Average Percentage of Aggregate Loss ... 47
Table 4-4 Flakiness Indices of Aggregates Used in Different Phases ... 50
Table 4-5 Flakiness Indices of Two Aggregates Types ... 51
Table 4-6 Results of Statistical Analysis: Sample Weight ... 52
Table 4-7 Results of Statistical Analysis Using Stalite 5/16" ... 55
Table 5-1 Statistical Analysis Summary ... 58
Table 5-2 Summary of Average Percentage of Aggregate Loss and Embedment Depth ... 71
Table 5-3 Summary of Statistical Analysis Results ... 72
Table 6-1 Results of t-tests for Sample Weights ... 76
Table 6-2 Results of the t-test for the Coverage Distribution of the Split Seal ... 83
Table 6-3 Results of t-tests for Sample Weights ... 84
Table 6-4 Results of t-tests for Coverage Distributions of the Triple Seal ... 91
Table 6-5 Comparison of Aggregate Retention Test Results ... 92
Table 7-1 Results of t-tests for Sample Weights ... 102
Table 7-2 t-Test Results for Aggregate Retention Tests: Using One Roller Type ... 106
Table 7-3 Summary of Average Percentage of Aggregate Loss ... 107
Table 7-4 Statistical Analysis of Sample Weights ... 108
Table 7-5 Results of ANOVA: Percentage of Aggregate Loss ... 112
Table 7-6 Summary of Average Percentage of Aggregate Loss ... 112
Table 7-7 Delay Time between Aggregate Spreader and Rolling Time ... 113
x
xi
LIST OF FIGURES
Figure 2-1 Emulsifier ions forming micelles in a stable system (Transit New Zealand
1993) ... 6
Figure 2-2 Chip seal construction procedure ... 7
Figure 2-3 Pneumatic tire roller ... 9
Figure 2-4 Steel wheel roller ... 10
Figure 2-5 Combination roller, showing two axles ... 11
Figure 2-6 Illustration of echelon rolling pattern (Texas DOT 2004) ... 14
Figure 2-7 Rolling pattern and roller coverage for three and four pneumatic tire rollers (Gransberg et al. 2004) ... 14
Figure 3-1 Factors to be considered in chip seal compaction ... 19
Figure 3-2 Schematic diagram of three passes of one roller ... 19
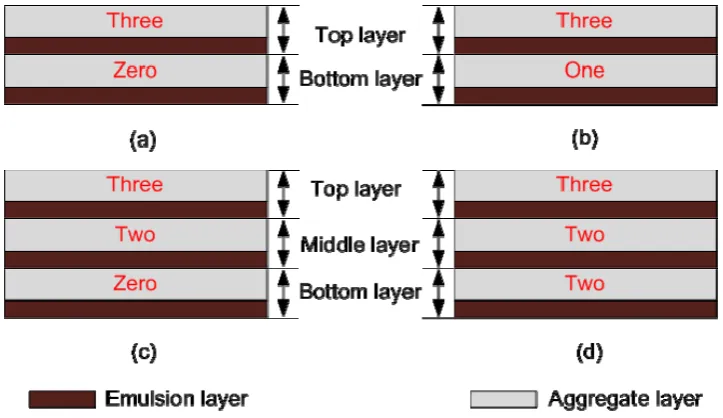
Figure 3-3 Distributed rolling coverage on each layer: (a) New Zealand practice for split seal; (b) NC practice for split seal; (c) a combination of New Zealand and NC practices for triple seal; (d) NC practice for triple seal ... 21
Figure 3-4 Sample fabrication procedure: (a) affixed felt disks on the existing pavement; (b) spraying emulsion; (c) spreading aggregate; (d) compacting with rollers; (e) gathering samples; (f) delivering samples to laboratory ... 23
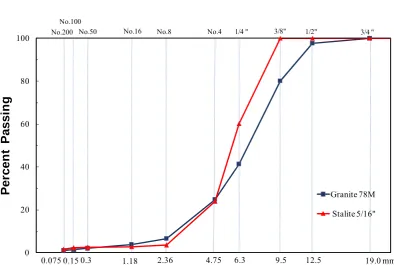
Figure 3-5 Aggregate particle size gradations ... 25
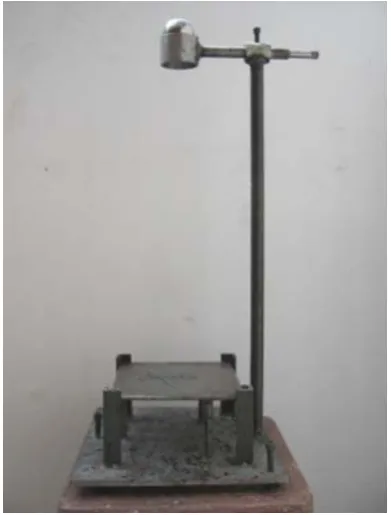
Figure 3-6 Flakiness Index plate gauge ... 26
Figure 3-7 Vialit test apparatus ... 27
Figure 3-8 Modified sand circle test procedure: (a) surface texture after emulsion is dissolved and eliminated; (b) ring on surface of specimen (c) poured sand in ring; (d) leveling off excess sand with a straightedge (e) excess sand removed from circle (f) excess sand cleaned from sample ... 33
xii
Figure 4-1 Schematic diagram for determination of optimal roller type ... 40
Figure 4-2 Aggregate distribution: S is steel wheel roller; C is combination roller; P is pneumatic tire roller ... 43
Figure 4-3 Aggregate loss of a straight seal obtained from FOT samples ... 44
Figure 4-4 Aggregate loss of a straight seal from Vialit test samples ... 45
Figure 4-5 Aggregate loss of a straight seal from MMLS3 samples ... 46
Figure 4-6 Uneven compaction under steel wheel roller ... 49
Figure 4-7 Aggregate gradation for straight seal construction ... 51
Figure 4-8 Distribution of sample weights from two sections: C is combination roller, P is pneumatic tire roller ... 53
Figure 4-9 Results of aggregate loss performance: C is combination roller; P is pneumatic tire roller ... 54
Figure 5-1 Schematic diagram of number of coverages ... 57
Figure 5-2 Mixture weight distributions of the straight seal ... 59
Figure 5-3 Mixture weight distributions of the split seal ... 60
Figure 5-4 Correlation between total aggregate weight and retained aggregate weight on 1/4" sieve for granite 78M aggregate ... 62
Figure 5-5 Average aggregate loss, determined from Vialit test ... 63
Figure 5-6 FOT results for the straight seal ... 65
Figure 5-7 FOT results for the split seal ... 66
Figure 5-8 Embedment depth of FOT and MMLS3 samples as a function of the number of coverages ... 68
Figure 5-9 Aggregate loss of the straight seal measured from the MMLS3 test after 12,940 wheel passes ... 69
Figure 5-10 Aggregate loss of the split seal measured from the MMLS3 test after 12,940 wheel passes ... 70
Figure 6-1 Schematic diagram of the coverage distribution per layer ... 73
Figure 6-2 Distribution of sample weights ... 75
xiii
Figure 6-4 Aggregate loss of a split seal from FOT samples ... 79
Figure 6-5 Aggregate loss of the split seal from Vialit test samples ... 80
Figure 6-6 Aggregate loss of a split seal from MMLS3 test samples ... 82
Figure 6-7 Distribution of the triple seal sample weights ... 85
Figure 6-8 Aggregate loss performance from the Vialit test ... 86
Figure 6-9 Aggregate loss from the FOT ... 87
Figure 6-10 Correlation between total mixture weight and mixture weight without top layer aggregate ... 89
Figure 6-11 Aggregate loss performance from MMLS 3 test ... 90
Figure 6-12 Digital image of triple seal cut surface ... 92
Figure 6-13 Profile of cutting surface of the triple seal ... 92
Figure 6-14 Illustration for the calculation of root mean square roughness Rq (Lemaster 2004) ... 94
Figure 6-15 Roughness of original multilayer seals ... 96
Figure 6-16 Roughness of multilayer seals without Stalite 5/16" ... 96
Figure 7-1 Schematic diagram of rolling patterns ... 100
Figure 7-2 Distribution of sample weights ... 102
Figure 7-3 Aggregate loss performance from the FOT ... 103
Figure 7-4 Aggregate loss performance from the Vialit test ... 105
Figure 7-5 Aggregate loss performance from MMLS3 testing ... 105
Figure 7-6 Distribution of mixture and aggregate weights ... 108
Figure 7-7 FOT aggregate loss performance ... 109
Figure 7-8 Aggregate loss of a straight seal from Vialit test ... 111
Figure 7-9 MMLS3 aggregate loss performance ... 111
Figure 7-10 Chip seal specimen fabrication procedure: (a) emulsion application gun; (b) applied CRS-2 on the felt disk; (c) applied aggregate on the emulsion by CHIPSS; (d) sample in the environmental chamber for the delayed rolling times; (e) hand steel compactor; (f) curing sample in the oven. ... 116
xiv
Figure 7-12 Aggregate loss results as a function of delayed rolling time using wet
aggregate (2% water content). ... 119 Figure 7-13 Average of aggregate loss results plotted against the condition of the
1
1.
INTRODUCTION
1.1
Research Needs and Significance
Chip seals have served as one of the most common preventive maintenance treatments for road surfaces in the United States over the past 75 years because they provide economical benefits to extend pavement life. The chip seal system includes design methods and means of construction to establish and successfully provide low and high volume loads (Gransberg et al. 2005).
The most common failures of the chip seal are bleeding or flushing and aggregate loss from the top layer. Generally, a significant amount of aggregate loss occurs soon after construction with the initial trafficking, and typically is caused by improper construction, inadequate chip seal design, and poor material selection (Transit New Zealand 2005). Therefore, the aggregate loss in the early life of the chip seal can be reduced by improving the construction procedures.
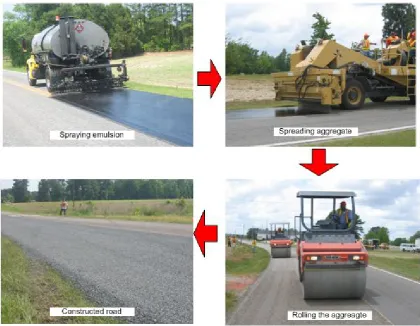
In general, chip seal construction procedures consist of three steps: spraying emulsion, spreading a layer of aggregate, and rolling the layer of aggregate. In order to ensure the best chip seal performance, these steps should be continuous without any interruption. That is, having an adequate initial rolling using a sufficient number of rollers is an important factor in extending the service life of the chip seal (South Africa 1986).
One of the areas in the chip seal construction procedure that needs to be improved is the rolling process. The purpose of rolling is to achieve the desired aggregate
embedment depth (which is the principal criterion in the chip seal design) by
2
To improve the current chip seal rolling practice, it is necessary to have an accurate picture of the current practice and to quantify the benefits of changes in the compaction protocol. In order to investigate the benefits of the rolling protocol, the
performance of aggregate retention, adhesion, and embedment of depth must be measured. The flip-over test (FOT) and the third-scale Model Mobile Loading Simulator (MMLS3) are employed to evaluate aggregate retention performance. Adhesion performance, according to different compaction operations, is estimated by the Vialit test. The
embedment depth of the chip seal, one of the most critical factors, is measured using the modified sand circle method. This research uses these tests and procedures to determine the optimal rolling protocol for the chip seal based on an evaluation of the various performance characteristics.
1.2
Research Objectives
The primary objectives of the research are: 1. to determine the optimal roller type;
2. to determine the optimal number of coverages;
3. to determine the optimal coverage distributions of the multilayer seal among the sublayers; and
4. to determine the optimal rolling pattern in order to conduct proper rolling the entire aggregate before the emulsion breaks.
1.3
Dissertation Organization
This dissertation is composed of eight chapters. Chapter 1 presents the research needs and objectives. Chapter 2 summarizes the literature review of chip seal aggregate retention performance test methods and the effects of various roller types and rolling patterns. Chapter 3 describes the physical characteristics of selected materials and
3
4
2.
LITERATURE REVIEW
2.1
General
The chip seal has a history of more than seventy years and is widely used by state Departments of Transportation (DOTs) in the United States and other countries for pavement preventive maintenance. The chip seal, also known as surface treatment, seal coat, or surface dressing, offers significant advantages, primarily as an economical and efficient means to provide skid resistance and fast construction. Crucial factors, such as traffic volume, the condition of the existing pavement, and a proper rolling operation, influence the performance and the service life of a chip seal. One of the principal factors is the rolling process that constitutes an important step in achieving a high quality chip seal. The roller presses the aggregate into the thin emulsion film to provide a uniform mosaic of aggregate. If the aggregate is not properly embedded into the emulsion film, chip seal failure may occur soon after construction due to traffic loading.
2.2
Adhesion between Aggregate and Emulsion
The adhesion of the emulsion to the aggregate in a chip seal system is strongly associated with the performance and service life of the chip seal.
2.2.1
Factors Affecting the Adhesion
5
absorption and mineralogy. The breaking and curing characteristics of the emulsion also affect the development of the bond.
Mathews (1958) explains factors that affect the adhesion, such as wetting the aggregate and the strength of the adhesive bond under both dry and wet conditions. Wetting the aggregate refers to covering the aggregate with the binder in the emulsion. The viscosity of the binder controls the maximum covered area on the aggregate surface. In a chip seal, the dustiness of the aggregate prevents adequate adhesion between the aggregate and the binder because of the inability of the binder to penetrate through the dusty layer. Thus, the aggregate should be wet and spread immediately after the emulsion is sprayed in the chip seal construction.
Emmanuel (1999) studied the phenomenon of breaking the mechanism in the emulsion using an abrasion cohesion test method. He found it possible to quantitatively evaluate the rate of cohesion recovery of aggregates in a chip seal.
Khalid (2000) researched the correlation between aggregate retention found from the Mini Fretting Test (MFT) and rheological properties determined by the Dynamic Shear Rheometer (DSR). Based on his research, this relationship assists in setting a corresponding minimum G*/sin δ value for a specified temperature, frequency and conditioning period; in turn, this information can be used to create performance-related binder specifications for a chip seal. Khalid found that the long-term chip seal
performance could be predicted by the development of a chip seal’s strength during its early life.
2.2.2
Emulsion Setting Behavior
6
Curing the emulsion is often confused with breaking the emulsion. Curing is simply the evaporation of water from the emulsion. Evaporation can occur considerably quickly under favorable weather conditions. Therefore, the required curing time can be reduced to achieve proper strength (AEMA 2004). Because strong energy differences exist between the aggregate surface and the emulsified binder, a mechanical force is necessary to push the water away from the interface between the aggregate and the binder (Senadheera et al. 2006). + + + + + + + + + + + + + + + + + + + + + + + + + + + + + + + + + + + + + + + + + + + + + + + + + + + + + + +
Figure 2-1 Emulsifier ions forming micelles in a stable system (Transit New Zealand
7
2.3
Construction Factors of the Chip Seal
The chip seal construction process, as shown in Figure 2-2, consists of three steps: spraying emulsion, spreading a layer of aggregate, and rolling the layer of aggregate. The rolling is one of the most important steps during construction to ensure the best chip seal performance. The main purpose of rolling is to seat the aggregate into the emulsion film, which generates an improved adhesion between the aggregate and the emulsion in the chip seal system. Also, the reorientation of the aggregate by the roller is a critical aspect of the roller operation. The rolling process determines the reorientation of the aggregate so that the flatter side contacts the existing pavement.
8
This reorientation enables the greatest surface area possible for contact between the aggregate and emulsion. Generally, compaction is started by a roller; however, the final process is finished by applied traffic. The effectiveness of the compaction varies according to various factors, such as the rolling pattern, roller types and the number of passes.
2.3.1
Roller Types
In chip seal construction, a roller is employed to embed the aggregates into the emulsion film and to ensure an initial bond with the binder film without crushing the aggregate. Several different types of rollers are currently used in chip seal construction, including the pneumatic tire roller, steel wheel roller, vibratory steel wheel roller, rubber-coated vibrating drum roller, and combination roller. The combination roller is composed of a rubber-coated steel drum and a pneumatic tire. The pneumatic tire roller and the steel wheel roller are commonly employed for rolling aggregate in chip seal construction in the United States. In the United Kingdom (John et al. 2003), rubber-covered steel-drummed vibratory rollers are considered to be the optimal roller for establishing a uniform mosaic of aggregate and improving the initial adhesion between the aggregate and the binder. New Zealand (Transit New Zealand 2005) uses three types of rollers: the pneumatic tire roller, the rubber-coated vibrating drum roller, and the combination roller.
2.3.1.1 Pneumatic tire roller
9
pressure is required, as specified by the manufacturer, to successfully embed the aggregate in the asphalt mat using a pneumatic tire roller. The most common roller speed is
recommended to be less than 5 mph, as specified in most state standard specification and construction manual. Bullard et al. (1992) note problems at a speed greater than 5 mph whereby aggregate is “picked up” on the tires. This problem can lead to the dangerous condition of loose aggregate flying in real traffic. Nonetheless, other states, such as California and Oklahoma, allow a slightly higher speed of 6 mph and 7 mph, respectively. Transit New Zealand (2005) reports that a pneumatic tire with a tread pattern roller enhances travel safety in wet weather; this finding is contrary to the results obtained from smooth tire rollers used for general chip seal work by NCDOT.
10 2.3.1.2 Steel wheel roller
A steel wheel roller has a smooth surface steel drum, as shown in Figure 2-4 and is currently used in chip seal construction to roll the aggregate. The steel wheel roller
produces a smooth pavement, which improves the travel experience. However, the use of the steel wheel roller requires caution because it can crush the aggregate, especially on high spots (Jackson et al. 1989). Also, the steel wheel roller is not recommended when the underlying pavement has irregularities, such as rutting, because the steel wheel drum creates a bridge over the rutting and fails to embed the aggregate into the emulsion film (Gransberg et al. 2005).
Figure 2-4 Steel wheel roller
2.3.1.3 Rubber-coated steel drum roller
11
Also, this roller provides high contact pressure necessary for the appropriate embedment depth of the aggregate into the emulsion film, because the rubber-coated steel wheel drum is more effective in reorienting the aggregate particles (Austroads; Transit New Zealand 2005; John et al. 2003). The rubber-coated steel wheel drum is practically applying with the pneumatic tire roller in New Brunswick in Canada (Miller 1987).
2.3.1.4 Combination roller
Figure 2-5 shows the combination roller that combines the use of a steel wheel drum on the front axle with four rubber tire wheels on the rear axle. The combination roller is currently used in hot mix asphalt (HMA) pavement construction sites. It provides the positive effects of both the pneumatic tire and the steel wheel drum (Gransberg et al. 2005).
Figure 2-5 Combination roller, showing two axles
12
rear axle. Again, this arrangement provides the advantages of both the pneumatic tire roller and the rubber-coated roller in the embedment and reorientation of the aggregates.
2.3.2
Number of Coverages
To achieve an adequate embedment of the aggregate into the emulsion film and proper reorientation of the aggregates, the required number of coverages and appropriate speed is important to the rolling process. An insufficient number of coverages may cause aggregate loss at an early stage by traffic loading. However, neither North Carolina’s standard specifications nor most construction manuals require a specific number of rolling passes. Only 7 out of 39 states have a required number (three or four passes) in their specifications. Transit New Zealand (1993) has a minimum of five roller passes at 5 mph to provide adequate embedment of the aggregates.
Hudson et al. (1986) have researched the effects of the pneumatic tire roller passes in new chip seal construction. Measurements were taken after the chips were spread but before rolling, then after sequences of roller passes, and finally after traffic had been opened for one and two days. Measurements that were taken include those from sand circles, photogrammetry, and the visual examination of enlarged photographs. Hudson et al. found that significant improvements were generally observed from the sand circle measurements and photogrammetry for the first three roller passes. However, it was difficult to measure a change in texture after 6 roller passes.
2.3.3
Rolling Pattern
13
pneumatic tire rollers can be achieved with no more than three passes. This number of passes is commonly the minimum that is required. (Stevenson et al. 2000). A
recommended performance guideline (AEMA 2004) suggests a minimum of three rollers for an average chip seal construction using one rolling pattern. The rolling pattern is that two rollers should be kept close to the chip spreader at all times so that the first pass of the roller covers the aggregate before the emulsion breaks, while the third roller does the back-rolling.
The Alaska DOT has its own rolling pattern with a minimum of three rollers to complete the rolling before the breaking of the binder. The pattern is designed so that the first two rollers move side by side, rolling the outer edges. The third roller follows closely behind, rolling the center of the lane.
The rollers should be employed in a staggered pattern for proper rolling, as specified in the Arizona guide (2003) and the Texas manual (2004). The Texas DOT (2004) recommends a rolling system for a 12-foot wide asphalt surface that uses three or four pneumatic tire rollers with three passes: one forward, one in reverse, and a final pass that extends into the next section of pavement, as shown in Figure 2-6. The lead roller is usually on the inside, and each of the others offset approximately one-third the roller width. The schematic diagram in Figure 2-6 illustrates this echelon pattern.
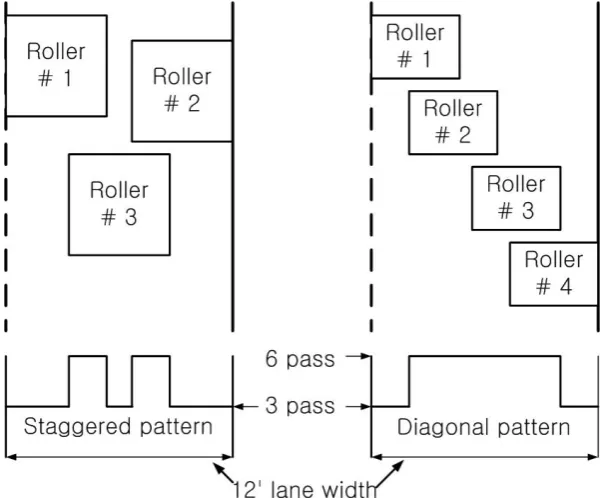
Gransberg et al. (2004) discuss a rolling pattern that uses a minimum of three rollers and four rollers. These two patterns are shown in Figure 2-7. One is a staggered pattern that uses three rollers. The other is a diagonal pattern that uses four rollers. As shown in Figure 2-7, two different areas receive different roller passes. One receives only three passes; another receives six passes due to the overlap between the two rolling patterns. Although the number of rollers increases by only one (i.e., from three to four), the area that experiences six uniform passes is dramatically increased as the rolling pattern changes. According to this case study, therefore, the best rolling pattern should be
14
First Pass Second Pass Third Pass
Figure 2-6 Illustration of echelon rolling pattern (Texas DOT 2004)
Figure 2-7 Rolling pattern and roller coverage for three and four pneumatic tire
15
2.4
Test of Chip Seal Performance
Performance measurements of HMA pavements are not appropriate for measuring chip seal performance because the chip seal surface is constructed in a different way than HMA pavements are constructed. Therefore, chip seal performance needs to be based on a different set of evaluation methods than is used for evaluating HMA pavements.
Stroup-Gardiner et al. (1990) tried to identify potential construction problems that may influence the performance of a chip seal surface. Problems related to construction, such as aggregate pick-up by the rollers, may damage a section of road even before it is opened to traffic. The Vialit test in the laboratory is used to evaluate existing excess aggregate and the set rate of the emulsion. Samples for the Vialit testing were fabricated on a small scale similar to that found in field construction and tested at various curing times.
Yazgan et al. (2004) researched a new test protocol using a performance-based method to determine the aggregate-binder compatibility for a seal coat using the Vialit test. Approximately one year after construction, they evaluated the performance of each test section and rated the field conditions on a scale of 1 to 5, with 5 being the best. At the same time, specimens taken from field test sections during construction were stored under laboratory conditions. Eleven of the twelve test sections showed agreement between field performance and field specimen test results using this new testing protocol. Consequently, the new testing protocol appears to predict the field performance of seal coats.
16
10 with 10 being best, was developed based on overall condition, bleeding, and aggregate retention results.
Petrie et al. (1990) found that the depth of the emulsion around the chip typically indicates about a 50% embedment after the initial rolling and about a 70% embedment after two or more weeks of traffic. Also, they recommend that the rolling procedure should begin immediately after the aggregate is distributed to ensure proper embedment of the chip seal, because more rolling is required as the emulsion cools. Skilled and
experienced construction and inspection personnel also constitute an important factor in a quality chip seal program.
Roque et al. (1991) evaluated the adequacy of existing seal coat design procedures, quality control procedures, and seal coat performance measuring techniques. The
evaluations were based on actual field measurements and led to numerous
recommendations for improvements in seal coat design methods. In Roque’s research, the mean texture depth (MTD), as measured by the sand patch test, was used to evaluate the performance and to measure aggregate wear and embedment rates under a controlled field condition. The wear rate is calculated as the loss in MTD per wheel pass during cool months; the embedment rate is computed as the loss in MTD per wheel pass during warm months minus the calculated wear prediction model to evaluate the effects of different variables on the expected seal coat life.
Ksaibati (2000) studied the effect of aggregate and binder types on the
performance of surface treatments. Field distress data were obtained from test sections in both 1995 and 1996. Two pavement condition indices (PCI) were calculated for each of the test sections. The second performance measure included in the analysis is a friction measurement taken with the use of a locked wheel trailer, as described in ASTM E-274.
17
18
3.
EXPERIMENTAL TEST PROGRAM AND
METHOD
3.1
Experimental Program
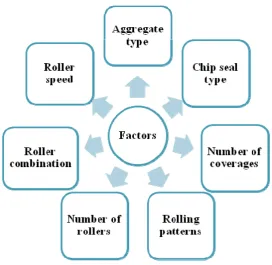
The primary objective of this research is to improve the compaction protocol in chip seal construction. In order to evaluate such a protocol, it is crucial to test samples that are obtained directly from field construction. Thus, a field experimental program has been developed. Numerous factors must be considered for the rolling protocol; Figure 3-1 describes the factors considered in this research.
Each factor has many variables as well as reciprocal factors, such as the correlation between the rolling pattern and the number of rollers. The rolling pattern is decided based on the number of rollers used in construction and the target number of coverages. It is noted that the term number of coverages is used for the number of
compactions experienced by a section of road. For example, Figure 3-2 shows one roller that passes three times to cover the entire lane with minimal overlap. In this case, the number of passes is three, but the number of coverages is only one.
19
Figure 3-1 Factors to be considered in chip seal compaction
20
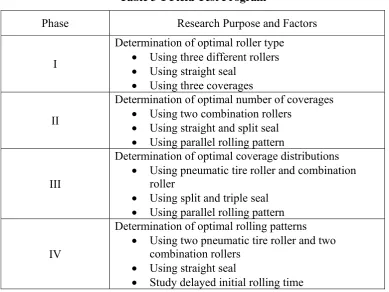
The number of coverages adopted in Phase I for the determination of the optimal roller type is three coverages, based on a literature review. For example, a study of rolling practices conducted in New Zealand found that three passes is the most effective. Also, three passes is the specified number of minimum passes in the standard specifications of a few states, such as Arizona and Louisiana. Using two rollers in a parallel pattern covers an entire lane at the same time, thus optimizing the process. Three different rollers were used to find the optimal roller type in Phase I.
PhaseII is designed to determine the optimal number of coverages for chip seal construction. The number of coverages is important in the rolling process to achieve proper aggregate embedment and to interlock the aggregate particles.
Phase III is designed to observe the effects of different coverage distributions on each layer of multilayered chip seals. The current practice in North Carolina (NC) for general coverage distribution is a single coverage on each layer.
Table 3-1 Field Test Program
Phase Research Purpose and Factors
I
Determination of optimal roller type • Using three different rollers • Using straight seal
• Using three coverages
II
Determination of optimal number of coverages • Using two combination rollers
• Using straight and split seal • Using parallel rolling pattern
III
Determination of optimal coverage distributions • Using pneumatic tire roller and combination
roller
• Using split and triple seal • Using parallel rolling pattern
IV
Determination of optimal rolling patterns • Using two pneumatic tire roller and two
combination rollers • Using straight seal
21
However, the New Zealand Chip Seal Rolling Study recommends three coverages on the top layer of a chip seal without any rolling on the sublayers. In order to evaluate the effect of the distribution number of coverages on each layer, the four cases shown in Figure 3-3 are selected. This figure shows a schematic diagram of the distributed coverage for each layer, as follows: Figure 3-3 (a) shows the New Zealand practice for the split seal; Figure 3-3 (b) shows the NC practice for the split seal; Figure 3-3 (c) shows a combination of the New Zealand and NC practices for triple seals; and Figure 3-3 (d) shows the current NC practice for triple seals. It is expected that these four cases will create different structures of the aggregate and, therefore, will illustrate different levels of performance.
The purpose of Phase IV is to determine the optimal rolling patterns for chip seal construction based on the results obtained from the previous phases. Five rolling patterns were designed based on the current NCDOT patterns and on the number of rollers.
Figure 3-3 Distributed rolling coverage on each layer: (a) New Zealand practice for
split seal; (b) NC practice for split seal; (c) a combination of New Zealand and NC
22
3.2
Specimen Fabrication
One of the critical procedures in this research is fabricating the field samples so that they correspond to the actual construction sequence. Thus, establishing the field sampling procedure is of utmost importance to this study. Figure 3-4 describes the
23
Figure 3-4 Sample fabrication procedure: (a) affixed felt disks on the existing
pavement; (b) spraying emulsion; (c) spreading aggregate; (d) compacting with
24
3.3
Materials
This section describes the materials selected for testing and the physical properties of the component materials.
3.3.1
Material Selection
Two types of aggregate were selected for use with the CRS-2 emulsion: Stalite with a 5/16 in. nominal maximum aggregate size (NMAS), and granite No. 78M. The granite aggregate comes from the Hanson quarry; the Stalite is produced by the Carolina Stalite Company using a rotary kiln expanded, slate, light-weight aggregate. The CRS-2 emulsion is obtained from SemMaterials, L.P.
3.3.2
Gradation of Aggregate Particle Size
Dry sieve analyses were performed on both the aggregate types in accordance with ASTM C 117. Figure 3-5 shows the gradations for the two aggregate types plotted on the 0.45 power chart.
3.3.3
Flakiness Index
The Flakiness Index (FI) is a measure of the percentage, by weight, of flat
particles. It is determined by testing a small sample of aggregate particles for their ability to fit through a slotted plate (Figure 3-6). There are five slots for five different fractions of the aggregate (Table 3-2). If the aggregate particles fit through the slotted plate, they are considered to be flat. If not, they are considered to be cubical.
25
20% for high volume roadways. (Mchattie 2001, Janisch et al. 1998)The tolerance limits for the flakiness of the aggregate are controlled in accordance with traffic but generally should be less than 30 (Croteau et al. 2005).
0 20 40 60 80 100
Per
c
en
t
Passi
n
g
Sieve Size, mm (Raised to the 0.45 power)
Stalite (Phase I) Stalite (Phase II) Granite 78M (Phase I) Granite 78M (Phase II & III) Granite 78M (Phase IV)
0.075 0.15 No.200
No.100
No.50 No.16 No.8 No.4 1/4 " 3/8" 1/2" 3/4 "
0.3 1.18 2.36 4.75 6.3 9.5 12.5 19.0 mm
Figure 3-5 Aggregate particle size gradations
Table 3-2 Slot Size Required for Different Fractions (Mchattie 2001)
Size of Aggregate
Slot width, in. Passing Retaining
1 in. 3/4 in. 0.532
3/4 in. 1/2 in. 0.384
1/2 in. 3/8 in. 0.258
3/8 in. 1/4 in. 0.184
26
Figure 3-6 Flakiness Index plate gauge
3.4
Experimental Test Method
3.4.1
Vialit Test Procedure
The Vialit test was developed by the French Public Works Research Group and standardized in BS EN 12272-3. This test method is an indicator of aggregate retention for chip seals using Vialit testing apparatus, as shown in Figure 3-7. A stainless steel ball is dropped three times from a height of 19.7 in. onto inverted chip seal trays. The percentage of aggregate loss after three ball drops is used for the evaluation of aggregate retention.
27
because the emulsion weight and the aggregate weight could not be determined separately. Equation (2) uses the only aggregate weight that was measured after the mixture was burned in the ignition oven.
, ,
,
(%) B mixture A mixture 100 B mixture
W W
Aggregate Loss
W
−
= × , (1)
where ,
B mixture
W = weight of emulsion and aggregate on chip seal specimen before the test and
,
A mixture
W = weight of emulsion and aggregate on chip seal specimen after the test.
, ,
,
(%) B agg A agg 100
B agg
W W
Aggregate Loss
W
−
= × , (2)
where , B agg
W = weight of aggregate on chip seal specimen before the test and
, A agg
W = weight of aggregate on chip seal specimen after the test.
28
3.4.2
Flip-Over Test
The flip-over test (FOT) measures the amount of excess aggregate on the
specimens and is part of the sweep test procedure (ASTM D 7000). The samples obtained from the test sections were stored at room temperature and were fully cured at 95°F (35°C) for 24 hours before the test. The specimen was turned vertically, and any loose aggregate was removed by lightly brushing the specimen. Equation (2) was used to calculate the percentage of aggregate loss from the six replicated tests results.
3.4.3
Ignition Oven Test
The Ignition Oven method, which is specified in ASTM D 6307 (ASTM), is adopted to determine the weight of residual aggregate and emulsion. This test method determines the amount of asphalt in hot mix asphalt (HMA) by burning the asphalt cement in an ignition furnace. The amount of emulsion is calculated by the difference in the weight of the original chip seal sample and the residual aggregate. It is noted that the type of aggregate in the bituminous paving mixture may affect the results of this test method. Different aggregates may lose mass to varying degrees due to the pyrolytic action. Accordingly, a correction factor, as shown in Table 3-3, is determined for each type of aggregate. This correction factor is applied to calculate the aggregate weight after burning the specimen.
Table 3-3 Correction Factors for Each Type of Aggregate
Type of aggregate Correction factor (%)
Granite 78M 0.26
29
3.4.4
Embedment Depth
In chip seal construction, the purpose of rolling is to achieve proper aggregate embedment to resist traffic loading. Therefore, the rolling operation must follow as closely behind the aggregate spreader as possible to avoid failure. In order to evaluate the embedment of the aggregate, the sand circle method is often employed to measure the exposure depth of the aggregate in the chip seal system based on a volumetric technique.
In this study, a modified sand circle method has been developed to measure the actual embedment depth of the aggregate into the emulsion film. This method is described below in detail.
3.4.4.1 Sample preparation
In order to directly measure the embedment depth of the aggregate, the emulsion must be eliminated from the chip seal structure. The following special specimen
preparation technique has been developed by modifying the standard specification found in Austroad T 253 Seal Behavior:
1) Pour epoxy onto the specimen, ensuring complete coverage of all the aggregate particles to a sufficient depth.
2) Do not disturb the specimen until the epoxy has set; allow approximately 24 hours. 3) Place the specimen covered with epoxy in a tray with sufficient kerosene to
completely submerge the remaining surface seal that is attached to the epoxy; allow the specimen to soak for a minimum of 12 hours.
4) Wash any remaining binder off the specimen with Citra-solve. 5) Allow all solvent to evaporate from the specimen.
30
3.4.4.2 Modified sand circle method
A modified sand circle method based on Roads and Traffic Authority Test Method T 240: Texture Depth of Coarse Textured Road Surfaces has been developed that
describes the procedure for measuring the average textural depth of a chip seal. This method adopts the use of a loose unit mass of sand to calculate the average texture depth, as opposed to the method used for the sand patch test (ASTM E 965). After pouring the sand on the specimen, the sand is carefully spread into a circle. However, it is difficult to maintain a circular form as the diameter of the circle increases. Thus, a ring is used to confine the spread of the sand within the circle.
Both the calculation of the loose unit mass of sand and the sand circle test procedure are described below.
3.4.4.3 Calculation of loose unit mass of sand
1) Determine the internal volume (V) in ml of the calibrating container either from the quantity of water necessary to fill the container or by calculation based on internal dimensions measured to the nearest 0.2 mm.
2) Clean and dry the calibrating container and determine its mass to the nearest 0.1 g (M1).
3) Fill the calibrating container with sand by pouring the sand from a pouring can into the container in an even stream, keeping the pouring spout approximately 25 mm above the surface of the sand to form a central cone. Slightly overfill the container and carefully screen off the excess with a straightedge to provide a surface level with the top of the container. Determine the mass of the container plus its contents to the nearest 0.1 g (M2). Care is necessary to ensure that the
calibrating container is not vibrated or knocked during this operation. 4) Compute the loose unit mass of the sand as follows:
Loose unit mass (C) =M2 M1
V
−
31
5) Repeat these measurements at least three times and determine the mean of the loose unit mass in g/ml. The range of the loose unit mass obtained by the operator should not exceed 0.01 g/ml.
3.4.4.4 Sand circle test procedure
1) Measure the weight of sand that fills the ring to the nearest 0.1 g (W1).
2) Put a ring on the specimen.
3) Pour the sand into the ring in an even stream, keeping the pouring spout approximately 25 mm above the surface of the sand to form a central cone. Slightly overfill the container and carefully screen off the excess sand with a straightedge to provide a surface level with the top of the ring.
4) Determine the weight of the sand remaining in the ring to the nearest 0.1 g (W2).
Care is necessary to ensure that the ring is not moved or knocked while removing the excess sand.
5) Determine the weight of the sand filling the voids of the specimen by subtracting W1 from W2.
6) Calculate the average embedment depth as follows: Average embedment depth = 1272M2
Dd ,
where
D = loose unit mass of the sand (g/cm3); d = diameter of the ring (mm); and M = mass of the sand (W2-W1) (grams).
32
33
Figure 3-8 Modified sand circle test procedure: (a) surface texture after emulsion is dissolved and eliminated; (b) ring on surface of specimen (c) poured sand in ring; (d)
34
3.4.5
MMLS 3 Performance Test Procedure
The MMLS3 is a third-scale unidirectional vehicle load simulator that uses a continuous loop for trafficking. It is comprised of four bogies with only one wheel per bogie. These wheels are pneumatic tires that are 11.8 inches in diameter, approximately one-third the diameter of a standard truck tire. The wheels travel at a speed of about 5,500 wheel applications per hour, which corresponds to a dynamic loading of 3.3 Hz on the pavement surface. This loading consists of a 0.3 sec. haversine loading time and a rest period of 0.3 sec. The dynamic load on the pavement surface by the MMLS3 in motion is measured by a Flexiforce® pressure sensor. The mean value of maximum dynamic loads from the four wheels is approximately 802.6 lbf. The contact area is approximately 5.27 in.2 measured from the footprint of one MMLS3 wheel inflated to 101.5 psi, thus resulting in a surface contact stress of approximately 152.1 psi (Lee 2004).
The major steps in the MMLS3 test preparation are shown in Figure 3-9. Figure 3-9 (a) shows the trimmed specimen, 7.1 in. wide and 14 in. long, for the MMLS3. For chip seal testing under the MMLS3, specimens are attached to thin steel plates that are fastened to a steel base plate, as illustrated in Figure 3-9 (c). MMLS3 loading was applied after a 3-hour temperature preconditioning period at 77°F (25°C). The weight of the specimen attached to the steel plate was measured before and after the MMLS3 loading to determine the aggregate loss. The aggregate loss during the initial traffic loading in the field (normally occurring within half a day) was measured after one wandering cycle of the MMLS3 loading. Then, MMLS3 loading was applied, and the weight measurements were taken periodically over a 2-hour period (equivalent to 11,820 wheel loads) to evaluate the aggregate retention performance of the chip seal under traffic (Kim et al. 2005).
The complete MMLS3 test procedure involves the following steps (Kim et al. 2005):
35 2) measuring the initial specimen weight;
3) conditioning specimens at 77°F (25°C) for 3 hours for the aggregate retention test; 4) MMLS3 loading for 10 minutes, which is the time required for the MMLS3 to
complete one wandering cycle, and then measuring the specimen weight;
36
Figure 3-9 MMLS3 test preparation: (a) trimmed specimen; (b) MMLS3 test
specimen; (c) installation of specimens on a steel base; (d) side view of MMLS3; (e)
positioning MMLS3 in the temperature chamber; (f) complete MMLS3 test setup for
37
3.4.6
Digital Imaging of Cross-section of Epoxy-reinforced Asphalt
Surface Treatment (AST)
In order to evaluate the relationship between the texture condition of the previous layer and the aggregate retention performance of multiple layers, digital image processing (DIP) is employed. DIP is comprised of three basic steps: (a) digital image acquisition of the cut surface of a chip seal specimen; (b) creation of a profile of the cut surface using MATLAB® R2007a; and (c) data analysis to calculate roughness. Two types of chip seals, split seals and triple seals, were used to evaluate the correlation of the texture with the aggregate loss performance.
Both split seal and triple seal specimens have two conditions, No Traffic load and After Traffic load. A prepared cut surface is scanned by a Hewlett Packard digital scanner
(HP Scanjet 4850) as a color BMP file with a resolution of 300 dpi. Using Adobe
Photoshop®, the Stalite 5/16" aggregate was manually eliminated from the original digital image using the Quick Selection tool. The digital image was converted from a color scale to an 8-bit grayscale before and after removing the Stalite 5/16" aggregate from the original image. The 8-bit grayscale digital image consists of a single plane of pixels. Each pixel is encoded using a single number representing grayscale values from 0 to 225.
To scan the cut surface of the chip seal image for DIP, various steps are required, as follows:
1) Remove excess aggregate from the original sample.
2) Pour epoxy onto the specimen, ensuring complete coverage of all the aggregate to a sufficient depth.
3) Do not disturb the specimen until the epoxy has set; allow approximately 24 hours. 4) Cut the specimen with an electric saw.
38
4.
ROLLER TYPES
4.1
Experimental Program
Two types of rollers, the steel wheel roller and the pneumatic tire roller, are generally used in the United States to roll the aggregate during chip seal construction. A combination roller that combines the use of a rubber-coated steel wheel drum on one axle with a single row of rubber tire wheels on the rear axle is used in chip seal construction in New Zealand (Transit New Zealand 2005) and Canada (Croteau et al. 2005).
The primary objective of the Phase I experimental program is to determine an optimal roller type for the chip seal. In order to estimate roller performance, it is critical to test samples that are obtained directly from field construction. Test sections were
constructed on New Sandy Hill Church Road (SR 1131) near Bailey in Wilson County, NC on June 12th 2007 to evaluate the effect of the different roller types. The experimental program includes a single seal type (straight seal) for the three test sections and three different types of rollers: the steel wheel roller, the pneumatic tire roller, and the combination roller.
39
40
Sam
p
le
Sam
p
le
Sam
p
le
41
4.2
Sample Weight Variations
Samples fabricated in the field have a natural variability. Due to the specimen-to-specimen variability, statistical methods are used to determine if the weight of the mixtures or aggregate are similar or different. The statistical test chosen for this comparison is the equal variance two-tailed paired t-test, or analysis of variance
(ANOVA). The null hypothesis is that the mixture or aggregate weights are the same. One challenge with using this method is that it determines significance based on the pooled variances of all the inputs. Some comparisons involve one set of data with low variability for one group and high variability for another. This difference means that some p-values are more precise than others. To compensate for this discrepancy, the variance was pooled for a given test method, e.g., the Vialit test. The variability of each group was taken into account by dividing each result by the standard deviation of the group (i.e., the modified z-test). The z-values were multiplied by the pooled standard deviation and added to the group mean. The t-test or ANOVA against the group number (two or three) was performed on the modified values (LaCroix et al. 2008).
Table 4-1 shows both the basic statistical analysis and a comparison with the ANOVA results. A significance level of 0.05 was used for the ANOVA test. From the ANOVA test results, as shown in Table 4-1, all the p-values for the F-test are larger than 0.05. Thus, no significant difference is evident in the sample weight per each test method for the three roller type groups.
42
Table 4-1 Results of Statistical Analysis of Sample Weights
Test Method
Type of weight
Type of
rollers Mean Variance Std. Dev. F-Stat P-value Conclusion
Vialit
Mixture
Steel 349.7 655.8 25.6
2.24 0.14 Accept Ho
Combo 324.0 364.8 19.1 Pneumatic 324.7 424.2 20.6
Aggregate
Steel 301.2 355.7 18.9
0.87 0.44 Accept Ho
Combo 279.8 285.3 16.9 Pneumatic 281.5 484.7 22.0
FOT
Mixture
Steel 640.2 816.8 28.6
2.55 0.11 Accept Ho
Combo 605.5 736.5 27.1 Pneumatic 615.8 225.5 15.0
Aggregate
Steel 574.0 766.5 27.7
3.16 0.07 Accept Ho
Combo 540.0 750.7 27.4 Pneumatic 539.9 52.5 7.2
MMLS3
Mixture
Steel 594.8 388.0 19.7
2.55 0.10 Accept Ho
Combo 587.8 523.8 22.9 Pneumatic 608.8 148.7 12.2
Aggregate
Steel 530.0 363.0 19.1
2.24 0.14 Accept Ho
43
0 300 600 900
We
ig
h
t (
g
)
Roller Types
Mixture Aggregate Average
P P P
C C C
S S S
MMLS 3 FOT
Vialit
Figure 4-2 Aggregate distribution: S is steel wheel roller; C is combination roller; P
is pneumatic tire roller
4.3
Test Results
4.3.1
Flip-Over Test
44
percentage of the aggregate loss, as shown in Figure 4-3. The percentages of aggregate loss of the combination roller and the pneumatic tire roller show a larger variation than that of the steel wheel roller, ranging from 4.4 % to 8.7%, as shown in Figure 4-3. The range of the percentage of the aggregate loss seen in Figure 4-3 is below the maximum allowable aggregate loss specified, 10%, in the Alaska chip seal guide. The pneumatic tire roller shows the lowest percentage of aggregate loss, 4.4%, among the three different rollers.
8.2
8.7
4.4
0.0 2.0 4.0 6.0 8.0 10.0 12.0 14.0
A
g
gr
egat
e
L
o
ss (
%
)
Roller Types
Steel Combination Pneumatic tire
Figure 4-3 Aggregate loss of a straight seal obtained from FOT samples
4.3.2
Vialit Test
45
weight in the chip seal mixture. To determine the aggregate weight of the Vialit test sample, the Vialit test sample mixture is removed from the Vialit steel plate and then put into the ignition oven to burn off the emulsion. Finally, the emulsion weight is determined by subtracting the weight of the residual aggregate after the Ignition Oven test. This emulsion weight is then subtracted from the weight of the chip seal specimen before testing to determine the weight of the aggregate in the original, untested chip seal
specimen. Figure 4-2 shows the aggregate weight distributions of the Vialit samples after burning.
As explained in the previous statistical analysis, no significant difference was found in the sample weights from the Vialit test. The aggregate loss performance was calculated using Equation (2) and is presented in Figure 4-4 in terms of the different roller types. 7.0 4.3 1.6 0.0 2.0 4.0 6.0 8.0 10.0 12.0 14.0 A g g reg at e L o ss ( % ) Roller Types
Steel Combination Pneumatic tire
Figure 4-4 Aggregate loss of a straight seal from Vialit test samples
46
performance indicates a significant decrease in aggregate loss, although those values are below the maximum allowable aggregate loss specified, 10%, in the Alaska chip seal guide (Mchattie 2001). The pneumatic tire roller shows the best aggregate loss
performance, which is the same result as that from the FOT.
4.3.3
MMLS3 Test
Figure 4-2 indicates a small variation in the straight seal sample weights for the different roller types for the third-scale Model Mobile Loading Simulator (MMLS3) test, which is a similar result to that found in both the FOT and the Vialit test.
8.1
7.0
3.7
0.0 2.0 4.0 6.0 8.0 10.0 12.0
A
ggr
egat
e
Loss (
%
)
Roller Types
Steel Combination Pneumatic tire
Figure 4-5 Aggregate loss of a straight seal from MMLS3 samples
47
retention tests (Figure 4-3 and Figure 4-4) is observed in Figure 4-5. The sample that was rolled by a pneumatic tire roller shows the lowest percentage of aggregate loss (3.7%).
This percentage is nearly half of the others, 7.59% and 6.16%. These results indicate that a pneumatic tire roller shows better aggregate retention performance than the other two rollers, as was found also in the FOT and the Vialit test.
4.3.4
Comprehensive Analysis
Figure 4-2 shows the ANOVA test results for the aggregate retention performance that is used to determine an optimal roller type. All of the p-values from the ANOVA test are less than 0.05, which indicates that significant differences exist among the three groups per test method, i.e., Vialit, FOT, and MMLS3.
Table 4-2 Results of ANOVA: Different Roller Types
Test Methods F-Test P-Value Conclusion
Vialit 5.078 0.021 Reject Ho
FOT 19.727 <0.0001 Reject Ho
MMLS3 8.022 0.002 Reject Ho
Table 4-3 Summary of Average Percentage of Aggregate Loss
Test Methods Roller Types
Steel Combination Pneumatic tire
FOT 8.2 8.7 4.4
Vialit 7.0 4.3 1.6
MMLS3 8.1 7.0 3.7
48
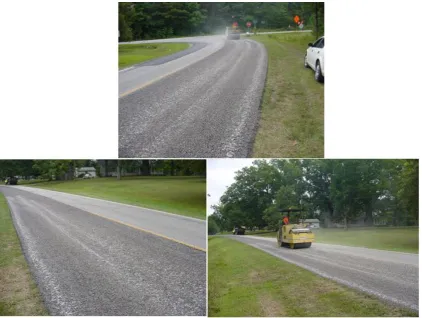
It is known that the use of a steel wheel roller on chip seals can result in an unequal compaction force distribution across a lane because the surface of the steel roller drum is straight along the wheel axle direction, and an existing pavement surface can be uneven across a lane. Also, the steel wheel roller compaction force is concentrated on the hump (the highest area), thus causing the aggregate at those locations to break. Such breakage is usually found in the area next to the wheel path. The breakage is also related to aggregate quality, because poor quality aggregate has a greater potential to break. Figure 4-6 shows photographs taken at one of the secondary roads in Division 3 of an uneven rolling distribution. Based on these observations, the use of the steel wheel roller has been removed from future consideration.
49
Figure 4-6 Uneven compaction under steel wheel roller
4.4
The Effect of Aggregate Shape with Roller Types
An interesting observation was found that, in this study, the aggregate shape is flatter than that used in the study of number of coverages. Aggregate particles are said to be flaky when their thickness is less than 0.6 of their mean size. Thus, the Flakiness Index
50
approximately three times smaller than that used in Phase I. This large value indicates a flatter aggregate shape. The relationship between aggregate shape and roller type was investigated using the Stalite 5/16" cubical.
Table 4-4 Flakiness Indices of Aggregates Used in Different Phases
Phase Aggregate Types Flakiness Index (%)
I Granite 78M 24.26
II Granite 78M 12.82
II Stalite 5/16 8.28
4.4.1
Experimental Program
In order to evaluate the relationship between aggregate shape (FI) and roller type, the Division 5 crew constructed a small-scale field site on Hamlin Road (SR 1633) in Durham County on July 18th, 2007. In order to use cubical aggregate instead of the flatter
aggregate, Stalite 5/16" aggregate was chosen for this study. Figure 4-7 compares the gradation of Stalite 5/16" aggregate with the granite 78M aggregate used in the previous test.
Table 4-5 shows the FI results from the two types of aggregate. The FI value of the Stalite 5/16" aggregate is smaller than that of the granite 78M, thus indicating that the granite 78M aggregate used in the previous section is a flatter aggregate shape. Two different types of rollers, the pneumatic tire roller and the combination roller, were used for this study. The construction sequence that was followed to fabricate samples in the field is the same as shown in Figure 4-1. Two rollers rolled the aggregate immediately after passing the aggregate spreader. CRS-2P emulsion was used because it is the
51
Table 4-5 Flakiness Indices of Two Aggregates Types
Aggregate Types Flakiness Index (%)
Stalite 5/16 8.56
Granite 78M 24.26
0 20 40 60 80 100
Per
c
en
t
Passi
n
g
Sieve Size, mm (Raised to the 0.45 Power)
Granite 78M
Stalite 5/16"
0.075 0.15 No.200
No.100
No.50 No.16 No.8 No.4 1/4 " 3/8" 1/2" 3/4 "
0.3 1.18 2.36 4.75 6.3 9.5 12.5 19.0 mm
Figure 4-7 Aggregate gradation for straight seal construction
4.4.2
Comparison Sample Variation with Statistical Analysis
52
equal variance two-tailed paired t-test. The null hypothesis is that the mixture or aggregate weights are the same. Table 4-6 shows the results of the statistical analysis of sample weights from two groups, the pneumatic tire roller and the combination roller.
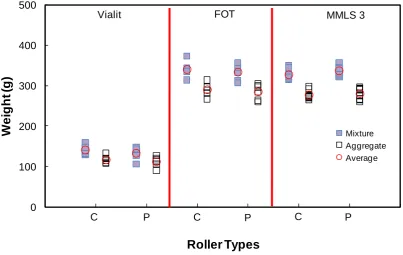
A t-test with significance levels of 0.05 was performed to evaluate whether there are differences in the variances of sample weights between two sections as a function of roller type. Table 4-6, which summarizes the results of the tests, shows p-values that are bigger than 0.05. Thus, the means of the weights between the two groups is not different. Figure 4-8 displays the distribution of sample weights of the two sections as a function of the three different tests.
Table 4-6 Results of Statistical Analysis: Sample Weight
Test
Methods Types Roller types Mean Variance
Std.
Dev. t-test p-value Conclusion
Vialit
Mixture Pneumatic tire 132.3 216.2 14.7 1.21 0.25 Accept Ho
Combination 141.6 124.2 11.1
Aggregate Pneumatic tire 112.1 172.9 13.1 -0.75 0.47 Accept Ho
Combination 117.0 86.0 9.3
FOT
Mixture Pneumatic tire 333.3 398.5 20.0 -0.56 0.59 Accept Ho
Combination 339.9 447.3 21.1
Aggregate Pneumatic tire 284.4 354.9 18.8 -0.46 0.66 Accept Ho
Combination 289.4 310.1 17.6
MMLS3
Mixture Pneumatic tire 337.0 165.6 12.9 -1.59 0.13 Accept Ho
Combination 327.1 150.1 12.3
Aggregate Pneumatic tire 279.8 184.5 13.6 0.46 0.65 Accept Ho
53
0 100 200 300 400 500
W
e
ight
(
g
)
Roller Types
Mixture Aggregate Average
C C
P P P
Vialit FOT MMLS 3
C
Figure 4-8 Distribution of sample weights from two sections: C is combination roller,
P is pneumatic tire roller
4.4.3
Test Results
The Vialit test, FOT, and MMLS3 test were conducted to evaluate aggregate loss performance using Stalite 5/16"aggregate with two different roller types. Detailed information regarding these three tests is provided in Chapter 3. Figure 4-9 shows the results of the aggregate loss performance obtained from the three aggregate retention tests. As described in Figure 4-9, the trend of aggregate retention performance using the