Experimental and Statistical Study on
Spring-back Behavior in Incremental Sheet Metal
Forming Process
Prempreet Singh ¹, Narinder Kumar ²
P.G. Student, Dept. of Mechanical Engineering, RBIEBT, Sahauran, Sahibzada Ajit Singh Nagar, Punjab, India¹ Associate Professor, Dept. of Mechanical Engineering, RBIEBT, Sahauran, Sahibzada Ajit Singh Nagar, Punjab, India²
ABSTRACT: As increasing the demand for low volume production and rapid prototyping, incremental forming
provides a flexible and cost effectiveness in metal forming process. In incremental sheet metal forming, spring back is very important factor that affects the quality of parts. Spring back is an unappeasable forming defect in the sheet metal forming process. Controlling spring back precisely is most important for the design of formed part in incremental sheet forming. In this paper, spring back is investigated using effect of process parameters such as wall angle, tool diameter and step depth. Design of experiment (DOE) is used to plan the experiments conducted on AA 1200 H14 aluminum alloys and analyzed the results. Experimental results are tested by Analysis of variance (ANOVA) technique. Importance of each parameter has been carried out easily by statistical geometric analysis. The obtained result allows selecting suitable parameter to optimize spring back.
KEYWORDS: Incremental sheet metal forming, Spring-back, Taguchi L9 method, ANOVA.
I. INTRODUCTION
Incremental forming is a flexible sheet metal forming process which permits compound shapes to be formed without need of any die. Incremental sheet metal forming concept consisting in a localized deformation of sheet metal part is flexible because no specialized tool is necessary. This process overcome to use of advanced technology for turning raw material into usable goods. Tool with hemispherical head is used to move over the surface of the sheet by which sheet is plastically deformed only around the contact area and then the whole product shape is incrementally formed with traveling of tool around the predefined 3D tool path. One of the main advantages in this process is highly formability of sheet metal that change shape with high forming depth.
II. MATERIAL AND METHOD
1. Selections of process parameters: According to recent researches in ISF process, three factors: vertical step
depth(v), tool diameter (d) and wall angle (α) were selected as effective factors on spring back.
Table1. Process parameters and their levels
Process factor Level 1 Level 2 Level 3
Vertical step depth (mm) 0.2 0.5 0.8
Tool diameter (mm) 8 10 12
Wall angle 30 45 60
Table 1 represents three factors (vertical step depth, tool diameter and wall angle) in three levels which had been studied in this paper.
2. Material used: Material used for this study is AA1200-H14 aluminum alloys with 1.2mm thickness sheet. The
chemical composition of material is shown below in table (2)
Table 2 Chemical composition of work piece
Cu% Mg% Si% Fe% Ni% Mn%
Value 0.0063 <0.00400 0.393 0.552 0.0043 0.0239
Zn% Pb% Sn% Ti% Cr% Al%
Value 0.00456 <0.0200 <0.0100 0.022 <0.0030 98.92
Table 2 represents the chemical composition of aluminum AA1200-H14 alloys which shows that the percentage of aluminum is 98.92%.
Table 3 Mechanical properties of work piece
Material sheet Temper Thickness (mm) Tensile
Strength (N/mm)
Elongation percentage (%)
Tensile
Strength (Mpa)
1200 H14 1.2 129.438 7.220 129.438
The mechanical properties are shown in table (3) as the maximum elongation of AA 1200 H14 is 7.22%.
3. Taguchi method and Design of Experiments: The Taguchi method is a quality tool that helps improve the work
Table 4 Experimental layout based on an L9 orthogonal array
Experiment number Cutting parameter levels
Step Depth(mm) Tool diameter(mm) Wall angle
1 0.2 8 30
2 0.2 10 45
3 0.2 12 60
4 0.5 8 45
5 0.5 10 60
6 0.5 12 30
7 0.8 8 60
8 0.8 10 30
9 0.8 12 45
Table 4 presents the 9 different experiments strategies used to conduct the experiment at different levels to obtain the precise result.
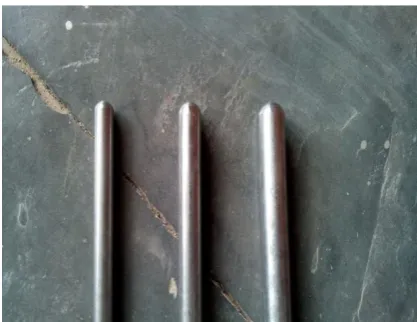
4. Experimental setup: The process starts from a flat sheet blank clamped on a fixture and mounted on the table of
CNC machine. Then the forming is done with help of hemispherical tool shown in figure 1to move over the surface of plate Hemispherical type forming tool with 8mm, 10mm and 12mm diameters were used as shown in figure 1. Also fixture with clamping system was designed and machined according to desirable dimensions shown in figure 2.
Figure 2 shows the fixture designed to clamp the plate tightly so that it is easy to conduct the experiment. Aluminum blank is held on this plate and tightened with help of bolts afterwards tool is move over the plate and plate is deformed accordingly.
After applying L9 runs, the effective value of spring back of the sheet is obtained from the software. Spring back is measured from four equidistant points on the sheet with help of co-ordinates measuring machine (CMM WENZEL XORBIT XO 55).
III. RESULTS AND DISCUSSION
1. Analysis to signal to noise ratio: In Taguchi method, the term signal represents the desirable value, and noise
represents the undesirable value. Process parameters with the highest S/N ratio always give the best quality with minimum variance. In order to find the influence of process parameters on response the signal to noise ratio and mean for each parameter was calculated. In this current work, the S/N ratio was chosen according to the principle of „smaller the better‟ characteristics shown in equation 1.
S/N = 10 log 1 1 𝑛 𝑛𝑖=1𝑦𝑖2
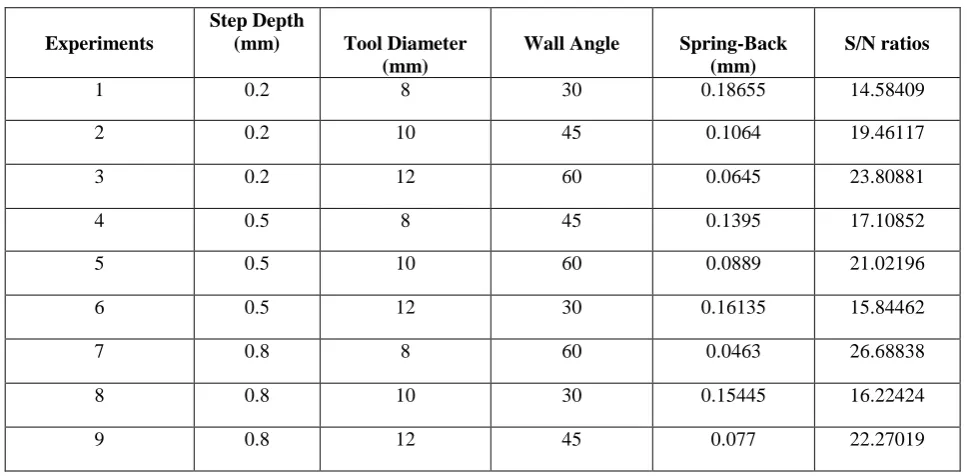
Where n is the number of repetitions and Yi is the value of spring back of the test. The process parameters, calculated spring back and signal to noise (S/N) ratio are given in table 5.
Table 5 Results of spring-back
Experiments
Step Depth
(mm) Tool Diameter
(mm)
Wall Angle Spring-Back
(mm)
S/N ratios
1 0.2 8 30 0.18655 14.58409
2 0.2 10 45 0.1064 19.46117
3 0.2 12 60 0.0645 23.80881
4 0.5 8 45 0.1395 17.10852
5 0.5 10 60 0.0889 21.02196
6 0.5 12 30 0.16135 15.84462
7 0.8 8 60 0.0463 26.68838
8 0.8 10 30 0.15445 16.22424
9 0.8 12 45 0.077 22.27019
Response Table for Signal to Noise Ratios Smaller is better
Level A B C 1 19.28 19.46 15.55 2 17.99 18.90 19.61 3 21.73 20.64 23.84 Delta 3.74 1.74 8.29 Rank 2 3 1
Fig. 3 Response table for S/N ratio of spring back
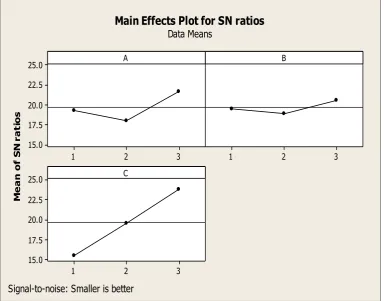
Figure 3 shows the response table for S/N ratio of spring back smaller is better obtained for different parameter levels. The analysis of S/N ratio of spring back found that the first factor that causes spring back to be great is wall angle, having step depth and tool diameter as secondary factors respectively. After that, the analysis is made to determine suitable factor of each main factor from S/N ratio and mean graphs is shown in Figure 4 & Figure 5.
3 2
1 25.0
22.5
20.0
17.5
15.0
3 2
1
3 2
1 25.0
22.5
20.0
17.5
15.0
A
M
e
a
n
o
f
S
N
r
a
ti
o
s
B
C
Main Effects Plot for SN ratios
Data MeansSignal-to-noise: Smaller is better
3 2 1 0.16 0.14 0.12 0.10 0.08 3 2 1 3 2 1 0.16 0.14 0.12 0.10 0.08 A M e a n o f M e a n s B C
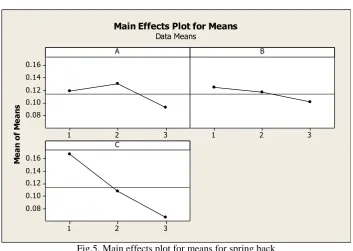
Main Effects Plot for Means Data Means
Fig.5. Main effects plot for means for spring back
In the impact analysis of S/N ratio, factor level will be selected to give maximum S/N ratio as the most suitable factor level.
2. Analysis of variance: The ANOVA study performed to investigate the statistical significance of the process
parameters affecting the response (spring back). This is achieved by separating the total variability of the S/N ratios, which is measured by the sum of the squared deviations from the total mean of the S/N ratio, into contributions by each of the process parameters and the error. F-test is carried out to judge the significant parameter affecting the tool life. The larger F value affects more on the performance characteristics.
Table 5 Results of ANOVA using data from signal to noise ratios for spring back
Analysis of variance for spring back, using adjusted SS for tests
Source DF Seq SS Adj SS Adj MS F P % C
Depth 2 0.0022155 0.0022155 0.0011077 5.73 0.149 11.73
Diameter 2 0.0008378 0.0008378 0.0004189 2.17 0.316 4.44
Angle 2 0.0154420 0.0154420 0.0077210 39.91 0.024 81.78
Error 2 0.0003869 0.0003869 0.0001934 2.05
Total 8 0.0188822
S = 0.0139083 R-Sq = 97.95% R-Sq(adj) = 91.80%
Table 5 shows result of ANOVA for spring back. From ANOVA, it is found that parameter C that is wall angle is the significant level on spring back. The step depth and tool diameter found to be insignificant from ANOVA for spring back study. Hence, the best values of parameters can be selected to achieve the lower spring back and higher values of geometrical and dimensional accuracy. The selection of the most suitable factor level from the graph found that level of factor that causes spring back to be minimum is when level of step depth is 0.8mm, tool diameter is 12mm and wall
angle is 60ᵒ.
IV. CONCLUSION
performing different experimental tests. The experimental design was followed by DOE with taguchi L9 methodology. The conclusion from this study is summarized as follows:
The L9 taguchi orthogonal designed experiments of ISF AA1200 H14 were successfully conducted.
From the selected parameters wall angle found to be the most effective parameter in spring back as to step depth and tool diameter.
Increase of wall angle and tool diameter and reduction of step depth can lead to a reduction in spring back.
Accurate combination of process parameters can be selected for lowering spring back in sheet metal forming.
REFERENCES
[1] Mohammadi H., Sharififar M. and Ali Asghar Ataee, “Numerical and experimental analysis and optimization of process parameters of AA1050 incremental sheet forming”, Journal of Applied Mechanics, Vol. 45, Issue No. 1, pp 35-45, Sep. 2014..
[2] Vahdati A.and Vahdati M., “Experimental, statistical and simulation study on spring-back behavior in incremental sheet metal Process”, International Conference on Advances in Materials and Processing Technologies, pp 607-612 Nov. 2013.
[3] Han F. et al., “Springback prediction for incremental sheet forming based on FEM-PSONN technology”, Trans. Nonferrous Met. Soc. China, pp 1061−1071, Sep. 2013.
[4] Hama T. et al., “Finite-element simulation of springback in sheet metal forming using local interpolation for tool surfaces”, International Journal of Mechanical Science, pp 175-192, July 2007.
[5] Asghar J., Reddy and N.V., “Importance of tool configuration in incremental sheet metal forming of difficult to form material using electro plasticity”, Proceeding of World Conference, Vol. 3, pp 978-988, July 2013.
[6] Vigneshwaran G. et al., “Optimization of process parameters in single point incremental forming of AA 6063-O alloy”, International Journal of Current Engineering and Scientific Research, Vol. 2, Feb. 2015.