ABSTRACT
YOO, SEUNGHYUN. Structural Characterizations of Biomass-derived Carbon Materials and Application as Supercapacitor Electrode. (Under the direction of Dr. Sunkyu Park and Dr. Stephen S. Kelley).
A series of experimental setup was designed to investigate chemical, physical, electrochemical, and electronic structures of different biomass-derived carbon materials. Biomass-derived carbon materials have long been existed with human beings. Ancient
Amazonians buried wood charcoals underground to fertilize the land and people of the Middle Ages used wood charcoal as an ingredient of metal forging and gunpowder synthesis. However, scientific efforts to elucidate the structure of biomass-derived carbon were not made until 1,900s due to material’s inherent structural complexity. Rosalind Franklin who is famous for her
discovery of the DNA X-ray diffraction pattern, systematically studied the structure of various black carbon materials using the X-ray diffraction technique. Later the invention of analytical instruments further revealed the structure of carbon materials. With help of several different techniques, we successfully excavated scientific phenomena occurring during the thermal treatment of biomass.
Chapter 2 and Chapter 3 investigated physicochemical and electronic structure of loblolly pine wood derived activated carbon to apply as a supercapacitor electrode. Activated carbon was synthesized by soaking loblolly biochar samples in sodium hydroxide solution and then
thermally treating impregnated biochar samples at 800 °C for 2 hours. There were significant increases in electrical conductivity and specific capacitance after chemical activation. The electronic structure change was thoroughly investigated with electron energy loss spectroscopy, electron spin resonance spectroscopy, and X-ray photoelectron spectroscopy. Electrochemical performances were evaluated by assembling the supercapacitor coin cell.
Chapter 4 and Chapter 5 investigated the graphitic structure development in loblolly pine wood and BioChoice lignin during the thermal treatment above 1,400 °C. Unlike the
conventionally known concept, in situ X-ray diffraction measurements of loblolly pine wood done above 1,400 °C revealed a new fact that the graphitic stacking develops non-continuously. For a long time researchers believed a crystalline graphitic stacking continuously develops from a disordered char structure. However, the new discovery was opposite from the known fact. Using X-ray diffraction and transmission electron microscopy, the lattice parameter of loblolly pine wood derived graphite was calculated. Further graphite formation kinetics of loblolly pine wood and BioChoice lignin were systematically investigated.
Chapter 6 is an introduction of a concept to synthesize graphene out of biomass-derived graphite. Catalytic graphitization of biomass using iron (III) nitrate can generate a crystalline graphite at 800 °C. By producing graphite out of cheap biomass at low thermal treatment
Structural Characterizations of Biomass-derived Carbon Materials and Application as Supercapacitor Electrode
by Seunghyun Yoo
A dissertation submitted to the Graduate Faculty of North Carolina State University
in partial fulfillment of the requirements for the degree of
Doctor of Philosophy
Forest Biomaterials
Raleigh, North Carolina 2018
APPROVED BY:
_______________________________ _______________________________ Dr. Sunkyu Park Dr. Stephen S. Kelley
Committee Co-Chair Committee Co-Chair
_______________________________ _______________________________ Dr. David C. Tilotta Dr. Jacob L. Jones
ii BIOGRAPHY
Seunghyun Yoo was born February 24th, 1990 in Masan, Kyungsangnam-do, Republic of Korea. He graduated from Seoul National University in August 2014 with a B.S. degree in Environmental Materials Science. During his undergraduate, he worked as an undergraduate research intern at Dr. Hyejung Youn’s Paper Engineering Lab. He also joined Dr. Sunkyu Park’s group as a visiting scholar from June 2013 to February 2014.
From August 2014, Seunghyun started his Ph.D. program at the Department of Forest Biomaterials under the advice of Dr. Sunkyu Park and Dr. Stephen S. Kelley. His mission during the Ph.D. program was to investigate the structure of biomass-derived carbon materials. By adding Chemistry and Materials Science and Engineering as co-minors, he interpreted complex carbon structures with languages of chemistry and materials science.
iii ACKNOWLEDGMENTS
I gratefully appreciate the enthusiastic support of my two advisors, Dr. Sunkyu Park and Dr. Stephen Kelley. Dr. Sunkyu Park has been my mentor since I was an undergraduate student and he led my career to the research field. Dr. Stephen Kelley offered me various chances to experience the world including the Schweighofer workshop to Vienna, Austria where I made many international friends. He is my writing mentor either.
Luckily, I have many internal collaborators who made my research fruitful. Dr. Junyeong Park who is my predecessor, helped me to setup the initial research schematics. Dr. Jiajia Meng is my good friend and mentor both at NCSU and at Tesla. Thanks to Dr. Wei Gao and Nanfei He, I was able to do research on electric double capacitor. Dr. Jacob Jones who is on my committee and Dr. Ching-Chang Chung helped me to understand X-ray diffraction data of biomass-derived carbon materials. Through Dr. Tatyana Smirnova who is also on my committee, I was able to learn about electron spin-resonance phenomenon. Dr. Yang Liu is my big supporter regarding the usage of scanning transmission electron microscopy and electron energy loss spectroscopy. Without Roberto Garcia, I was not able to get quality TEM samples. With help of Dr. Chuck Mooney and Fred Stevie, I was able to obtain wonderful scanning electron
microscopy images and X-ray photoelectron spectra.
iv rare analytical instrument, inverse photoemission spectrometer, to empirically figure out the LUMO structure of carbon materials.
During my Ph.D., I took 16 in-class courses to enhance my scientific knowledge and research quality. Among 16 courses, 12 courses were taught by the Department of Chemistry, the Department of Physics, and the Department of Materials Science and Engineering. I want to appreciate Dr. Edmond Bowden, Dr. Gavin Williams, Dr. Stefan Franzen, Dr. Kenan Gundogdu, Dr. James LeBeau, Dr. Kelix Kaess, Dr. Leslie Sombers, Dr. Zlatko Sitar, Dr. Veronica
Augustyn, Dr. Elizabeth Dickey, Dr. Gerald Lucovsky, and Dr. Jacob Jones. With help of these professors, I was able to enhance the quality of my research.
I also would like to appreciate my friends at NCSU. Dr. Brandon Jones, Dr. Li Xiao, and Drew Moore welcomed me and helped me a lot when I first came to Raleigh in 2013. Dr. Ki Seob Gwak, Dr. Hoyong Kim, Dr. Chaehoon Kim, and Dr. Changyoung Hong who are my alumni taught me research & writing techniques and gave me research inspirations. I want to appreciate my close friends, Xiao Jiang, Dr. Robert Narron, Eliezer Reyes, Ruocun Wang, and Dr. Jonghoon Ahn for their supports other than research. Mike Maltby was my handyman who solved big and tiny problems regarding instruments. A special appreciation to Barbara White since she perfectly managed the department lab.
v TABLE OF CONTENTS
LIST OF TABLES ... vii
LIST OF FIGURES ... viii
Chapter 1: Structural Characterization of Loblolly Pine derived Biochar by X-ray Diffraction and Electron Energy Loss Spectroscopy ... 1
Introduction ... 2
Experimental ... 4
Results and Discussions ... 6
Conclusions ... 17
References ... 18
Chapter 2: Effect of Chemical Activation on DC Electrical Conductivity of Loblolly Pine derived Activated Carbon ... 33
Introduction ... 34
Experimental ... 36
Results and Discussions ... 40
Conclusions ... 48
References ... 50
Chapter 3: Chemical Activation Impacts on Electrochemical Performance of Slow Pyrolysis Biochar as Supercapacitor Electrode ... 73
Introduction ... 74
Experimental ... 75
vi
Conclusions ... 87
References ... 89
Chapter 4: Graphitization Behavior of Loblolly Pine Wood Investigated by in situ High Temperature X-ray Diffraction ... 103
Introduction ... 104
Experimental ... 106
Results and Discussions ... 108
Conclusions ... 116
References ... 117
Chapter 5: Graphite Formation Kinetics of Loblolly Pine and Lignin Investigated by in situ X-ray Diffraction ... 131
Introduction ... 132
Experimental ... 133
Results and Discussions ... 135
Conclusions ... 138
References ... 140
Chapter 6: Future Studies - Catalytic Graphitization of Biomass and Biomass-derived Sustainable Graphene Synthesis ... 146
Background ... 146
vii LIST OF TABLES
Table 2.1 Yield, elemental analysis, and proximate analysis results of biochar and activated carbon samples. Elemental analysis result is indicated as molar
fraction and proximate analysis result is indicated as weight fraction ... 57
Table 2.2 BET surface area, micro/meso pore volume, and average pore width of biochar and activated carbon samples ... 57
Table 2.3 Quantified XPS spectrum from C 1s of biochar and activated carbon samples (molar concentration) ... 69
Table 3.1 Elemental composition and BET surface area/BJH pore analysis of biochar and activated carbon samples ... 95
Table 3.2 Quantified XPS spectrum from C 1s biochar and activated carbon samples (molar concentration) ... 98
Table 3.3 Comparing specific capacitances of biochar and activated carbon samples depending on the activation method ... 102
Table 4.1 Quantified lattice parameters of N800 biochar, biomass graphite, and natural graphite ... 123
Table 4.2 Quantified parameters from electron energy loss spectra ... 129
Table 5.1 Calculated lattice parameter for c-direction in graphite hexagonal lattice ... 144
viii LIST OF FIGURES
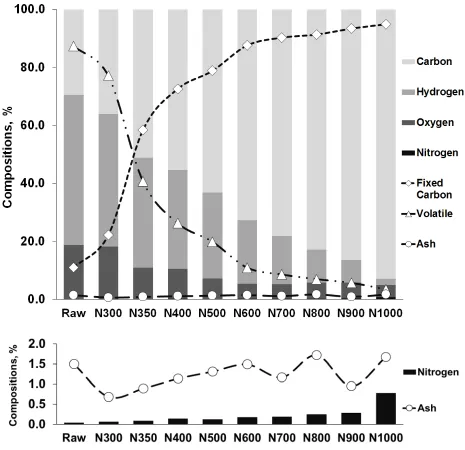
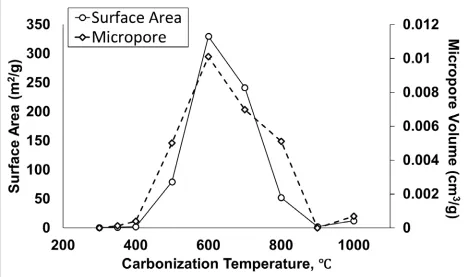
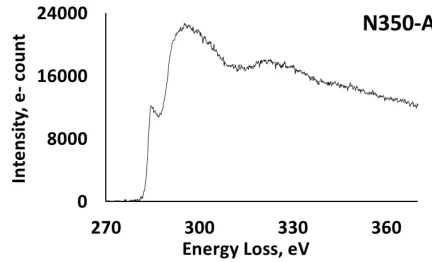
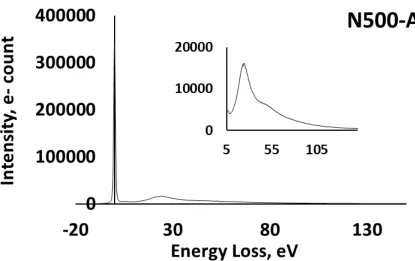
Figure 1.1 Composition analysis result of loblolly pine and nine biochar samples ... 24 Figure 1.2 BET surface area and micropore volume of biochar samples ... 25 Figure 1.3 Carbon K-edge energy loss spectrum and calculated biochar sp2 content ... 26 Figure 1.4 Visualization of multiple elastic scattering structure and calculated average C-C bond length ... 27 Figure 1.5 Peak positions of biochar bulk plasmon excitation energy loss spectrum and
correlation between plasmon excitation energy loss and inverse square of the
average C-C bond length ... 28 Figure 1.6 XRD pattern and derived physical profiles of biochar ... 29 Figure 1.7 FWHM and peak 2θ angle of the (002) and (100) reflections. Calculated (002)
interlayer spacing distance and (100) layer coherence length and visualization of crystalline graphitic structure ... 30 Figure 1.8 HAADF images of biochar at 500 nm magnification ... 31 Figure 1.9 Schematic of the chemical and morphological changes that occur during the
carbonization of biomass at different temperatures ... 32 Figure 2.1 BET surface area of activated carbon samples as a function of precursor biochar
volatile content ... 58 Figure 2.2 Scanning electron microscopy images of biochar and activated carbon ... 59 Figure 2.3 Carbon core level electron energy loss spectrum and zero/low energy loss
spectrum of biochar samples ... 60 Figure 2.4 Carbon core level electron energy loss spectrum and zero/low energy loss
spectrum of activated carbon samples ... 64 Figure 2.5 Carbon sp2 content of biochar and activated carbon samples, C-C bond length
of biochar and activated carbon samples, and a linear relationship between
ix Figure 2.8 Deconvolved XPS spectrum of N500-AC activated carbon and quantum
mechanical interaction schematic of π to π* shake-up peak. Electrical conductivity of biochar and activated carbon as a function of π to π* shake-up
intensity and carbon sp2 content ... 72
Figure 3.1 Scanning electron microscopy images of biochar and activated carbon ... 96
Figure 3.2 Calculated sp2 content of biochar and activated carbon and calculated average carbon-carbon bond length of biochar and activated carbon ... 97
Figure 3.3 DC electric conductivity of biochar and activated carbon as a function of π to π* transition... 98
Figure 3.4 Cyclic voltammograms and Nyquist plots of biochar and activated carbon ... 99
Figure 3.5 Specific capacitance of biochar and activated carbon as a function of BET surface area ... 100
Figure 3.6 Specific capacitance values and overlapped cyclic voltammogram of N500 biochar and N500-AC activated carbon ... 101
Figure 4.1 In situ X-ray diffraction patterns at the temperature range of 800 to 1,600 ℃ ... 121
Figure 4.2 Room temperature XRD patterns of N800 biochar, biomass graphite, and natural graphite ... 122
Figure 4.3 Simultaneous TG/DSC curve of loblolly pine wood... 124
Figure 4.4 SAED patterns and TEM images of N800 biochar, biomass graphite, and natural graphite ... 125
Figure 4.5 Low energy loss and Carbon K-edge core energy loss spectra of N800 biochar, biomass graphite, and natural graphite ... 126
Figure 4.6 Gaussian deconvolution of carbon K-edge electron energy loss spectrum of N800 biochar, biomass graphite, and natural graphite ... 127
Figure 4.7 Correlation between bulk plasmon excitation energy and inverse square of the average C-C bond length ... 130
Figure 5.1 Simultaneously collected XRD patterns of LB pine ... 142
Figure 5.2 Simultaneously collected XRD patterns of BCL ... 143
x
Figure 5.4 Visualized vibrational modes of benzene ring ... 145
Figure 5.5 Raman scattering spectra of LB pine, BCL, and synthetic graphite ... 145
Figure 6.1 Graphene applications classified by technology readiness level ... 147
1 CHAPTER 1.
Structural Characterization of Loblolly Pine derived Biochar by X-ray Diffraction and Electron Energy Loss Spectroscopy
ACS Sustainable Chemistry & Engineering 6 (2), 2621-2629
Abstract
2 1. Introduction
Biochar is a biomass derived sustainable carbon source, which can be utilized in both energy and material applications. The traditional role of biochar has been confined to the low value product such as soil amendment, adsorption medium, or solid fuel. There are also potential high-end applications for biochar such as electrodes for electrochemical energy storage systems 1-3 and conductive material for sensors and electronic devices.4 For these high-end applications, it is crucial to understand how chemical composition and morphology impact the nano-structure of biochar and its resulting properties. Due to the inherent structural complexity of biochar and limitations of many common analytical techniques, the detailed structure of biochar is not well understood.
Advances in nanoscale analytical techniques have enabled characterizations of materials with complex structures. Specifically, solid state nuclear magnetic resonance (NMR),5-7 electron energy loss spectroscopy (EELS),8-12 energy-dispersive X-ray spectroscopy (EDS),10, 13 X-ray photoelectron spectroscopy (XPS),6, 9, 14-15 X-ray absorption spectroscopy (EXAFS, XANES),14, 16-17 and Raman spectroscopy10, 18 can now be used to understand the nanoscale details of biochar. Transmission electron microscopy (TEM),8-9, 19 scanning transmission electron
microscopy (STEM),10 and scanning electron microscopy (SEM)10, 19 can also be used for image analysis of nanoscale structures. With these techniques, more details on biochar structure can be determined.
3 carbon which exhibits a broad (002) reflection XRD pattern after thermal treatment. Several other studies probed additional details of carbon structural development during the carbonization and graphitization process.21-22 Because XRD is a bulk technique, which observes the whole structure of carbon material, Franklin’s classification seemed plausible from the macroscopic point of view and many researchers have we accept Franklin’s classification. However, with the development of local technique such as TEM, different nanoscale graphitization behaviors in non-graphitizing carbon have been examined. Subsequent work on nanoscale graphitization behaviors support the idea that there is no absolute graphitizing carbon or non-graphitizing carbon.23 Graphitic carbon crystallites could also be synthesized from a non-graphitizing carbon precursor (biomass) through thermo-catalytic reactions.24-25 Thus, rather than using Franklin’s classification as rigid categories, it is more appropriate to view the carbonization and
graphitization process as pathways to energetically stable carbon structures.
The earlier model suggested by Keiluweit et al.16 is intuitive, but it lacked quantitative data interpretations to distinguish different phases of biochar structure development.
Furthermore, their classification of phase components as pyrogenic amorphous carbon, pore space, and turbostratic crystallites is inaccurate. The term “amorphous” cannot be used for pyrolytic carbon26 and pore space is dependent on precursor and pyrolysis condition, and thus it is irrelevant to the disordered and turbostratic structure of carbon material.6 Other prior studies also reported the formation of ordered carbon structures during the thermal treatment of biomass, but they lacked a precise quantification of both the physical structure and chemical composition profiles.5, 27-28
4 structure and chemical composition. EELS is a powerful analytical technique, which can simultaneously collect information on physical structure (plasmon excitation energy loss and multiple scattering resonance), chemical composition data (sp2 content), and visual images (STEM high angle annular dark-field (HAADF)). XRD is not solely a nanoscale oriented technique, but extracted XRD patterns give useful information about the size and morphology of nano-carbon crystallite. Combined with material composition data, this study quantitatively characterized the carbonization behavior of biochar at a series of thermal treatment steps. Then, based on the collective interpretation of physical and chemical structure developments of nano-carbon crystallite, we propose a schematic model of carbon structural development.
2. Experimental
2.1. Biochar sample preparation
5 2.2. Material Composition Analysis
Carbon, hydrogen, and nitrogen content of the biochar and activated carbon samples were analyzed by using PerkinElmer 2400 Series II elemental analyzer (PerkinElmer, Waltham, MA). Oxygen content was calculated by difference. Proximate analysis was done to determine volatile matter, fixed carbon, and ash contents using TA Q500 thermogravimetric analyzer (TA Instruments, New Castle, DE). The specific measurement condition followed modified ASTM D7582-15.29
2.3 BET surface area and micropore volume analysis
BET surface area and micro pore volume of biochar samples were analyzed with Gemini VII 2390 surface area analyzer (Micromeritics, Norcross, GA, USA). 0.15 ~ 0.20 g of sample was loaded in the quartz tube and the sample was degassed at 220°C with nitrogen for 2 hours. Multipoint BET surface area was calculated from the linear relative pressure regime of 0.05 < P/P0 < 0.30. Total pore volume was calculated at P/P0 = 0.98. Micropore volume was calculated by summation of pore volumes with diameter of less than 2 nm.30
2.4. STEM sample preparation and EELS analysis
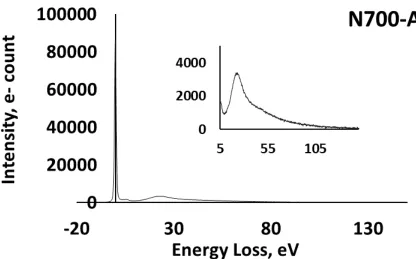
6 plasmon excitation energy loss, and carbon K-edge core energy loss spectra were collected. Electron multiple scattering effect was corrected by using Gatan Digital Micrograph software.31 Corrected carbon K-edge energy loss spectrum was deconvolved into three Gaussian spectra for further calculation.8-9 STEM HAADAF images were taken at 500 nm magnification. Image resolution was 0.07 nm in STEM mode.
2.5. X-ray diffraction pattern analysis
Biochar X-ray diffraction patterns were collected by using a SmartLab X-ray diffractometer (Rigaku, Woodlands, TX). Operating voltage was 40 kV and operating current was 44 mA. A Cu Kα X-ray tube was used to generate X-rays at a wavelength of wavelength was 0.1541 nm. A Graphite monochromator and Kβ filter were used for the collection of diffracted beam. Biochar particles were placed on a quartz supported sample holder. Then, the sample holder was placed inside the x-ray chamber. Measurement of 2θ angle range was set from 10 degrees to 90 degrees. Each step was 0.05 degree and the X-ray detector remained constant for 4 seconds at each step to collect the diffracted X-rays. Background subtraction and signal smoothing were done with HighScore Plus 3.0 software (PANalytical, Westboroough, MA). Instrumental broadening impact was considered as minimal. Processed XRD patterns were normalized at (002) reflection intensity. Peak position 2θ angle and full width at half maximum (FWHM) of (002) reflection and
(100) reflection were extracted for further analysis.
3. Results and Discussion
3.1. Biochar composition analysis
7 biochar samples. Bar graph indicates the atomic compositions (molar %) of the biochar samples. As the carbonization temperature increases from 300 to 1,000℃, the atomic carbon content of biochar increases from 36.2 to 92.9 mol.%. Conversely, the atomic oxygen content of biochar decreases from 18.1 to 4.2 mol.% and the atomic hydrogen content decreases from 51.8 to 2.2 mol.%. The amount of nitrogen remains nearly constant between 0.1 to 0.8 mol.%. The dotted lines in Figure 1.1 shows the proximate analysis (weight %) of the biochar samples. As the carbonization temperature increases from 300 to 1,000℃, the amount of fixed carbon increases from 22.2 to 94.9 wt.% while the amount of volatile decreases from 77.2 to 3.4 wt.%. The amount of ash remains nearly constant in between 0.7 to 1.7 wt.%.
8 3.2. BET surface area and micropore volume analysis
Figure 1.2 shows BET surface area and micropore (pore diameters less than 2nm) volume of biochar as a function of carbonization temperature. During the carbonization, BET surface area and micropore volume start to increase from 400℃ (1.98 m2/g and 0.0004 cm3/g each) and maximum values are attained at 600℃ (329.63 m2/g and 0.0101 cm3/g each). Then, additional heat input breaks down the porous network of biochar and the BET surface area and micropore volume start to decrease. N1000 has a BET surface area of 12.34 m2/g and a micropore volume of 0.0007 cm3/g. A similar trend for woody biomass has also been reported.16 Overall graphs of BET surface area/micropore volume as a function of carbonization temperature resemble symmetric bell-shaped curve. Below 400℃, the BET surface area and micropore volume are not well-developed. Between 400℃ and 800℃, biochar structures develops and the porous structure collapses. Above 900℃, the microporous network of biochar almost disappears.
3.3.1. Carbon K-edge core energy loss analysis and carbon sp2 content calculation
Deconvoluted carbon K-edge energy loss spectra of N1000 are presented in Figure 1.3(a). The sp2content is a relative value between the sample 1s to π* transition peak area ratio and that of graphite. The equation is given as,35
s𝑝𝑝2𝑐𝑐𝑐𝑐𝑐𝑐𝑐𝑐𝑐𝑐𝑐𝑐𝑐𝑐 = [
𝑎𝑎𝑎𝑎𝑐𝑐𝑎𝑎(𝜋𝜋∗)
𝑎𝑎𝑎𝑎𝑐𝑐𝑎𝑎(𝜋𝜋∗+𝜎𝜎∗)]𝑆𝑆𝑆𝑆𝑆𝑆𝑆𝑆𝑆𝑆𝑆𝑆
[𝑎𝑎𝑎𝑎𝑐𝑐𝑎𝑎𝑎𝑎𝑎𝑎𝑐𝑐𝑎𝑎(𝜋𝜋∗(𝜋𝜋+∗)𝜎𝜎∗)]𝐺𝐺𝐺𝐺𝑆𝑆𝑆𝑆ℎ𝑖𝑖𝑖𝑖𝑆𝑆, 𝐺𝐺𝑆𝑆𝑟𝑟𝑆𝑆𝐺𝐺𝑆𝑆𝑟𝑟𝑐𝑐𝑆𝑆
= [
𝐺𝐺1
𝐺𝐺1 +𝐺𝐺2 +𝐺𝐺3]𝑆𝑆𝑆𝑆𝑆𝑆𝑆𝑆𝑆𝑆𝑆𝑆
[𝐺𝐺1 +𝐺𝐺𝐺𝐺12 +𝐺𝐺3]𝐺𝐺𝐺𝐺𝑆𝑆𝑆𝑆ℎ𝑖𝑖𝑖𝑖𝑆𝑆, 𝐺𝐺𝑆𝑆𝑟𝑟𝑆𝑆𝐺𝐺𝑆𝑆𝑟𝑟𝑐𝑐𝑆𝑆
(1)
9 285.0eV (G1) represents the electronic transition from carbon 1s orbital to C=C π* bonding
orbital.8-9, 11, 35-37 The second transition at 292.0eV (G2) represents the electronic transition from carbon 1s orbital to C-C σ* bonding orbital and the third transition at 298.0eV (G3) represents the electronic transition from carbon 1s orbital to C=C σ* bonding orbital.8-9, 11, 35-37
Figure 1.3(b) shows changes in the calculated sp2 content of biochar produced at different carbonization temperatures. The calculated sp2 content increases from 58.0 to 77.6 mol.% when the carbonization temperature increases from 300 to 1,000℃. From the sp2 content plot, two noticeable transitions are observed. The first transition was found at 350℃, with a 4.7 mol.% increase in sp2 content, which was larger than any other temperature step. This result also correlates with the composition analysis, where degradation of the carbohydrate content contributes to an increase in atomic carbon and fixed carbon content.16 Another transition is found between 400 and 500℃, where sp2 content increases by 4.2 mol.%. At this interval, residual biomass components are further degraded and the fraction of carbon in biochar increases.38 This interval shows both a change in sp2 chemical structures and organization as measured by XRD, vide infra. The structure development of biochar is governed by the thermal treatment temperature.39 However, the precise criterion for the biochar structure development was vague due to lack of numerical indicator. Figure 1.3(b) suggests a numerical indicator for the biochar structure development, which is sp2 content as a function of carbonization temperature. This criterion will be helpful for further structure analysis of unknown biochar samples.
10 behaves as a standing wave such that multiple scattering occurs.11 Understanding the multiple scattering is crucial for the analysis of electron energy loss near-edge structure (ELNES) because a large volume of backscattering reflects the local structure of the specimen.31 To obtain a understanding of the multiple scattering phenomenon, an imaginary shell concept is proposed (Figure 1.4(a)). The excited core atom is surrounded by imaginary circles with radius define as the distance from the core atom to nth nearest neighbor atom. The ejected core electron is backscattered at the boundary between two adjacent shells. The contribution of backscattered ELNES modulations is effective within 1nm from the excited core atom.40 The wave number of the ejected electron k obeys the relationship “kR = constant” where R is bond length.17 Therefore, the multiple scattering resonance energy (EMSR) is proportional to the inverse square of R as shown in equation (2).11-12, 41 Here, RMSR is the radius of the secondary shell (2.467 Å) and KMSR is a constant value (1980.8904eVÅ2). The average C-C bond length is the radius of the primary shell, so RMSR value from equation (2) fits into equation (3).
𝐸𝐸𝑀𝑀𝑆𝑆𝑀𝑀 =𝐾𝐾𝑅𝑅𝑀𝑀𝑆𝑆𝑀𝑀
𝑀𝑀𝑆𝑆𝑀𝑀2 (2)
C−C bond length =2 sin(60°) (3)𝑅𝑅𝑀𝑀𝑆𝑆𝑀𝑀
11 average C-C bond length implies that biomass carbonization includes various phase changes. More details will be compared with plasmon excitation results of biochar samples.
3.3.3. Low energy loss and quantum mechanical interpretation of bulk plasmon excitation Bulk plasmon excitation energy loss spectrum appears at the low energy loss region (0 ~ 100 eV). The low energy loss region spectrum of N900 is presented in Figure 1.5(a). The bulk plasmon exciatation energy loss peak (Ep) provides a measure of the order for different carbon materials. The diamond plasmon peak appears at 33 eV, the graphite plasmon peak appears at 27 eV, and the amorphous (or disordered) carbon plasmon peak appears at 25 eV.31, 37 Figure 1.5(b) shows the bulk plasmon excitation energy peak values of biochar. Biochar bulk plasmon excitation energy values are placed in between 22-23 eV, consistent with known disordered carbon.8 The plasmon excitation energy increases until the carbonization temperature reaches 500℃ and then it gradually shifts to a lower energy region. A similar trend from disordered carbon was also reported.8 An electron energy loss peak related to π-π* bonding molecular orbital transition is also observed (5-6 eV), but due to its weak intensity (insulating nature of biochar) and overlap with the zero-loss peak, further data interpretation is not practical.
Physical interpretation of plasmon excitation requires a quantum mechanical approach. Equations for the resonance frequency of plasma oscillation (ωp) and the plasmon energy (Ep) can be derived the Drude model, which explains displacement of a quasi-free electron in a local electric field.
𝜔𝜔𝑆𝑆 =�𝑐𝑐𝑐𝑐 2
𝜀𝜀0𝑚𝑚 𝐸𝐸𝑆𝑆 =ħ𝜔𝜔𝑆𝑆 (4)
12 frequency of plasma directly related to the bulk plasmon energy, which value is proportional to the square root of the electron density.
However, in a real solid, the plasma resonance is strongly confined by the damping due to single electron transitions.31 For the analysis of insulating or semiconducting materials like biochar, the band structure (for crystalline material) or HOMO (highest occupied molecular orbital) – LUMO (lowest unoccupied molecular orbital) structure (for non-crystalline materials) should be considered. As a result, the oscillator strength term, f, is introduced to modify the equation (4).42-43
f =2𝑐𝑐𝑚𝑚𝐸𝐸2ħ2𝑔𝑔𝑎𝑎𝑟𝑟𝑖𝑖2 (5)
𝐸𝐸𝑆𝑆 =ħ�𝑓𝑓𝑐𝑐𝑐𝑐 2
𝜀𝜀0𝑚𝑚 (6)
Eg is an energy gap and ani is an atomic dipole matrix element for the excitation. The energy gap in the nano-sized material is determined by the quantum confinement effect.44 The equation of changing energy gap (ΔEg, equation (7)) induces an equation of changing plasmon energy (ΔEp,
equation (8)).43
∆E𝑔𝑔 =2𝜋𝜋 2ħ2
𝑚𝑚∗𝑑𝑑2 (7)
∆𝐸𝐸𝑆𝑆
𝐸𝐸𝑃𝑃(𝑏𝑏) = 𝜋𝜋2ħ2
𝑚𝑚∗𝐸𝐸 𝑔𝑔(𝑏𝑏)
1
𝑑𝑑2 (8)
13 Based on the equation (8), the inverse square of the average C-C bond length is plotted as a function of plasmon excitation energy in Figure 1.5(c). The bulk plasmon excitation energy is physically related to the average C-C bond length so it indicates the development of a disordered carbon structure during the carbonization and graphitization of biomass. Perfect graphitic structure has a bulk plasmon excitation energy of 27.0 eV with the inverse square of the average C-C bond length (49.5738 nm-2).
3.4. X-ray diffraction analysis of biochar crystalline structure
Background subtracted biochar XRD patterns are plotted together in Figure 1.6(a) and 1.6(b). The N300 biochar XRD pattern is dominated by the crystalline cellulose in the original biomass16, 45 and the pattern is not included in the biochar analysis. Increasing intensity at the (110) reflection is also observed, but the broad FWHM and weak (110) reflection intensity limit the detailed interpretation of this peak. The interlayer spacing distance is derived from the Bragg’s law.46 The layer coherence length of d100 spacing and the average number of graphene layer are derived from the Scherrer equation.8, 47-48 (002) interlayer spacing (average distance between two adjacent planes), (100) layer coherence length (La, average size of carbon crystallite in a plane), and average number of graphene layers in an ordered graphitic stacking, ((𝑑𝑑002) Layercoherencelength
(𝑑𝑑002) Interlayerspacing ) of biochar are calculated.
48 From the Bragg’s law,
d = 2 sin(λ 𝜃𝜃) (9)
14 t =𝛽𝛽cos (𝐾𝐾𝐾𝐾𝜃𝜃) (10)
where t is the layer coherence length (mean size of ordered domain), K is the dimensionless shape factor, β is the FWHM (in radians of theta) of each d spacing, λ is the wavelength of X-ray, and θ is the diffraction angle.8, 47-48 The K value for d002 spacing equals 0.9 and that of (100) spacing equals 1.84.47
15 carbonization temperature step from 800 to 900℃, a crossover between the (002) interlayer spacing distance and the (100) layer coherence length is observed (Figure 1.7(c)). The decrease in the (002) interlayer spacing is consistent with a transition from disordered stacking of graphite layers to more ordered turbostratic stacking. The increase in the (100) layer coherence length supports growth of nano-carbon crystallites.
3.5. STEM HAADF imaging and modeling of nano-carbon crystallite in biochar
STEM HAADF images (all at 500 nm magnification) are shown in Figure 1.8. Images of N300 and N400 biochar show a dense structure with parallel and repeating lines consistent with a dense morphology from the original wood. These images correspond with the BET surface area data, because the BET surface area and micropore are hardly developed below 400℃. N500 biochar shows splitting of the dense structure and the initial formation of primitive fibril-like structures. With biochar N700, there is clear separation of carbon fibril-like structures represented as raised nodes. The N800 and N900 biochars show more separation, twisting, and breaks as the length of carbon fibril structure are shortened. These STEM HAADF images suggest a path for the structural development of nano-carbon crystallites in biochar. Previous biochar structural development models proposed radially growing polyaromatic carbon crystallite.5-6 However, the STEM HAADF images suggest lengthwise growth of carbon crystallite because carbon fibril-like structure is observed from biochar. Increasing (001) layer coherence length also supports a lengthwise growth model.
16 Transition char: The original biomass structure dominates the biochar structure. Transition char has a high fraction of hydrogen, oxygen, and volatiles. The XRD pattern is dominated by the crystalline cellulose structure. The initial degradation of biomass structure between 300 to 350℃ is clearly observed and the increases in carbon, fixed carbon and sp2 content are the highest among any other carbonization temperature step. BET surface area and micropore are not well-developed at this transition char stage. The XRD pattern associated with crystalline cellulose disappears during this transition. There is no evidence for multiple-layer carbon stacking.
Disordered char: A disordered carbon structure appears at 350℃. Residual biomass components only occupy a minor structural fraction. BET surface area and micropore volume start to increase. The average C-C bond length decreases from 0.1434 nm to 0.1425 nm. The sp2 content of biochar gradually increases and the FWHM of the (002) reflection narrows due to degradation of biomass components. Decrease in (100) layer coherence length supports formation of nano-carbon crystallites. The term “amorphous” in pyrolytic carbon material should be used carefully due to the above mentioned reasons.
Composite char: Nano-carbon crystallite begins to grow at 500℃. BET surface area and micropore volume reach their maximum values at 600℃ and then start to decrease. The average C-C bond length remains still at about 0.1420 nm range. The sp2 content continues to increase, while the (100) layer coherence length gradually increases from 2.0 to 2.3 nm and the average number of graphene layer increases from 1.4 to 2.0 layers. The initial nano-carbon crystallite molecular structure can be detected within the composite char phase.
17 bond length decreases from 0.1430 nm to 0.1424 nm. The cross over between (002) interlayer spacing distance and (100) layer coherence length clearly differentiates turbostratic char from composite char. Biochar sp2 content reaches the maximum value seen in this work (78.6 mol.%).
4. Conclusions
18 REFERENCES
(1) Zhang, F.; Wang, K. X.; Li, G. D.; Chen, J. S., Hierarchical porous carbon derived from rice straw for lithium ion batteries with high-rate performance. Electrochem. Commun. 2009, 11, 130-133.
(2) Xie, L. J.; Sun, G. H.; Su, F. Y.; Guo, X. Q.; Kong, Q. Q.; Li, X. M.; Huang, X. H.; Wan, L.; Song, W.; Li, K. X.; Lv, C. X.; Chen, C. M., Hierarchical porous carbon microtubes derived from willow catkins for supercapacitor applications. J. Mater. Chem. A 2016, 4, 1637-1646.
(3) Zhang, J. B.; Zhong, Z. P.; Shen, D. K.; Zhao, J. X.; Zhang, H. Y.; Yang, M.; Li, W. L., Preparation of Bamboo-Based Activated Carbon and Its Application in Direct Carbon Fuel Cells. Energy Fuels 2011, 25, 2187-2193.
(4) Dong, Y. Q.; Zhou, N. N.; Lin, X. M.; Lin, J. P.; Chi, Y. W.; Chen, G. N., Extraction of Electrochemiluminescent Oxidized Carbon Quantum Dots from Activated Carbon. Chem. Mater. 2010, 22, 5895-5899.
(5) Brewer, C. E.; Schmidt-Rohr, K.; Satrio, J. A.; Brown, R. C., Characterization of Biochar from Fast Pyrolysis and Gasification Systems. Environ. Prog. Sustainable Energy 2009, 28, 386-396.
(6) Park, J.; Hung, I.; Gan, Z. H.; Rojas, O. J.; Lim, K. H.; Park, S., Activated carbon from biochar: Influence of its physicochemical properties on the sorption characteristics of phenanthrene. Bioresourc. Technol. 2013, 149, 383-389.
19 (8) Zhang, Z. L.; Brydson, R.; Aslam, Z.; Reddy, S.; Brown, A.; Westwood, A.; Rand, B.,
Investigating the structure of non-graphitising carbons using electron energy loss spectroscopy in the transmission electron microscope. Carbon 2011, 49, 5049-5063. (9) Marriott, A. S.; Hunt, A. J.; Bergstrom, E.; Wilson, K.; Budarin, V. L.; Thomas-Oates, J.;
Clark, J. H.; Brydson, R., Investigating the structure of biomass-derived non-graphitizing mesoporous carbons by electron energy loss spectroscopy in the transmission electron microscope and X-ray photoelectron spectroscopy. Carbon 2014, 67, 514-524.
(10) Jorio, A.; Ribeiro-Soares, J.; Cancado, L. G.; Falcao, N. P. S.; Dos Santos, H. F.; Baptista, D. L.; Ferreira, E. H. M.; Archanjo, B. S.; Achete, C. A., Microscopy and spectroscopy analysis of carbon nanostructures in highly fertile Amazonian anthrosoils. Soil Tillage Res. 2012, 122, 61-66.
(11) Daniels, H.; Brydson, R.; Rand, B.; Brown, A., Investigating carbonization and graphitization using electron energy loss spectroscopy (EELS) in the transmission electron microscope (TEM). Philos. Mag. 2007, 87, 4073-4092.
(12) Craven, A. J.; Garvie, L. A. J., Electron-Energy-Loss near-Edge Structure (Elnes) on the Carbon K-Edge in Transition-Metal Carbides with the Rock-Salt Structure. Microsc., Microanal., Microstruct. 1995, 6, 89-98.
(13) Yao, Y.; Gao, B.; Inyang, M.; Zimmerman, A. R.; Cao, X. D.; Pullammanappallil, P.; Yang, L. Y., Removal of phosphate from aqueous solution by biochar derived from
anaerobically digested sugar beet tailings. J. Hazard. Mater. 2011, 190, 501-507. (14) Singh, B.; Fang, Y. Y.; Cowie, B. C. C.; Thomsen, L., NEXAFS and XPS characterisation
20 (15) Liu, P.; Liu, W. J.; Jiang, H.; Chen, J. J.; Li, W. W.; Yu, H. Q., Modification of bio-char
derived from fast pyrolysis of biomass and its application in removal of tetracycline from aqueous solution. Bioresourc. Technol. 2012, 121, 235-240.
(16) Keiluweit, M.; Nico, P. S.; Johnson, M. G.; Kleber, M., Dynamic Molecular Structure of Plant Biomass-Derived Black Carbon (Biochar). Environ. Sci. Technol. 2010, 44, 1247-1253.
(17) Bianconi, A.; Incoccia, L.; Stipcich, S., EXAFS and near edge structure : proceedings of the international conference, Frascati, Italy, September 13-17, 1982. Springer-Verglag: Berlin; New York, 1983; p xii, 420 p.
(18) Ferrari, A. C.; Robertson, J., Interpretation of Raman spectra of disordered and amorphous carbon. Phys. Rev. B 2000, 61, 14095-14107.
(19) Zhang, M.; Gao, B.; Yao, Y.; Xue, Y. W.; Inyang, M., Synthesis of porous MgO-biochar nanocomposites for removal of phosphate and nitrate from aqueous solutions. Chem. Eng. J. 2012, 210, 26-32.
(20) Franklin, R. E., Crystallite Growth in Graphitizing and Non-Graphitizing Carbons. Proc R Soc Lon Ser-A 1951, 209, 196-&.
(21) Oberlin, A., Carbonization and Graphitization. Carbon 1984, 22, 521-541.
(22) Harris, P. J. F., New perspectives on the structure of graphitic carbons. Crit. Rev. Solid State Mater. Sci. 2005, 30, 235-253.
(23) Béguin, F. o.; Frąckowiak, E. b., Carbons for electrochemical energy storage and conversion systems. CRC Press: Boca Raton, 2010; p xii, 517 p.
21 Carbonization of wood charcoal at high temperature by Al-triisopropoxide. Mol. Cryst. Liq. Cryst. 2002, 386, 33-38.
(25) Thompson, E.; Danks, A. E.; Bourgeois, L.; Schnepp, Z., Iron-catalyzed graphitization of biomass. Green Chem. 2015, 17, 551-556.
(26)McNaught, A. D.; Wilkinson, A., Compendium of chemical terminology. Second ed.; Wiley: 1997.
(27) Emmerich, F. G.; Desousa, J. C.; Torriani, I. L.; Luengo, C. A., Applications of a Granular Model and Percolation Theory to the Electrical-Resistivity of Heat-Treated Endocarp of Babassu Nut. Carbon 1987, 25, 417-424.
(28) Laine, J.; Yunes, S., Effect of the Preparation Method on the Pore-Size Distribution of Activated Carbon from Coconut Shell. Carbon 1992, 30, 601-604.
(29) Standard Test Methods for Proximate Analysis of Coal and Coke by Macro Thermogravimetric Analysis. ASTM International: 2015.
(30) Chmiola, J.; Yushin, G.; Dash, R.; Gogotsi, Y., Effect of pore size and surface area of carbide derived carbons on specific capacitance. J. Power Sources 2006, 158, 765-772. (31) Egerton, R. F., Electron energy-loss spectroscopy in the electron microscope. Third ed.;
Springer: New York, 2011; p xii, 491 pages.
(32) Shafizadeh, F., Introduction to Pyrolysis of Biomass. J. Anal. Appl. Pyrolysis 1982, 3, 283-305.
22 (34) Mansaray, K. G.; Ghaly, A. E., Thermal degradation of rice husks in nitrogen atmosphere.
Bioresourc. Technol. 1998, 65, 13-20.
(35) Muller, J. O.; Su, D. S.; Wild, U.; Schlogl, R., Bulk and surface structural investigations of diesel engine soot and carbon black. Phys. Chem. Chem. Phys. 2007, 9, 4018-4025. (36) Galvan, D.; Pei, Y. T.; De Hosson, J. T. M.; Cavaleiro, A., Determination of the sp(3) C
content of a-C films through EELS analysis in the TEM. Surf. Coat. Technol. 2005, 200, 739-743.
(37) Berger, S. D.; Mckenzie, D. R.; Martin, P. J., Eels Analysis of Vacuum Arc-Deposited Diamond-Like Films. Philos. Mag. Lett. 1988, 57, 285-290.
(38) Kim, K. H.; Eom, I. Y.; Lee, S. M.; Choi, D.; Yeo, H.; Choi, I. G.; Choi, J. W., Investigation of physicochemical properties of biooils produced from yellow poplar wood
(Liriodendron tulipifera) at various temperatures and residence times. J. Anal. Appl. Pyrolysis 2011, 92, 2-9.
(39) Lehmann, J.; Joseph, S., Biochar for environmental management : science, technology and implementation. Second ed.; Routledge, Taylor & Francis Group: London ; New York, 2015; p xxxii, 928 pages.
(40) Wang, F.; Egerton, R. F.; Malac, M.; McLeod, R. A.; Moreno, M. S., The spatial resolution of electron energy loss and x-ray absorption fine structure. J. Appl. Phys. 2008, 104. (41) McCulloch, D.; Brydson, R., Carbon K-shell near-edge structure calculations for graphite
using the multiple-scattering approach. J. Phys.: Condens. Matter 1996, 8, 3835. (42) Hummel, R. E., Electronic properties of materials. 4th ed.; Springer: New York, 2011; p
23 (43) Mitome, M.; Yamazaki, Y.; Takagi, H.; Nakagiri, T., Size Dependence of Plasmon Energy
in Si Clusters. J. Appl. Phys. 1992, 72, 812-814. (44) de Mello Donegá, C., Nanoparticles. Springer: 2014.
(45) Park, S.; Baker, J. O.; Himmel, M. E.; Parilla, P. A.; Johnson, D. K., Cellulose crystallinity index: measurement techniques and their impact on interpreting cellulase performance. Biotechnol. Biofuels 2010, 3.
(46) Iadonisi, G., Introduction to solid state physics and crystalline nanostructures. 1st edition. ed.; Springer: New York, 2013; p pages cm.
(47) Kercher, A. K.; Nagle, D. C., Microstructural evolution during charcoal carbonization by X-ray diffraction analysis. Carbon 2003, 41, 15-27.
30
33 CHAPTER 2
Effect of Chemical Activation on DC Electrical Conductivity of Loblolly Pine derived Activated Carbon
Abstract
Activated carbon is a widely used electrode material produced from biomass. However, the relationship between the electric property and the electronic structure of activated carbon was barely investigated due to its complex structure. We investigated the electronic structure of biochar and activated carbon by physicochemical and quantum mechanical approach. Four activated carbon samples were prepared from loblolly pine-derived fast pyroylsis biochar produced at different carbonization temperatures. Sodium hydroxide (NaOH) was used as a chemical activation agent. CHN analyzer, thermogravimetric analyzer (TGA), BET surface area analyzer, scanning electron microscopy (SEM), electron energy loss spectroscopy (EELS), electron paramagnetic resonance spectroscopy (EPR), and photoelectron spectroscopy (XPS) were used to determine physical, morphological, chemical, and electronic structure of biochar and activated carbon. BET surface area of activated carbon has a logarithmic relationship with the volatile content of precursor biochar. SEM images show appearance and disappearance of microporous structure before and after the chemical activation. The sp2 content increases after the chemical activation while the radical concentration decreases. The overall concentration of carbon-oxygen functional groups increases after the chemical activation. Increasing DC electric conductivity after the chemical activation is closely related to π toπ* transition. Our finding will be helpful for tuning properties of biomass-derived carbon materials for electronic and
34 1. Introduction
Among different types of biomass-derived carbon materials, biomass-derived activated carbon is a key material for energy storage applications. Electric double layer capacitor (EDLC), which is one of major energy storage devices having high power density over lithium ion battery utilizes coconut shell derived activated carbon as an electrode.1-2 Furthermore, enhanced version of EDLC, asymmetric lithium ion capacitor (LIC) also utilizes the biomass-derived activated carbon as an anode.3-4 Because the LIC can obtain both high power density and high energy density, it is emerging as a new energy storage device which can replace conventional energy storage devices. As a result, understanding the relationship between physical/chemical/electronic structures of biomass derived carbon and electric/electrochemical properties of the EDLC is important.
Biomass-derived carbon materials have long been existed with human beings.5 However, their structures are still not well understood due to inherent complexity. Biomass is a fruitful carbohydrate source which is a complex mixture of cellulose, hemicellulose, and lignin. During the carbonization of biomass, biomass experiences four-stage phase transitions.6-7 Phase
transition includes degradation of the crystalline cellulosic structure and appearance of a
35 Unlike precursor biochar which is electrically idle, activated carbon is an electrically active material that it can be used as an electrode material. Activated carbon contains high volume of micropore and large surface area which are generated during the activation process. Higher micropore volume and larger surface area are closely related to higher ionic adsorption, which is a critical factor of high specific capacitance. Not only specific capacitance, electric conductivity is also an important parameter because it is a limiting factor of power density.15 These properties are connected to chemical/physical/electronic structure of activated carbon and we analyzed loblolly pine derived activated carbon with different analytical instruments. CHN analysis and proximate analysis were done to get compositions.6 Scanning electron microscopy (SEM) was used to detect the micropore formation after chemical activation of biochar.14 X-ray photoelectron spectroscopy (XPS) was done to analyze the amount of carbon chemical functional groups and molecular orbital structure in biochar and activated carbon.16-18 Electron energy loss spectroscopy (EELS) was used to obtain carbon sp2 content, carbon-carbon bond length, crystal structure.19-21 Electron paramagnetic resonance (EPR) spectroscopy was used to determine g-factor and relative radicals concentration.22-23
36 instruments, we were able to get fruitful information before and after chemical activation of loblolly pine derived biochar.
Recently published works of EDLC focuses on production of activated carbon with high surface area to obtain high specific capacitance.12 Our previous work of EDLCs made from loblolly pine derived activated carbon showed the possibility of practical application. However, other than the surface area and some chemical information, rest of physical, chemical, and electric properties are poorly interpreted due to the complexity of EDLC system. As a result, we decided to analyze physical, chemical, and electronic structures of biomass-derived activated carbon to track back the origin of electric conductivity.
2. Experimental
2. 1. Biochar and activated carbon sample preparation
Air dried Loblolly pine (Pinus taeda) wood chips were milled into 20-mesh size particle using laboratory Wiley Mill and air dried for 24 hours. OTF-1200X quartz tube furnace (MTI Corporation, Richmond, CA) was used to carbonize the biomass. The furnace was heated from the room temperature to target temperatures (300, 350, 500, and 700℃) at the heating rate of 5℃/min under a constant stream of nitrogen gas (1L/min). After reaching the target temperature, the sample remained in the quartz tube for 15 minutes. The resulting biochar was cooled down under nitrogen flow. The nomenclature of biochar sample is Nxxx where xxx indicates the carbonization temperature.
37 in the quartz tube. In this step, the furnace was heated from the room temperature to 800℃ at 3℃/min. After reaching 800℃, the sample remained in the furnace for 2 hours. After the thermal treatment, the sample was cooled to room temperature under nitrogen flow. The activated carbon was washed with 200ml of 0.1M hydrochloric acid solution followed by deionized water washing, and then dried at 110℃ overnight. The nomenclature of activated carbon sample is Nxxx-AC where Nxxx indicates the precursor biochar.
2.2. Material Composition Analysis
Carbon, hydrogen, and nitrogen content of the biochar and activated carbon samples were quantified by using PerkinElmer 2400 Series II elemental analyzer (PerkinElmer, Waltham, MA). Oxygen content was calculated by difference from 100 percent. Proximate analysis was performed to measure volatile matter, fixed carbon, and ash contents using TA Q500 thermogravimetric analyzer (TA Instruments, New Castle, DE). The specific measurement condition followed modified ASTM D7582-15.27
2.3. BET surface area and micropore volume analysis
38 2.4. SEM Imaging
Verios 460 Field Emission Scanning Electron Microscope (FEI, Hillsboro, OR, USA) was used to collect electron microscopy images of biochar and activated carbon samples. Samples were placed on top of round sample holder covered with carbon tape. Everhart-Thornley low energy electron detector (EDT) was used to capture electrons. Resolutions were 0.6 nm at 2 kV and 1 nm at 500V.
2.5. STEM sample preparation and EELS analysis
39 2.6. X-ray photoelectron spectroscopy analysis
Photoelectron spectrum was collected with XPS/UVS – SPECS System with PHOIBOS 150 Analyzer (SPECS Surface Nano Analysis GmbH, Berlin, Germany). Biochar and activated carbon samples were placed on top of round sample holder. The sample holder was transferred into measurement chamber. Ultra-high vacuum (P < 10-9 mbar) was applied to the measurement chamber for the high resolution. The resolution of PHOIBOS 150 photoelectron analyzer is lower than 1 eV. Magnesium gun was used to generate X-ray. Collected XPS data was analyzed by CasaXPS, Version 2.3.17PR1.1 (Casa Software Ltd., Cheshire, United Kingdom).
2.7. Electron paramagnetic resonance spectroscopy analysis
EPR spectra were recorded by using electron paramagnetic spectrometer (Varian Inc., Palo Alto, CA, USA). 0.001 to 0.005g of biochar and activated samples were wrapped with Kimwipes and placed in a glass sample tube. One side of the glass sample tube was connected to a nitrogen gas cylinder. Before starting the EPR measurement, nitrogen gas was pre-purged into the glass sample tube to removed surface-adsorbed oxygen. Then EPR spectrum was
continuously obtained under nitrogen gas flow. Depending on samples, different gain value was used. Curve fitting and double integral of obtained EPR spectra were done by the instrument attached program. Using double integral, modulation, gain, frequency, and field sweep values, relative radical concentration and g-value were calculated.23, 29
2.8. DC electrical conductivity measurement
40 powder (1 g) was mixed with 1.3ml of polyvinylidene fluoride (PVDF) and
N-Mthyl-2-pyrrolidone (NMP) mixed solution (3% (w/v)). The carbon paste was fabricated into a
cylindrical electrode using a commercial pelletizing system (PerkinElmer, Waltham, MA, USA). 3 ton-pressure was applied and the wet electrode was vacuum dried at 60℃. Conductivity was measured using four-point probe setup. It is assumed that the formulated electrode is fully packed and the anisotropy of material does not influence the electric conductivity.
3. Results and Discussion
3.1. Elemental analysis and proximate analysis
Table 2.1 summarizes the yield and elemental analysis result of loblolly pine derived biochar and activated carbon. The yield and proximate analysis results indicate the weight composition (wt %) of samples and the elemental analysis result indicates the molar composition (mol %). The yield of biochar decreases as the carbonization temperature increases. At 300 °C, the yield of biochar is 78.7 wt %, but it decreases to 18.8 wt % at 700 °C. The elemental analysis result of biochar shows a clear trend of each element. The atomic carbon content increases from 36.1 to 78.0 mol % as the carbonization temperature increases from 300 to 700 °C. The atomic hydrogen content decreases from 45.7 to 16.8 mol % and the atomic oxygen content decreases from 18.1 to 5.0 mol %. The atomic nitrogen occupies small fraction of biochar, but it increases from 0.1 to 0.2 mol %. The proximate analysis result shows a similar trend as the elemental analysis. As the carbonization temperature increases, fixed carbon content of biochar increases from 22.2 to 90.3 wt % while volatile content decreases from 77.2 to 8.5 wt %.
41 between 79.6 and 85.0 mol %. Compared with precursor biochar, atomic carbon content of all activated carbon samples increases. The atomic hydrogen content of all activated carbon samples decreases after the chemical activation and the atomic concentration is in between 5.8 and 10.1 mol %. The atomic oxygen content of activated carbon samples is in between 8.1 and 9.8 mol %. The atomic nitrogen content of activated carbon samples increase as the carbonization
temperature of precursor biochar increases.
Increased ash content after the chemical activation may influenced by the elongated thermal treatment time and intercalated sodium ions. During the chemical activation alkali metals actually intercalate into the carbon structure.30
3.2. BET surface area and micropore volume analysis
Table 2.2 shows BET surface area, micro/meso pore volume, and average pore width of biochar and activated carbon samples. For biochar samples, BET surface area and micro/meso pore volume increase as the carbonization temperature is increased. The BET surface area of biochar produced at 300 °C is only 1.4 m2/g but it goes up to 321.1 m2/g at 700 °C of
carbonization temperature. Our previous study revealed that the change in BET surface area and micropore volume of loblolly pine during the carbonization resembles an asymmetric bell shape curve.6 A similar trend of increasing biochar surface area at increasing carbonization temperature is also reported.7 Average pore width decreased from 24.4 nm to 3.4 nm as the carbonization temperature goes up. Decreasing average pore width of sugarcane bagasse-derived biochar produced at carbonization temperature range between 400 to 800 °C is reported.31
42 is due to reaction between alkali metal and biochar carbon backbone. Chemical reaction
pathways of NaOH activation are known as,32-34 (1) 4NaOH + −CH2 → Na2CO3+ Na2O + 3H2 (2) 6NaOH + 2C→2Na + 2Na2CO3 + 3H2 (3) Na2CO3 → Na2O + CO2
(4) 4NaOH + C→4Na + CO2+ H2O (5) Na2O + C→2Na + CO
(6) Na2CO3 + 2C→2Na + 3CO
NaOH reacts with atomic carbon and alkyl groups attached to the biochar. Na2CO3 formed during the chemical activation further decomposes and generates CO and CO2 gases.34-35 Microporous structure of activated carbon is developed by reactions between reductive CO/H2 gases and carbon backbone structure.35-36 Thermogravimetric analysis shows that the volatile content of precursor material plays an important role for the high BET surface area and the micropore volume of product activated carbon. Figure 2.1 shows a logarithmic relationship between the BET surface area of activated carbon and the volatile contents of precursor biochar. Release of volatile matters and activation result in a synergistic effect on the high BET surface area.37
43 3.3. Scanning electron microscopy imaging
Figure 2.2 shows electron microscopy images of two different biochar samples and corresponding activated carbon samples at 25,000 times of magnification. Image of N300
biochar (Figure 2.2(a)) shows a flat surface where no noticeable pore structure is found. After the chemical activation, numerous pores are generated on surface of carbon backbone. This result corresponds to BET surface area values and micro/meso pore volume values. The SEM image of N700 biochar (Figure 2.2(c)) shows an uneven surface structure with 3-dimensional objects which supports the relatively high BET surface area and micro pore volume. However, when it is chemically activated, the surface structure becomes flat and no clear evidence of pore structure is found. SEM images, BET surface area, and micro/meso pore volume data altogether elaborate the transition in carbon structure during the carbonization and chemical activation process. A similar porous structure was found from other biomass-derived activated carbon.37-39
3.4. Electron energy loss spectroscopy analysis
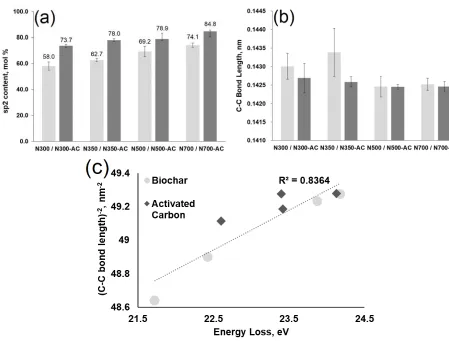
Carbon core level and zero/low energy level electron energy loss spectrum are listed in Figure 2.3 and 2.4. EELS analysis methods of the carbon sp2 content and the carbon-carbon bond length can be found from our previous work.6 Calculated sp2 content of biochar and activated carbon samples is given in Figure 2.5(a). As the carbonization temperature increases from 300 to 700 °C, the sp2 content of biochar increases from 58.0 to 74.1 mol %. The chemical activation method was effective for enhancing the sp2 content of biochar. After the chemical activation, the sp2 content increases from 58.0 to 73.7 mol % (N300), 62.7 to 78.0 mol % (N350), 69.2 to 78.9 mol % (N500), and 74.1 to 84.8 mol % (N700). Increasing sp2 content after the chemical
44 content after the chemical activation of biochar.40 The highest increment in sp2 content after the chemical activation is 15.7 mol % of N300 biochar followed by 15.3 mol % of N350.
Considering biochar samples with high volatile content produced high BET surface area
products, the release of volatile matter is also related to formation of sp2 bond within the biochar. The sp2 content is an important factor regarding the adsorption property of activated carbon. Usually the adsorption performance is highly influenced by the surface area and pore structure, but it is also reported that π-π EDA (electron donor-acceptor) interaction governs the adsorption of aromatic substrates on biochar.41
Calculated carbon-carbon bond length is given in Figure 2.5(b). Ideal carbon-carbon single bond is 0.1540 nm and carbon-carbon double bond is 0.1340 nm. After the chemical activation, carbon-carbon bond length decreases from 0.1430 to 0.1427 nm (N300), 0.1434 to 0.1426 nm (N350), 0.1425 (0.14246) to 0.1425 (0.14245) nm (N500), and 0.1425 (0.14252) to 0.1425 (0.14246) nm (N700). From our previous study of biomass carbonization,6 the inverse square of carbon-carbon bond length has a linear relationship with the surface plasmon excitation energy. When plotted the inverse square of carbon-carbon bond length of biochar and activated carbon as a function of the surface plasmon excitation energy (Figure 2.5(c)), a linear
45 3.5. Electron paramagnetic resonance spectroscopy analysis
Figure 2.6 shows EPR spectrum of biochar and activated carbon samples. The g-factor was calculated from double integral value derived from EPR spectrum. The g-factor is an important parameter which can classify the type of free radicals.43-45 The relative EPR intensity (integration of EPR spectrum) of biochar samples increases from 4.19 (N300) to 55.3 (N350) to 250 (N500) to 361 (N700) as the carbonization temperature increases from 300 to 700°C. After the activation, the relative EPR intensity decreases from 52.1 (N300-AC) to 4.48 (N350-AC) to 7.90 (N500-AC) to 5.65 (N700-AC). The g-factor of EPR distinguishes the type of free radicals whether a radical is originated from oxygen-centered radicals (semiquinone radical anions) or from carbon-centered radicals (aromatic radicals).45 Calculated g-factor values of biochar samples are 2.0032 (N300), 2.0022 (N350), 2.0024 (N500), and 2.0021 (N700) and calculated g-factor values of activated carbon samples are 2.0015 (N300-AC), 1.9963 (N350-AC), 2.0021 (N500-AC), and 1.9945 (N700-AC). Oxygen-centered radicals are found from the g-factor range above 2.0040 and carbon-centered radicals are found from the g-factor range below 2.0030.44-45 N300 biochar has oxygen and carbon combined radicals because its g-factor value is in between 2.0030 and 2.0040. Rest of biochar samples have carbon-centered radicals. After the activation of biochar samples, g-factor values of corresponding activated carbon samples decrease. This transition implies that the fraction of carbon-centered radicals have increased after thermal treatment and chemical activation. The g-factor values of carbonized babassu coconut endocarp decreased from 2.0037 to 2.0023 as the carbonization increased from 200 to 2,200°C.46
Decreasing g-values of biochar and activated carbon samples follow this trend.
46 concentrations of radicals in activated carbon samples are 5.21 x 10⁵ (N300-AC), 4.48 x 10⁴ (N350-AC), 7.90 x 10⁴ (N500-AC), and 5.65 x 10⁴ spins/g (N700-AC). As the carbonization temperature increases, the relative radical concentration increases due to delocalization of π -radicals (unpaired electron) bound to aromatic rings.46-47 However, other than N300-AC biochar, the chemical activation of biochar reduces the concentration of radicals while the DC electric conductivity of each activated increases. The relationship between the radical concentration and DC electric conductivity will be further discussed in section 3.7.
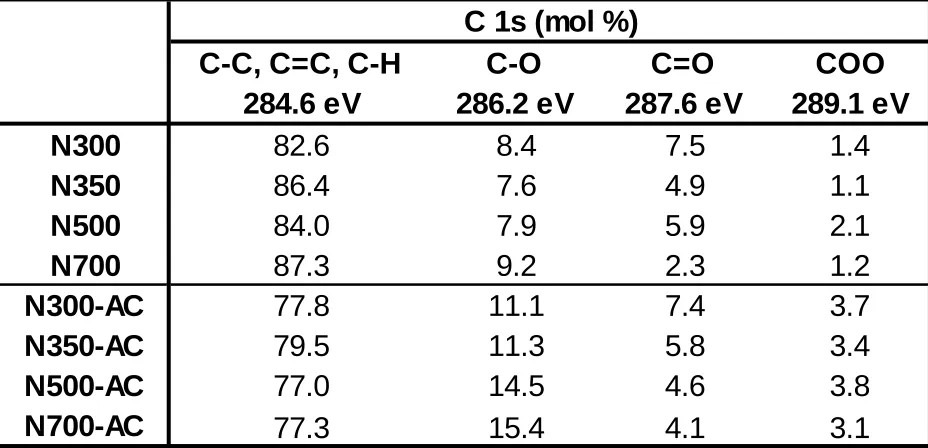
3.6. X-ray photoelectron spectroscopy analysis
Table 2.3 shows the quantified XPS analysis of carbon 1s in biochar and activated carbon samples. C 1s XPS spectra of biochar and activated carbon samples are given in Figure 2.7. A typical C 1s spectrum of XPS can be deconvolved into five different spectra, each representing specific carbon related bonding.16-18 The deconvolved spectrum at 284.6 eV represents C-C, C=C, C-H bonding, the spectrum at 286.2 eV represents C-O bonding, the spectrum at 287.6 eV represents C=O bonding, the spectrum at 289.1 eV represents COO bonding, and the spectrum at 290.6 eV represents π to π* shake-up transition. 17-18
47 similar to that of biochar samples. The signal intensity from π to π* shake-up transition will be discussed in section 3.7.
3.7. DC electric conductivity and π to π* transition
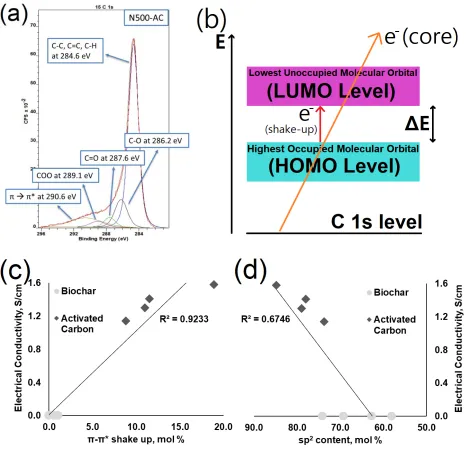
Figure 2.8(a) shows the deconvolved C 1s spectrum of N500-AC. Unlike sp3-dominating carbon molecules, carbon molecules with fruitful sp2 bonds have a shake-up peak at 290.6 eV which represents π (HOMO) to π* (LUMO) transition.17-18 Figure 2.8(b) illustrates the quantum mechanical schematic of the shake-up peak generation. The shake-up peak is a result of atomic electron transition by the photoelectron.48 Kinetic energy of the photoelectron is transferred to an atomic electron that the atomic electron moves to a higher unoccupied state.48 During the
transition, the escaping core electron (orange line) excites an electron at the π molecular orbital to the π* molecular orbital. This molecular orbital transition is also similar as the transition from
valence band to conduction band at solid materials.49
Measured DC electric conductivity of biochar and activated carbon samples were 0.000 S/cm (N300, N350, N500), 0.001 S/cm (N700), 1.140 S/cm (N300-AC), 1.410 S/cm (N350-AC), 1.300 S/cm (N500-AC), and 1.580 S/cm (N700-AC). Considering the DC electric conductivity values, biochar samples were insulator and activated carbon samples were semiconductor. When the DC electric conductivity is plotted as a function of π to π* transition signal intensity (Figure
2.8(c)) and as a function of the sp2 content (Figure 2.8(d)), the pair between DC electric
conductivity and π to π* transition signal intensity shows a good correlation. An explanation for
48 solid physics, the transition between valence band (HOMO) and conduction band (LUMO) gives a clue to this electronic transition.51 As a result, activated carbon with higher DC electric
conductivity is assumed to have a narrower energy gap (ΔE) that more electron transitions can
occur.
Dunne et al. suggested an electrical conductivity mechanism of annealed and unannealed fullerene soot as tunneling and hopping between localized states based on EPR observations.22 Electrical charges flow by the tunneling of carriers between conductive islands which are also called as graphitic crystallites. As a result, increasing radical concentration had a positive correlation with the electric conductivity of fullerene soot. However, in case of activated carbon and biochar, the DC electric conductivity and the radical concentration have a poor correlation. The poor correlation can be interpreted as the biochar and activated carbon does not have a well-developed conductive islands structure which is supported by our previous studies.6, 12 From the instrumental analyses, biochar and activated carbon only had a primitive or very poor graphitic structure. It can be concluded that increasing DC electric conductivity of activated carbon is attributed to the development of graphitic structure rather than increasing radical concentration.
4. Conclusions
49 connection between electronic structure and physical structure. Finally the DC electric
50 REFERENCES
(1) Wang, K.; Zhao, N.; Lei, S. W.; Yan, R.; Tian, X. D.; Wang, J. Z.; Song, Y.; Xu, D. F.; Guo, Q. G.; Liu, L., Promising biomass-based activated carbons derived from willow catkins for high performance supercapacitors. Electrochim Acta Electrochim Acta 2015, 166, 1-11.
(2) Jain, A.; Xu, C. H.; Jayaraman, S.; Balasubramanian, R.; Lee, J. Y.; Srinivasan, M. P., Mesoporous activated carbons with enhanced porosity by optimal hydrothermal pre-treatment of biomass for supercapacitor applications. Micropor Mesopor Mat Micropor Mesopor Mat 2015, 218, 55-61.
(3) Cericola, D.; Kotz, R., Hybridization of rechargeable batteries and electrochemical capacitors: Principles and limits. Electrochim Acta 2012, 72, 1-17.
(4) Naoi, K.; Ishimoto, S.; Miyamoto, J.; Naoi, W., Second generation 'nanohybrid
supercapacitor': Evolution of capacitive energy storage devices. Energ Environ Sci 2012, 5, 9363-9373.
(5) Jorio, A.; Ribeiro-Soares, J.; Cancado, L. G.; Falcao, N. P. S.; Dos Santos, H. F.; Baptista, D. L.; Ferreira, E. H. M.; Archanjo, B. S.; Achete, C. A., Microscopy and spectroscopy analysis of carbon nanostructures in highly fertile Amazonian anthrosoils. Soil Tillage Res. 2012, 122, 61-66.