S T U D I E S OF THE STREPTOMYCIN-RESISTANCE S Y S T E M O F M U T A T I O N S I N E. C O L I * ?
M. DEMEREC
Department of Gettetics, Camegie Znstitzltiort of Washington, Cold Spring Harbor, New York
Received December 3, 1950
N I Q U E opportunities for the study of mutations, both spontaneous and
U
induced, have been offered by what we may call the " phage-resistancesystem '? of bacterial changes from sensitivity to resistance to bacteriophages.
In studying this system it is easy to work with large numbers of bacteria ( 1 x 10⁸ per Petri dish) ; and if sufficient quantities of phage are added, all sensitive bacteria will be eliminated whereas the resistant will survive and form colonies. A spontaneous mutation rate of about 1 x can easily be measured by this method, and induction of mutations at a rate as low a s 1 x can be detected. It has been used in a considerable amount of re- search dealing with spontaneous mutability and mutability induced by X-rays, ultraviolet rays, and chemicals. In fact, for several years it was the only known method of obtaining quantitative measurements of low mutation rates. For some time I have been on the lookout for another system, capable of being studied by similar quantitative methods, that would serve to check and confirm results obtained with the phage-resistance system. W e now have found that mutations resulting in resistance to and dependence on strepto- mycin, and back-mutations to nondependence, have certain advantages over phage-resistance mutatipns for use in quantitative studies of mutability. I will describe here the results of several studies of spontaneous and induced mutability based on this streptomycin-resistance system. Summaries of these studies have been published in the Carnegie Institution of Washington Year Books Nos. 48 and 49 (DEMEREC, WALLACE,
WITKIN
and BERTANI 1949; DEMEREC et al. 1950).M A T E R I A L A N D NOMENCLATURE
The experiments were made with Strain B / r of Escherichia. coli, which is a radiation-resistant mutant of strain B (WITKIN 1947). Its resistance to radiation was a distinct advantage in the irradiation experiments, for it per- mitted treatment with higher doses. In one experiment we used strain B / r / 6 , a mutant of B / r that is resistant to phage 6 of the T series. Several other phages of the T series were used in tests made to-detect and eliminate possible contaminations.
*Part of the cost of the accompanying tables has been paid by the GALTON AND
+
This study was conducted in part under a grant from the AMERICAN CANCER SOCIETY, MENDEL MEMORIAL FUND.through the COMMITTEE ON GROWTH of the NATIONAL RESEARCH COUNCIL.
GENETICS 36: 585 November 1951.
586 M. D E M E R E C
Dihydrostreptomycin sulfate was used in the preparation of media con- taining the desired concentrations of streptomycin.
This paper will employ the system of nomenclature described previousIy (DEMEREC and FANO 1945). The symbol B represents the original strain of E. coli, a bar (/) indicates " resistant to," and the symbols following the bar
stand for materials to which the mutant of strain B is resistant. Thus B / S is a mutant of strain B resistant to streptomycin; B/Sd is a mutant not only resistant to but dependent on streptomycin. Numbers indicate phages of the T series ( T I , T2,
. . .
T 7 ) ; B / l is thus a mutant of strain B resistant to phage T1. Since B / r was the strain used in all' these experiments (except number 13 of table 2), the mutants studied were actually B / r / S and B/r/Sd. F?r the sake of simplicity, however, the '' r " symbol will be omitted through-out the paper. Capital R is the symbol for reversions (back-mutations) from dependence ( B / S d ) to nondependence.
ACTION OF STREPTOMYCIN O N E. COLI
It was of interest first to determine the toxic effect of streptomycin on E.
coli. Previous experiments ( DEMEREC 1948) had shown that concentrations up to 1.5 micrograms per milliliter do not kill bacteria grown in an aerated broth culture. With increasing concentrations between 1.5 and 20 pg, the number of survivors decreases rapidly to about 6 per 10s. Beyond this point, continued increases have very little further effect on the proportion of sur- vivors. The earlier experiments had shown that bacteria surviving concentra- tions higher than about 4 pg per ml are mutants that have greater resistance to streptomycin than the parent strain. Survivors of concentrations of 20 g
are regarded here as completely resistant.
That streptomycin kills bacteria before a division is accomplished is sug- gested by the experiments summarized in table 1. In these experiments sam-
TABLE 1
Percent of survivors among resting bacteria kept for various periods in broth containing different concentrations of s t r e p t m y c i n at 37O C.
% of survivors after exposures of Concentration of
streptomycin
60 80 100 120 140 180 24
(P6/ml) minutes hours
3 93 100 79 67
<
0.6*4 100 78 a4 67
<
0.75 100 81 85 78
<
0.86 93 85 65 37
<
0.67 94 a4 59 47 33
<
0.310 76 65 62 41 20
<
0.312 76 68 51 30 11
<
0.4<
0.4 25 <0.315 88 69 53 32
20 66 46 38 26 15
*Living bacteria were not found in samples originally containing between 130
STREPTOMYCIN RESISTANCE
587
ples of about 16,000 bacteria were placed in tubes containing5
ml of broth to which streptomycin had been added in the quantities indicated. The tubes were incubated at 37"C, and at stated intervals 0.1-ml samples were plated to determine the number of living bacteria present in the cultures. Results showed that the number of living bacteria decreased with the length of ex- posure to streptomycin. Microscopic observations of bacteria plated on broth agar containing5
pg of streptomycin per ml did not reveal any divisions in the bacteria so exposed. From this it can be inferred that killing by strepto- mycin does not require division of the bacteria, and that in th'is respect streptomycin differs from penicillin.SPONTANEOUS MUTABILITY
Rate of mutation to streptomycin resistance. LURIA and DELBRUCK (1943) developed two methods for measuring low mutation rates in bacteria. Both methods use a large number of small independent cultures, started from inocula small enough not to include any mutants, and register the mutants present in these cultures after bacterial growth has stopped. One method cal- culates mutation rate from the percentage of cultures containing no resistant mutants, the other from the average number of mutants per culture. A pre- requisite of the second method is that the mutant bacteria divide at the same rate as nonmutants. Since this is not true of streptomycin-resistant mutants, only the first method can be used in our work. The formula yielding the mu- tation rate ( a ) per bacterial generation is:
in which N represents the'average number of bacteria per culture, and
p
the percentage of cultures containing no resistant mutants.The data of four experiments .are given in table 2. Two of these used strain B / r , one strain B/6, and one strain B / r / l . To isolate resistant mu- tants, the whole content of each of the independent cultures was plated into agar containing 25 pg of streptomycin per ml. The results of these experi- ments indicate that the mutation rate is about 1 x per bacterial genera- tion, and that it is not appreciably affected by the strain used in tests.
TABLE 2
Distribution o f numbers of strcptomycin-resistant mutants in a s e r i e s of similar
cultures in 1 ml synthetic medium.
Experiment No. and Strain
11 B/r
12 B/r
13 B/6
14 B/r/l
Resistant bacteria No. of cultures
~ ~-
~~ ~
0 25 56 19 63
1 17 22 25 18
2 12 10 21 6
3 8 6 21 0
5 2 0 2 1
6-10 3 4 4 0
10-50 1 0 1 3
50-100 0 0 0 1
>
100 1 0 0 9Total 71 103 102 103
Aver. no. bacteria (X l @ ) 1.35 0.48 0.44 0.28
Mutation rate (X lo4) 0.73 0.91 2.6 1.3
,4 2 5 9 2
Different dependent ( B / S d ) and nondependent resistant ( B / S ) mutants differ considerably in their rates of growth. Many of them are "slow growers "-that is, types that when plated on broth-agar medium require 48 hours or longer to develop colonies of the size reached by the original strain in 24 hours.
Growth rates of nine B / S d and two B / S strains were studied by inoculat- ing broth with bacteria, incubating the cultures at 37"C, and removing sam- ples at intervals to assay the number of bacteria. The concentration of streptomycin in the medium in which the B/Sd strains were grown was 10
pg per ml. The lag period-that is, the time required for doubling the original number of bacteria-varied in these nine strains from 110 to 210 minutes; and the time taken for completion of one division varied from 45 to 100 minutes. Since the lag period for the B / r strain is 60 minutes, and a division is completed in about 20 minutes, it is evident that these B/Sd mutants, selected at random, required a considerably longer time both to start grow- ing and to complete a division. The two B / S strains were grown in broth without streptomycin and in broth containing 10 pg of streptomycin per ml. The presence or ahsence of streptomycin made no difference in the growth of these two strains. For both, the lag period was about 65 minutes and the division time about 25 minutes.
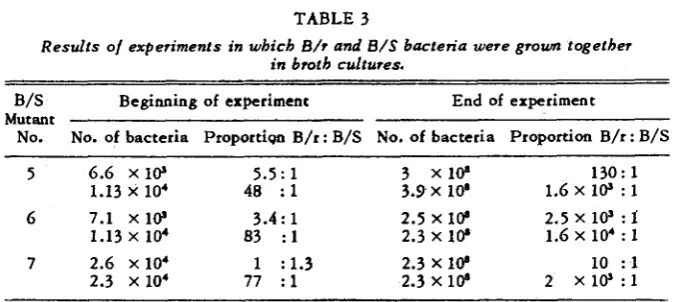
Three other mutant strains of B / S were grown in mixtures with B/r, to test their survival values when competing with the original strain. Results of these tests, given in table 3, show that all three were at a disadvantage as compared with B/r.
STREPTOMYCIN R E S I S T A N C E 589
TABLE 3
Results of experiments in which B/r and B/S bacteria were grown together in 670th cultures.
B/S Beginning of experiment End of experiment
No. No. of bacteria Proportion B/r : B/S No, of bacteria Proportion B/r : B/S Mutant
~~ ~- ~~~ ~ ~~
5 6.6 x i @ 5.5: 1 3 x 1 @ 130: 1
1.13 x 10⁴ 48 : 1 3.3x lo' 1.6 X 10' : 1
6 7.1 X 10' 3.4: 1 2.5 X lb 2.5 X 10' : f
1.6 x 10⁴ : 1
1.13 x 10⁴ 83 : 1 2.3 X lb
7 2.6 x 10⁴ 1 : 1.3 2.3 X lb 10 : 1
2.3 x 10⁴ 77 : 1 2.3 X 10' 2 X 1 0 ' : l
In such a medium the B / S d bacteria divided only a few times and the R / S grew at a slower rate.
Back-mutations from dependence to nondependence. When bacteria of a B / S d strain are plated on agar containing no streptomycin, they undergo one or several normal divisions, and then in some strains pass through several additional abnormal divisions, giving rise to elongated filaments o r '* snakes,''
which increase in length up to about ten times the length of a bacterium and then stop growing. Observations made by BERTANI (1951) indicate that mu- tations to nondependence occur during the normal divisions but not in the filaments. Mutant cells are able to grow normally on the broth-agar medium,. and form colonies.
The number of divisions is influenced by several environmental factors, chiefly by the amount of streptomycin present in the medium in which the bacteria were cultured, and to a lesser degree by the number of bacteria plated on the agar. If these conditions are kept constant, the average number of di- visions for any one strain will also be constant. The different strains, however, show striking differences with regard to the number of normal and abnormal divisions they pass through.
The dependent strain B / S d - 4 was used in our studies of spontaneous and induced back-mutations (reversions). Various biological properties of this strain have been investigated in detail by BERTANI (1951). Here I will give a brief summary of the procedure followed in experiments to be mentioned in this paper.
590 M. DEMEREC
96 hours of incubation. An increase in number of back-mutants was observed between the 48-hour and 72-hour scorings, but there was no further increase at 96 hours.
Under the circumstances described above, B/Sd-4 bacteria pass through 2.7 normal divisions before beginning the formation of snake-like filaments. ,\fter 72 hours of incubation, a plate on which about 5 x lo7 bacteria have been spread will show, in addition to a very thin layer of growth on the surface, a few scattered colonies representing mutants. A count of these colonies will determine how many mutations to nondependence have occurred ; and if the number of plated bacteria is known the mutation rate per specified number of bacteria can be calculated. An estimate of the mutation rate per bacterial division can be obtained by dividing the mutation rate per plated bacteria by a factor of 6, which represents an estimate of the increase in number of B/Sd-4 bacteria raised on 10 pg of streptomycin per ml when plated on medium without streptomycin. The factor is greater than 6 if the bacteria are raised in a medium containing more than 10 p g of streptomycin per ml.
The rate of spontaneous mutation of B/Sd-4 to nondependence is about 1.4 x per bacterial generation. Detailed data are given by BERTANI (1951).
MUTATIONS IN B/Sd-4 INDUCED BY RADIATIOKS
Ultraviolet rays. Bacteria raised in an aerated culture containing broth and 10 pg of streptomycin per ml were used in these experiments. The procedure was as follows:
(1) Bacteria were washed in saline to remove excess streptomycin. ( 2 ) Bacterial suspension was assayed by plating, to determine concentra-
tion.
( 3 ) Five control plates were started by plating 0.1 nil of a dilution of bacterial suspension on broth-agar plates, to determine spontaneous mutation rate.
( 4 ) A thin layer (about 7 ml) of bacterial suspension in saline was placed in the bottom part of a Petri dish and exposed to ultraviolet rays from a germicidal lamp (2537
A ) , with continuous shaking during
exposure.( 5 ) A sample of the irradiated suspension was assayed to determine the proportion of bacteria surviving treatment. Dosage was calculated from the survival ratio (using the chart published by DEMEREC and LATARJET 1946) and the exposure time.
(6) 0.1-nil samples of the irradiated suspension were plated on broth-agar plates to determine the frequency of mutations induced in the treated bacteria
.
( 7 ) Assay plates were scored after 24 hours of incubation at 37°C; and control and experimental plates were scored, after 72 hours of in- cubation.
( 8 ) Frequency of induced mutations per 108 bacteria plated was computed.
'
STREPTOMYCIN RESISTANCE 591 Microscopical examination of irradiated B/Sd-4 bacteria revealed that they divide on broth-agar medium to the same extent as nonirradiated bacteria, so that the same factor can be used for computing mutation rate per bac- terial division.
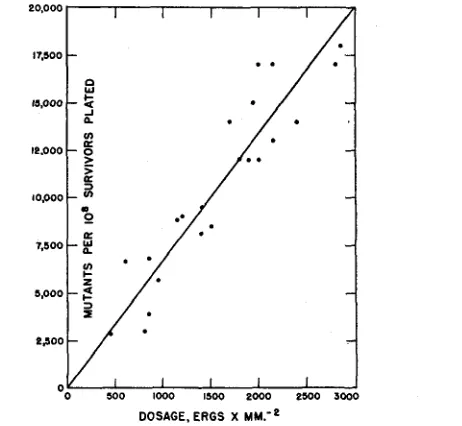
Data on the numbers of mutations induced by different doses are given in table 4 and presented graphically in figure 1. These results will be considered in the Discussion.
X-rays. Except for the actual treatment of bacteria, the procedure used in X-ray experiments was identical to that used with ultraviolet. Treatment was given in small glass test tubes, each containing 4.5 ml of bacterial suspension. As a rule, nine test tubes were exposed simultaneously and then removed one
r0,ooo I I I I I
DOSAGE. ERGS x M M . ' ~
FIGURE 1.-Plot of data on mutants (both sensitive and resistant) induced by treating strain B/Sd-4 of E. coli with different doses of ultraviolet rays (2537 A).
by one at intervals representing the desired length of exposure. Intensity of the X-rays was measured with a Victoreen dosimeter, and the dosage was determined by length of exposure. The X-ray machine was run a t 140 kv and 8 ma. At the exposure distance used, the dose was about 30 roentgens per second.
The results of the X-ray experiments are summarized in table 5 and pre- sented graphically in figure 2.
MUTATIONS I N B / r INDUCED BY ULTRAVIOLET RADIATION
Extensive testing showed that induced mutants cannot be observed if
DEMEREC
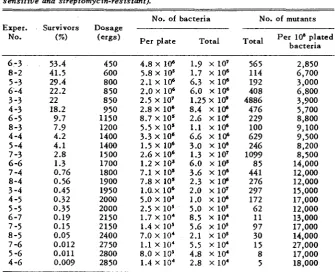
TABLE 4
Summary o/ experiments w i t h B/Sd-4 on relation b e t w e e n d o s e o/ ultraviolet radiation (2537 A ) and number o/ induced nondependent mutants (both streptomycin- s e n s i t i v e and streptomycin-resistant).
_ _ _ ~
No. of bacteria No. of mutants Exper. , Survivors Dosage
Per 10' plated
(%) (ergs) Per plate Total Total bacteria
No.
6 -3 8 -2
5 -3
6'-4 3 -3 4 -3 6 -5
8 -3 4 -4
5 -4 7 -3 G -6 7 -4
8-4
3 -4 4 -5
5 -5
6 -7 7 -5
8-5 7 -6
5 -6 4 -6 53.4 41.5 29.4 22.2 22 18.2 9.7 7.9 4.2 4.1 2.8 1.3 0.76 0.56 0.45 0.32 0.35 0.19 0.15 0.05 0.012 0.011 0.009 450 600 850 8 50 950 1150 1200 1400 1400 1500 1700 1800 1900 1950 2000 2000 2150 2150 2400 27 50 2800 2850 8ao
4.8 x
la
2.1 x 10" 2.0 x 10"
2.8 X l o 6
5.8 x 10⁵
2.5 x 10⁷
8.7 x 10⁵
5.5 x 10⁵
3.3 x 10" 1.5 X 10"
2.6 X 10" 1.2 x 10⁵ 7.1 x 10⁵ 7.8 x 10⁵
5.0 x 10⁵ 2.5 x 10⁵ 1.7 x i o 4
1.4 x 10⁵ 7.0 x 10⁴ 1.1 x 10. 8.0 x 10³ 1.4 x 10⁴
l.o.x l o 6
1.9 X l o 7 565
1.7 X 10" 114 6.3 X l o 6 192 6.0 X lo6 408 1.25 X lo9 4886 8.4 x 10⁶ 476 2.6 X 16 229
1.1 x 16 100 6.6 x 16 629 3.0 X 10" 246 1.3 X lo7 1099 6.0 x 10⁵ 85 3.6 X 10" 441 2.3 X 10⁶ 276
1.0 X 10" 172
5.0 x 10⁵ 62 8.5 x 10⁴ 11 5.6 x 10⁵ 97 2.1 x 10⁵ 30 5.5 x 10⁴ 1 5 4.8 x 10⁴ 8 2.8 x 10⁴ 5
2.0 x 10⁷ 297
3000
3500T---7
-2500
1:
2,850 6,700 3,000 6,800 3,900 5,700 8,800 9,100 9,500 8,200 8,500 14,000 12,000 12,000 15,000 17,000 12,000 13,000 17,000 14,000 27,000 17,000 18,000
DOSAGE, ROENTGENS x io4
S T R E P T O M Y C I N R E S I S T A N C E 593
T A B L E 5
Summary of experiments w i t h B/Sd-4 on relation between X-ray dosage and num- ber o f induced nondependent mutants (both streptomycin-sensitive and streptomycin- resistant).
No. of bacteria No. of mutants Exper. Dosage Survivors
Per lo8 plated
No* (roentgens) (%) Per plate Total Total bacteria
~~ ~~
3 -3 6,000 52.5 1.6 x lo' 3.2 X lo' 1464 46
3 -5 44,000 0.66 2.0 x 10⁷ 4 . o ~ 107 1128 2820 1-4 46,000 0.491 1.1 x
lo6
1.1 X lo7 127 11703 -6 64,000 0.063 1.9 X 10' 1.6 X lo7 446 2870 2 -6 68,000 0.04 1.5 X 10' 1.5 X lo7 311 2080 2 -7 90,000 0.00306 1.14 X los 1.1 X 1@ 38 3460 1 - 3 22,000 8.85 2.0 x 10⁶ 2 . 0 ~ 107 147 73 5
pressed. The following technique was developed for studies of such induced mutations :
The culture was assayed by plating, to determine the concentration of bacteria. When ultraviolet treatment was to be given, bacteria were cultured in transparent synthetic medium ( M 9 ) .
A thin layer of bacterial suspension was irradiated, with continuous shaking.
A sample of the irradiated suspension was assayed by plating to de- termine the proportion of survivors.
Samples were plated on broth agar containing 25 p g of streptomycin per ml, to determine the " background " number of resistant mutants
present.
Samples were plated on plain broth agar and incubated for a certain period ( 2 hours or longer) so that the bacteria would divide. Since the lag period varies with dosage, the incubation period was adjusted accordingly.
After incubation, the plates were refrigerated to stop growth.
Growth of the bacteria during incubation was determined on 3 plates by washing with 10 ml of broth and assaying the suspension.
Onto each of the remaining plates was poured 4 ml of soft agar (0.7 percent) containing 200 p g of streptomycin per ml. After the agar had set these plates were kept at 16°C for 2 hours, allowing time for the streptomycin to act on sensitive bacteria. The plates were then incubated at 3?"C, and after 48 hours the colonies were counted. Under these circumstances, only resistant bacteria survive and form colonies ; therefore, after the number of background mutants had been deducted, the counts showed the number of induced mutants that were present afiter the treated bacteria had multiplied a definite num- ber of times.
M. DEMEKEC
survivors. A fresh culture of bacteria was used for each experiment. Exami- nation of the table shows that the total number of mutants in any one experi- ment depended not only on the dose used in treatment but also on the sub- sequent stage of division at which mutants were scored. Since it would be a very difficult and laborious process to obtain material that had received dif- ferent treatments but undergone the same number of divisions after treatment, the material and method described here are not suitable for quantitative studies of induced mutations. In this case it is not feasible to work with " end-
point " mutants, as has been done successfully in studies with phage resistance
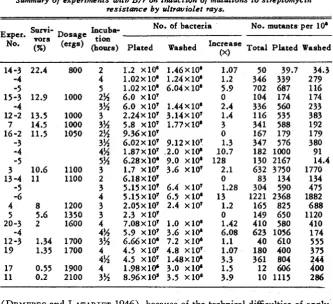
TABLE 6
Summary of experiments with B/r on induction o/ mutations lo streptomycin resistance b y ultraviolet rays.
~~~~~ ~ ~
No. of bacteria No. mutants per 10.
[T
(ergs) (hours) Plated Washed Increase Total Plated Washed Incuba-Exper. survi- Dosage tion
(XI 14 -3 -4 -5 15-3 -4 12 -2 7 16 -2 -3 -4 -5 3 13 -4 -5 -6 4 5 20-3 -4 12-3 19 17 11 22.4 12.9 13.5 14.5 11.5 10.6 11 8 5.6 2 1.34 1.35 0.55 0.2 800 1000 1000 1000 1050 1100 1100 1200 1350 1600 1700 1700 1900 2100 2 4 5 2% 3% 3 3% 2% 3% 4% 5% 3 2 3 4 3 3 4 4% 3% 4 4% 4 3%
1.2 X10' 1.46X10' 1.02X 10' 1.24XlO' 1.02 x 10' 6.04 x 10'
6.0 xi07
6.0 X10⁷ 1.44X10' 2.24X 10' 3.14X10' 5.8 X10⁷ 1.77X10' 9.36 x 10⁷
6 . 0 2 ~ 107 9.12~107 1.87X10⁷ .2.0 X10' 6.28x'1O6 9.0 X10' 1.7 X10' 3.6 X10'
5.15X10' 6.4 X10⁷ 5 . 1 5 ~ 1 0 ~ 6.5- xlD'
2.O5X1O7 2.4 X10⁷ 2.3 X10'
7.08X 10' 1 .O X lO' 6 . 1 8 ~ 107
5.9 xi07 3.6 xi08
4.5 xi07 4.8 xi07 6 . 6 6 ~ 1 0 ~ 7.2 x10⁶
4.5 XlO' 1.48X10' 1.98X10' 3.0 X10⁶ 8.96X10' 3.5 X10"
1.07 1.2 5.9 0 2.4 1.4 3 0 1.3 10.7 128 2.1 0 1.28 13
1 *2
0 1.42 6.08 1.1 1.07 3.3 1.5 3.9
50 39.7 346 339 702 687 104 174 336 560
116 535 341 588 167 179 347 576 182 1000 130 2167 632 3750 83 134 304 590 1221 2368 165 825 149 650 410 580 623 1056 40 610 180 400 361 804 12 606 10 1115
34.3 2 79
116
1 74 2 33 3 83 192 179 3 80 91 14.4 1770 134 475 1882 688 1120 410 174 5 55 375 244 400 286
(DEMEREC and LATARJET 1946), because of the technical difficulties of apply- ing streptomycin to colonies of cells after they have reached a certain size. One of the main requirements of the method is that cells belonging to differ- ent colonies not be mixed together when the streptomycin is applied; and a suitable way of preventing this, after the number of cells per colony has increased beyond a certain stage, has not yet been. found.
STREPTOMYCIN RESISTANCE 595 1.5. The data of these experiments are plotted in figure 3, which indicates a straight-line relation between ultraviolet dose and induced mutations.
DOSAGE, ERGS x MM?
FIGURE 3.-Plot of data on mutants (both streptomycin-resistant and streptomycin- dependent) showing up after strain B / r of E . coli was irradiated with different doses of ultraviolet rays (2537 A ) and the bacteria allowed to multiply 1.2 to 1.5 times.
DISCUSSION
Studies of streptomycin-resistant mutants have revealed an interesting situation; namely, that none of the mutants investigated can compete with the original strain when grown without streptomycin. Since about 60 percent of these mutants are dependent on streptomycin, they can pass through only a few divisions w?thout i t ; but even those resistant mutants that are not streptomycin-dependent seem to be at a disadvantage as compared with nonmutants. This was indicated by a study of five resistant mutants, three of which were tested in mixtures with nonmutant bacteria and two of which were studied for division rate.
Experiments with ultraviolet radiation and with X-rays showed two sig- nificant results. The first was that there are no “zero-point’’ mutations among the induced mutations from B to B / S and B/Sd, and also that there are probably none among reversions from BTSd. This is in contrast to the phage-resistance system, where some of the induced mutations do not need cell division for their expression (zero-point mutants) although others re- quire at least one cell division to’take place before they show up (end-point mutants). I n every irradiation experiment made in the study of induction of mutations from B to B / S , bacteria were plated, immediately after treatment, on medium containing streptomycin ; therefore records of a large number of such platings are available. I n no case was the proportion of mutants sig- nificantly higher than in treated controls, ‘which offers good evidence that there were no zero-point mutants.
5%
the number may not have been sufficiently high to he detected by the method used in the experiments. Therefore these data are not in disagreement with the conclusion that zero-point mutations do not occur among induced B-to- B / S mutations.
If zero-point mutations occurred among induced back-mutations from B / S d , they would be expected to produce colonies that could be detected after incubation of about 12-1 5 hours. Since no unexpectedly large proportions of early-appearing colonies were noticed in any of the experiments, it seems reasonable to conclude that zero-point mutants are not present among re- versions.
Mutations from B to B / S induced by ultraviolet radiation did not follow the pattern of expression observed in delayed mutations from B to B / 1 (DEMEREC 1946) ; that is, their time of appearance did not stretch over a long period during which the total number of bacteria increased manyfold. In the case of induced B / 1 mutants, only a small proportion were expressed after the first few divisions of the irradiated bacteria, whereas the great ma- jority showed up after later divisions ; and the mutation rate per bacterium per division returned to the spontaneous level only after 10 to 12 divisions. Examination of the data presented in table 6 reveals a pattern of appearance of induced mutants that is not comparable to that observed in the B / 1 nia- terial. For example, in experiment 14, after 4 hours of incubation (14-4), when the number of bacteria had increased about 1.2-fold (i.e., before all the irradiated bacteria had undergone one division), the frequency of induced mutants was 339 per lo8 bacteria surviving the treatment. In the same ex- periment, after
5
hours of incubation (14-S), when the number of bacteria had increased 5.9-fold, the frequency of mutants was 687 per lo8. Similarly, in experiment 16, after 3% hours of incubation the bacteria had multiplied 1.3-fold and the frequency of mutants was 576 per los; after 4% hours, the increase was 10.7-fold and the frequency of mutants 1000 per lo8; and, fiinally, after 5% hours the increase was 128-fold and the frequency of mu- tants about 2167 per lo8. In this last-mentioned experiment there was an indication that some induced mutants were expressed during the period when the bacteria increased from 10-fold to 128-fold, but their number was very small compared with the increment of B / f mutants during the comparable period. More extensive experiments carried on in connection with another study did not show any consistent increase in the frequency of induced mu- tants after the treated bacteria had undergone between 2 and 4 divisions.STREPTOMYCIN R E S I S T A N C E 597
to induced mutations from B/Sd to R (back-mutations to nondependence) as well as to those from B to B / S . It is quite different from the situation found in the phage-resistance system, where a multiple-hit curve was indi- cated for the relation between ultraviolet dose and induced mutation rate
( DEMEREC and LATAR JET 1946).
SUMMARY
Experimental results indicate that the rate of mutation in strain B ( B / r ) of E . coli from sensitivity to complete resistance to streptomycin is about 1 x per bacterium per division. About 60 percent of the resistant mutants are dependent on streptomycin for their growth.
The rate of mutation from B to B / S (resistance to streptomycin) can be studied with considerable precision, since the work can be carried out with very large numbers of bacteria. The same is true for the study of back-muta- tion ( R , equals reversion) from streptomycin dependence ( B / S d ) to non- dependence. The mutation rate in the mutant strain B/Sd-4 is about 1 . 4 ~
lo-* per bacterium per division.
Mutations from B to B / S , as well as from B/Sd to R, may be induced by ultraviolet rays and by X-rays. The dose-mutation rate relation is repre- sented by a straight line for both radiations.
I t is necessary for at least two to four cell divisions to take place before the induced mutations are expressed ; " zero-point " mutants do not appear in the
streptomycin-resistance system.
LITERATURE CITED
BERTAXI, G., 1951 A method for detection of mutations, using streptomycin dependence in
DEMEREC, M., 1946 Induced mutations and possible mechanisms of the transmission of
Escherichia coli. Genetics 36: 598-611.
heredity in Escherichia coli. Proc. Nat. Acad. Sci. 32: 36-46.
1948
Genetics 30: llP-136.
F. L KENNEDY, N. W. MEYER and A. SCHWARTZ, 1950
Wash. Yr. Bk. 49: 144-157.
DEMEREC, M., and R. LATARJET, 1946
Spring Harbor Symp. Quant. Biol. 11: 38-50.
DEMEREC, M., B. WALLACE, E. M. WITKIN and G. BERTANI, 1949
Inst. Wash. Yr. Bk. 48: 154-165.
LURIA, S. E., and M. DELBRUCK, 1943
virus resistance. Genetics 28: 491-511.
NEWCOMBE, H. B., and R. HAWIRKO, 1949
sistance and dependence in Escherichia coli. J. Bact. 57: 565-572.
WITKIN, E. M., 1947
Origin of bacterial resistance to antibiotics. J. Bact. 56: 63-74.
DEMEREC, M., and U. FANO, 1945 Bacteriophage-resistant mutants in Escherichia coli.
DEMEREC, M., E. hl. WITKIN, B. W. CATLIN, J. FLINT, W. L. BELSER, C. DISSOSWAY, The gene. Carnegie Inst.
Mutations in bacteria induced by radiations. Cold
The gene. Carnegie
Mutations in bacteria from virus sensitivity to
Spontaneous mutation to streptomycin re-