ABSTRACT
LIN, CHEN. The Many Faces of Septic Shock: A General Framework for Disease Prediction using Generated Visualizations. (Under the direction of Dr. Min Chi.)
The recent advances in data collection and storage technologies have enabled the collection of large amounts of complex time series data. Such data has provided invaluable information and
created unprecedented opportunities to make revolutionary breakthroughs. In this dissertation, a
type of complex multivariate time series data called Electronic Health Records (EHRs) were used. EHRs are a systematized collection of patient medical histories containing static and dynamic
information. Static information (e.g., age and gender) is generally collected once and remains static
during a patient’s visit. Dynamic information (e.g., vitals and lab results), on the other hand, is represented as time series data and captures patients’ changing health conditions.
This dissertation focuses on building a general framework that further improves Long Short Term
Memory (LSTM). LSTM is a powerful model specially designed to handle temporal dependencies in time series data. The framework was applied to predict a life-threatening condition calledSeptic Shockunder two different experimental settings: visit levelearly diagnosis(left align) and event levelearly prediction(right align). The dissertation is organized into the three thrusts as described below, each of which captures a major development.
• Thrust 1: We investigated whether LSTM can be improved by doing one of the following: 1)
incorporating static information, 2) using one-side Convolutional Neural Network (1CNN) to extract temporal-invariant patterns from dynamic information, or 3) incorporating both
static information and 1CNN. Our findings suggest that adding static information improves
the performance, whereas applying 1CNN worsens the results.
• Thrust 2: We investigated whether two-side CNNs (2CNN) can be applied to further improve
the results from Thrust 1. Motivated by two-side CNN’s (2CNN) success in computer vision,
we propose a novel component calledImage Generator, which maps EHRs to image repre-sentations. 2CNN is then applied to the generated image representations to extract spatial
invariant patterns predictive of Septic Shock. Our results show that transforming EHRs into
images achieves greater performance than using EHRs directly in theleftalign experimental setting, but not in therightalign experimental setting.
• Thrust 3: We investigated if the framework can be further improved if both of the original
EHRs and the generated image representations are used as inputs in the prediction process. More specifically, the extracted patterns from the image representations using 2CNN are
concatenated with the dynamic information at every temporal step. The results show that the
The contributions of this dissertation are threefold. First, the framework introduces an innovative
way of mapping complex multivariate time series data to meaningful image representations. The image representations allow us to fully take advantage of 2CNN’s computational power to extract
important features contributing to Septic Shock while filtering out irrelevant information. Second,
the proposed framework achieved great success in Septic Shock early diagnosis and prediction, thus making it possible to identify patients at high risks early on so timely treatment can be provided.
Finally, the generated image representations are intuitive, interpretable, and informative. Therefore,
© Copyright 2018 by Chen Lin
The Many Faces of Septic Shock: A General Framework for Disease Prediction using Generated Visualizations
by Chen Lin
A dissertation submitted to the Graduate Faculty of North Carolina State University
in partial fulfillment of the requirements for the Degree of
Doctor of Philosophy
Computer Science
Raleigh, North Carolina
2018
APPROVED BY:
Dr. Xipeng Shen Dr. Munindar P. Singh
Dr. Roger Azevedo Dr. Min Chi
DEDICATION
This thesis is dedicated to my PhD advisor Dr.Min Chi who has always been a constant source of guidance, support and encouragement, to my parents Caixia Hong and Ping Lin who bring life to
me and nurture me with affection, to my beloved husband and friend, Luis Lopez, who makes all
BIOGRAPHY
Chen Lin was born in Hangzhou, China. She graduated from Zhejiang Gongshang University with a Bachelors degree in Electronic Information Engineering. She joined the Department of Computer
Science at North Carolina State University as a Master student in 2013, where she developed a deep
interesting in data mining and machine learning. She has worked as a part-time research assistant in Ribolab under the supervision of Dr.Donald Bitzer where she was involved in a research project
focusing on simulating and modulating protein synthesis to maximize protein yield.
During her first one and half year in NCSU, she has developed deep interest and appreciation of
modern computer-based technology and was amazed at how those technologies could transform
people’s lives in numerous ways. In the spring of 2015, she officially joined the Ph.D. program, working as a research assistant under Dr.Min Chi at the Center for Educational Informatics. Most of
Chen’s work was devoted to the fields of education and healthcare. She has been working on building
a predictive model which takes into account the student’s performance and tutor’s intervention to predict student future performance and test scores. The model can also recommend instructional
interventions leading to the better learning outcome. Chen has also actively participated in an
interdisciplinary research project where many other students, faculties from Industrial Engineering and clinicians, statisticians from Mayo Hospital and Christian Care Health System are involved.
Chen developed a deep neural network based model that performs early prediction and diagnosis
of Septic Shock, which is a severe condition with high mortality rate and one of the major cause of hospital spending.
Besides her academic life in school, Chen has also worked as an intern for companies such as
Atlassian and IBM, and research institute such as the Value Institute in CCHS. She cherished every opportunity to explore how the skills and knowledge she has gained in school can contribute to the
ACKNOWLEDGEMENTS
First and foremost, I would like to thank Dr. Min Chi for the opportunity to be involved with her projects and Ph.D. program. I first met Dr. Chi as a student in her course. Her extensive knowledge
in this field and her dedication to work deeply inspired us. She is sincere and warm. She is always
there for students and doing her best to make sure us to stay positive and productive during our Ph.D. journey.
I would like to thank my committee members, Dr.Xipeng Shen, Dr.Roger Azevedo and Dr.Munindar Singh. They offered me valuable feedback and guidance along the way that allows me to gain a
deeper understanding and keep on improving my work.
I would like to thank all faculties and students involved in S.E.P.S.I.S project. Dr.Julie Ivy, Dr. Maria Mayorg, Dr.Min Chi and Dr.Osman Ozaltin are the faculties in charge of these project. It is
their hard work and excellent management that allows us to make progress and stay productive. I
would like to thank our collaborators Dr.Muge Capan, Dr.Jeanne Huddleston, Dr.Santiago Romero Brufau and Dr.Ryan Arnold. They provided us with a huge amount of Electronic Health Records and
clinical insights that enable this big project. I would like to thank Joseph Agor, Kendall McKenzie,
Nisha Nataraj, Shadi Hassani Goodarzi and Nishant Singh, etc, from the Department of Industrial Engineering. We have spent several fun semesters together, tackling the most exciting challenges of
Sepsis.
I would like to thank all my friends Linting Xue, Yuan Zhang, Xi Yang, Guojing Zhou, Shitian Shen, Yeojim Kim, Ye Mao, Song Ju and Farzaneh Khoshnevisan in CEI. Their encouragement and
support help me survive some of the most stressful moments of my life. It has been a great pleasure
to spend these years together with all of them. I would also like to thank my friends Feifei Wang, Xinyue Yuan, Qiang Zhang, Junjiamin Mu and Wei Fu. We shared many great time in Raleigh and i
am always grateful for their friendship and support.
I would like to thank all my parents for always being supportive. I am especially grateful for my husband Luis Lopez. He has spent great amount of time carefully reviewing my work to make sure
TABLE OF CONTENTS
LIST OF TABLES . . . vii
LIST OF FIGURES. . . ix
Chapter 1 Introduction. . . 1
1.1 Research Overview . . . 1
1.2 Thesis Statement And Hypotheses . . . 4
1.3 Contributions . . . 6
1.4 Organization . . . 6
Chapter 2 Septic Shock. . . 7
2.1 Challenges . . . 8
2.2 Four Stages . . . 9
Chapter 3 Classic Machine Learning (ML) Models vs. Long Short Term Memory (LSTM) . 12 3.1 Overview . . . 12
3.2 Related Work . . . 12
3.3 LSTM . . . 14
3.4 Datasets . . . 15
3.5 Experiments . . . 17
3.5.1 Two Experimental Settings . . . 17
3.5.2 Models for Comparisons and Implementations . . . 19
3.5.3 Evaluation Metrics . . . 19
3.6 Results . . . 20
3.6.1 Septic Shock Visit Level Early Diagnosis (Left Align) . . . 20
3.6.2 Septic Shock Event Level Early Prediction (Right Align) . . . 20
3.7 Summary . . . 21
Chapter 4 Thrust 1: Incorporating Static Information and One-side CNN . . . 22
4.1 Overview . . . 22
4.2 Related Work . . . 22
4.3 Framework . . . 23
4.4 Experiments . . . 25
4.5 Results . . . 26
4.5.1 Septic Shock Visit Level Early Diagnosis (Left Align) for Thrust 1 . . . 26
4.5.2 Septic Shock Event Level Early Prediction (Right Align) for Thrust 1 . . . 27
4.6 Summary . . . 29
Chapter 5 Thrust 2: Generate Image Representations and Apply Two-side CNN . . . 30
5.1 Overview . . . 30
5.2 Related Work . . . 31
5.2.1 Graphic Representations of EHRs . . . 31
5.3 Framework . . . 32
5.3.1 Design Principals . . . 32
5.3.2 Overview ofImage Generator . . . 33
5.3.3 Mapping . . . 35
5.3.4 Image Rendering . . . 36
5.3.5 Emotion Classifier . . . 36
5.4 Datasets . . . 37
5.4.1 Radbound Faces Dataset . . . 37
5.4.2 CCHS Dataset . . . 38
5.5 Experiments . . . 38
5.6 Results . . . 39
5.6.1 Septic Shock Visit Level Early Diagnosis (left align) for Thrust 2 . . . 39
5.6.2 Septic Shock Event Level Early Prediction (Right Align) for Thrust 2 . . . 41
5.7 Summary . . . 44
Chapter 6 Thrust 3: Combine Generated Image Representation and EHRs for Prediction 46 6.1 Overview . . . 46
6.2 Framework . . . 46
6.3 Data . . . 47
6.4 Experiments . . . 47
6.5 Results . . . 48
6.5.1 Septic Shock Visit Level Early Diagnosis (Left Align) for Thrust 3 . . . 48
6.5.2 Septic Shock Event Level Early Prediction (Right Align) for Thrust 3 . . . 49
6.6 Summary . . . 51
Chapter 7 Conclusions and Future Work. . . 52
BIBLIOGRAPHY . . . 55
APPENDIX . . . 59
Appendix A Results Without Using Sepsis Stages Labels as Input . . . 60
A.1 Six Classic Machine Learning (ML) Models vs. Long Short Term Memory (LSTM) 60 A.2 Thrust 1 . . . 61
A.2.1 Septic Shock Visit Level Early Diagnosis (Left Align) for Thrust 1 . . . 61
A.2.2 Septic Shock Event Level Early Prediction (Right Align) for Thrust 1 . . . 63
A.3 Thrust 2 . . . 65
A.3.1 Septic Shock Visit Level Early Diagnosis (Left Align) for Thrust 2 . . . 65
A.3.2 Septic Shock Event Level Early Prediction (Right Align) for Thrust 2 . . . 67
A.4 Thrust 3 . . . 69
A.4.1 Septic Shock Visit Level Early Diagnosis (left align) for Thrust 3 . . . 69
LIST OF TABLES
Table 3.1 Contingency table for shock and non shock patients . . . 15 Table 3.2 Septic Shock Visit Level Early Diagnosis (Observation Window=24 hrs) . . . 20 Table 3.3 Septic Shock Event Level Early Prediction (Hold-off Window=1 hr) . . . 21 Table 4.1 Septic Shock Visit Level Early Diagnosis (Observation Window=24 hrs) in
Thrust 1 . . . 26 Table 4.2 Average Performance Metrics for Septic Shock Visit Level Early Diagnosis in
Thrust 1 . . . 27 Table 4.3 Septic Shock Event Level Early Prediction (Hold-off Window=1 hr) in Thrust 1 28 Table 4.4 Average Performance Metrics for Septic Shock Event Level Early Prediction for
Thrust 1 . . . 29
Table 5.1 Septic Shock Visit Level Early Diagnosis (Observation Window=23 hrs) for Thrust 2 . . . 41 Table 5.2 Average Performance Metrics for Septic Shock Visit Level Early Diagnosis for
Thrust 2 . . . 41 Table 5.3 Septic Shock Event Level Early Prediction (Hold-off Window=1 hr) for Thrust 2 42 Table 5.4 Average Performance Metrics for Septic Shock Event Level Early Prediction
(Right Align) for Thrust 2 . . . 44
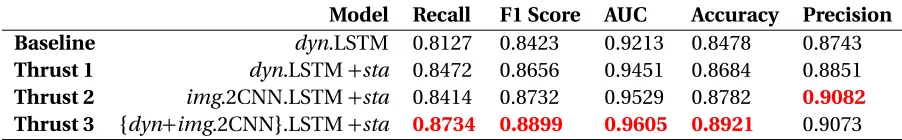
Table 6.1 Septic Shock Visit Level Early Diagnosis (Observation Window=24 hrs) for Thrust 3 . . . 49 Table 6.2 Average Performance Metrics for Septic Shock Visit Level Early Diagnosis for
Thrust 3 . . . 49 Table 6.3 Septic Shock Event Level Early Prediction (Hold-off Window=1 hr) . . . 50 Table 6.4 Average Performance Metrics for Septic Shock Event Level Early Prediction for
Thrust 3 . . . 50
Table 7.1 Summary of The Average Performance Metrics for Septic Shock Visit Level Early Diagnosis (Left Align) . . . 54 Table 7.2 Summary of The Average Performance Metrics for Septic Shock Event Level
Early Prediction (Right Align) . . . 54
Table A.1 Septic Shock Visit Level Early Diagnosis (Observation Window=24 hrs) . . . 61 Table A.2 Septic Shock Event Level Early Prediction (Hold-off Window=1 hr) . . . 61 Table A.3 Septic Shock Visit Level Early Diagnosis (Observation Window=24 hrs) for
Thrust 1 . . . 62 Table A.4 Average Performance Metrics for Septic Shock Visit Level Early Diagnosis in
Thrust 1 . . . 63 Table A.5 Septic Shock Event Level Early Prediction (Hold-off Window=1 hr) in Thrust 1 63 Table A.6 Average Performance Metrics for Septic Shock Visit Level Early Diagnosis in
Table A.7 Septic Shock Visit Level Early Diagnosis (Observation Window=23 hrs) for Thrust 2 . . . 65 Table A.8 Average Performance Metrics for Septic Shock Visit Level Early Diagnosis for
Thrust 2 . . . 67 Table A.9 Septic Shock Event Level Early Prediction (Hold-off Window=1 hr) for Thrust 2 68 Table A.10 Average Performance Metrics for Septic Shock Event Level Early Prediction . . . 70 Table A.11 Septic Shock Visit Level Early Diagnosis (Observation Window=24 hrs) for
Thrust 3 . . . 70 Table A.12 Average Performance Metrics for Septic Shock Visit Level Early Diagnosis for
Thrust 3 . . . 71 Table A.13 Septic Shock Event Level Early Prediction (Hold-off Window=1 hr) . . . 71 Table A.14 Average Performance Metrics for Septic Shock Event Level Early Prediction for
LIST OF FIGURES
Figure 3.1 A single LSTM block containing a forget, input and output gate . . . 15
Figure 3.2 The static information in EHR . . . 16
Figure 3.3 The dynamic information in EHR . . . 17
Figure 3.4 Left align: predict whether a patient will have Septic Shock at the end of the visit using records in the firstn-hour window . . . 18
Figure 3.5 Right align: predict whether a patient will have Septic Shockmhours later . . 18
Figure 4.1 Framework in Thrust 1 . . . 24
Figure 4.2 1CNN extracts temporal-invariant patterns from dynamic information . . . 25
Figure 4.3 Left align: LSTM based models in Thrust 1 using EHRs only . . . 27
Figure 4.4 Right align: DNN based models in Thrust 1 using EHRs only . . . 29
Figure 5.1 Framework in Thrust 2 . . . 33
Figure 5.2 Visualization Rules . . . 34
Figure 5.3 Image Generator . . . 35
Figure 5.4 Image Rendering . . . 37
Figure 5.5 Emotion Classifier . . . 38
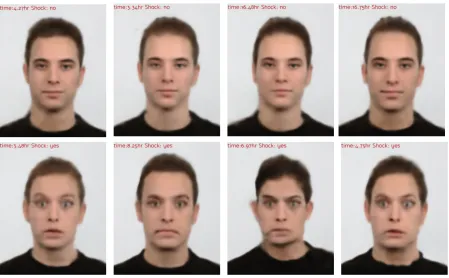
Figure 5.6 Generated Facial Expressions from 8 Different Patients . . . 40
Figure 5.7 Visit Level Early Diagnosis (Left Align) forimg.2CNN.LSTM+staandimg.2CNN.LSTM in Thrust 2 . . . 41
Figure 5.8 Visit Level Early Diagnosis (Left Align) fordyn.LSTM andimg.2CNN.LSTM in Thrust 2 . . . 42
Figure 5.9 Visit Level Early Diagnosis (Left Align) fordyn.LSTM+staandimg.2CNN.LSTM+sta in Thrust 2 . . . 42
Figure 5.10 Visit Level Early Diagnosis (Left Align) forimg.2CNN.LSTM+staandimg.2CNN.LSTM in Thrust 2 . . . 43
Figure 5.11 Visit Level Early Diagnosis (Left Align) fordyn.LSTM andimg.2CNN.LSTM in Thrust 2 . . . 43
Figure 5.12 Visit Level Early Diagnosis (Left Align) fordyn.LSTM+staandimg.2CNN.LSTM+sta in Thrust 2 . . . 44
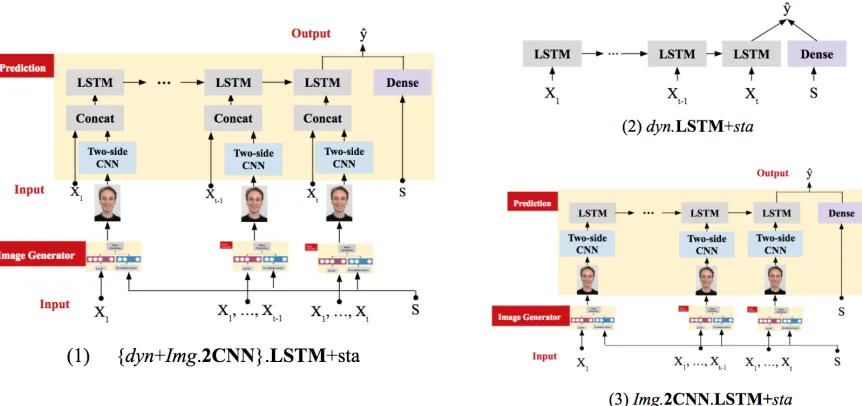
Figure 6.1 Framework for Thrust 3:{dyn+img.2CNN}.LSTM+sta . . . 47
Figure 6.2 Models for Comparisons . . . 48
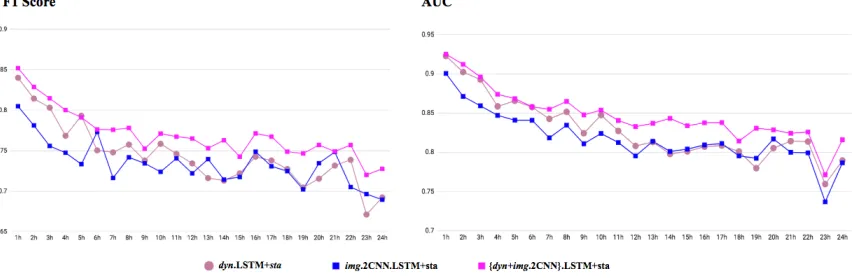
Figure 6.3 Visit Level Early Diagnosis (Left Align) for Thrust 3 . . . 49
Figure 6.4 Event Level Early Prediction (Right Align) for Thrust 3 . . . 50
Figure A.1 Left align: LSTM based models in Thrust 1 using EHRs only . . . 62
Figure A.2 Right align: LSTM based models in Thrust 1 using EHRs only . . . 64
Figure A.3 Visit Level Early Diagnosis (Left Align) forimg.2CNN.LSTM+staandimg.2CNN.LSTM in Thrust 2 . . . 66
Figure A.5 Visit Level Early Diagnosis (Left Align) fordyn.LSTM+staandimg.2CNN.LSTM+sta in Thrust 2 . . . 67 Figure A.6 Event Level Early Prediction forimg.2CNN.LSTM+staandimg.2CNN.LSTM
in Thrust 2 . . . 68 Figure A.7 Event Level Early Prediction fordyn.LSTM andimg.2CNN.LSTM in Thrust 2 . 69 Figure A.8 Event Level Early Prediction fordyn.LSTM+staandimg.2CNN.LSTM+stain
CHAPTER
1
INTRODUCTION
1.1
Research Overview
The recent advances in data collection and storage technologies have enabled the collection of large
quantities of complex multivariate time series data. This data has proven to be an invaluable source of information and has created unprecedented opportunities to make revolutionary breakthroughs.
Organizations and companies are now turning to predictive analytics to help them uncover new opportunities and make important decisions. For example, as cybersecurity becomes increasingly
concerning, there is a need for high-performance models to monitor activity data in real time,
spot abnormalities, and prevent criminal behaviors. As another example, many organizations have focused on stock market prediction. The successful prediction of stock trends could yield a significant
profit. Despite its great potentials, many challenges are faced in mining complex time series data,
such as high dimensionality, temporality, noise, heterogeneity, irregularity, mixed granularities, sparseness, and incompleteness[Bir15].
This dissertation primarily focuses on a type of complex multivariate time series data called
times at irregular time intervals during a patient’s visit and gets updated whenever a new medical
record is available. Each record is associated with a unique timestamp.
This dissertation describes a general framework that performs early prediction using EHRs. The
early diagnosis and prediction of clinical conditions allow more time for treatment and intervention.
For many diseases and conditions, such as kidney failure and cancer, early diagnosis leads to a higher survival rate and a reduced hospital cost.
More specifically, this dissertation proposed a framework based on a type of Deep Neural
Network called Recurrent Neural Network (RNN). RNN is one of the most powerful models for time series data and has achieved superior performance in Language modeling[Sun12], translation [Cho14], text generation[Vin15], speech recognition[Sak14], and recognition of surgical activity [DiP16]. The original vanilla RNN has a memory maintenance scheme that allows the information calculated in the past to be passed to the future state. Therefore, RNN is effective in capturing
temporal dependencies between events. However, the original RNN is often affected by the gradient
vanishing and exploding problem when the sequence is long[Pas12]. Therefore, Long Short Term Memory (LSTM) is designed to tackle this problem. Numerous studies[Mio16; Pha16; Cho16]have applied RNN/LSTM to predict future medical events using EHRs and found that the RNN/LSTM based framework achieves significantly better results than classic machine learning classifiers. In this dissertation, LSTM was applied as the model is more robust for long sequence data.
The major research goal of this dissertation is to build a framework that further improves the performance of LSTM. The framework was applied to predict a clinical condition called Septic
Shock, which is the most severe stage of Sepsis. Our research was carried out in three thrusts. Each
thrust focuses on a specific research question.
In thrust 1, we were concerned with whether LSTM can be improved by: incorporating static
information through a dense layer, applying a Convolutional Neural Network (CNN) layer to extract
temporal-invariant patterns from the dynamic information, or both. The first idea is motivated by previous research, which suggests static information such as comorbidities[Won14]and gender [Coh15]are important predictors of Septic Shock. Thus, we hypothesized that incorporating static information may improve performance. The second idea is motivated by the fact that the structure of LSTM between its input and hidden layer is shallow. Empirical evidence suggests that having depth
The proposed framework was tested in two experimental settings, each of which focused on a
different prediction task: the visit level early diagnosis (left align) and the event level early prediction (right align). Our results showed that adding static information leads to better performance, however,
the added 1CNN layer does not bring any performance gain. We suspect the temporal-invariant
patterns extracted by 1CNN may have already been captured by LSTM. However, the relationship between features are not fully modeled as the convolution operation is not applied to the feature
dimension. On the other hand, 2CNN is capable of extracting patterns between different features
(i.e., pixels) in images. Nonetheless, EHRs do not possess the same spatial arrangement as images that allows 2CNN to work optimally. Thus, in thrust 2, we attempted to tackle this problem by
transforming EHRs into images.
In thrust 2, we explored how we can adapt the EHRs for the application of 2CNN. We proposed a component calledImage Generatorwhich takes a sequence of EHRs as input and then maps them to a sequence of image representations reflecting different sepsis stages. 2CNN was then applied to
extract spatial-invariant patterns from those image representations. Finally, the extracted patterns were fed into LSTM. In this thrust, the proposed framework was also tested in the two aforementioned
experimental settings, i.e., the visit level early diagnosis (left align) and the event level early prediction
(right align). The results showed that transforming EHRs into image representations and then applying 2CNN achieves greater performance in the left align experimental setting but not in the
right align experimental setting.
In thrust 3, we investigated whether the performance could be improved by using both EHRs
and the generated image representations. Although the results in thrust 2 suggested the images
representations capture some predictive information, a certain degree of information loss is in-evitable during the transformation. Therefore, in this thrust, the extracted patterns from 2CNN were
concatenated with the dynamic information of EHRs at every temporal step. The concatenated
vectors were then fed into LSTM to make a final prediction. Again, the framework was tested in both visit level early diagnosis setting (left align) and event level early prediction (right align) setting. The
results showed that the proposed framework in thrust 3 led to the best performance in both settings.
To summarize, in this dissertation, we propose a general LSTM based framework for Septic Shock prediction. The proposed framework incorporates a dense layer to handle static information.
It also contains anImage Generatorwhich maps EHRs to their image representations. The generated image representations allow the application of 2CNN, which can capture important spatial-invariant patterns. The proposed framework achieves greater performance than LSTM. As a byproduct,
the Image Representation can provide an intuitive, immediate, interpretable, and informative
1.2
Thesis Statement And Hypotheses
In this dissertation, we proposed a general predictive framework based on LSTM to predict Septic
Shock using EHRs. The dissertation was carried out in three thrusts.
In thrust 1, we incorporated static information by applying a dense layer. Furthermore, we introduced a 1CNN layer to extract temporal invariant patterns from the dynamic information
in EHRs and then feeding the extracted patterns to LSTM. The hypothesize was both approaches
would lead to improved performance.
In thrust 2 we explored how to adapt EHRs for the application of 2CNN. At the core of this
proposed framework is a component calledImage Generator. This component was designed to follow three important design principals: 1) empathetic visualization, 2) visual homomorphism [LS02], and 3) automatic mapping. In this dissertation, we used facial images as media for visualizing EHRs. Given that one of our major research goals is to predict Septic Shock, it is natural to define a
one-to-one correspondence between emotions and the different stages of Sepsis. Thus, we defined neutral corresponds to infection, sad to inflammation, angry to organ failure, fear to Septic Shock,
and happy to any patients that are not in any of the aforementioned Sepsis stages. As a result, the evolving emotions reflect the trajectory of disease progression. One way to generate the image
from the data is by explicitly determining a set of layout rules. However, it is often hard to come
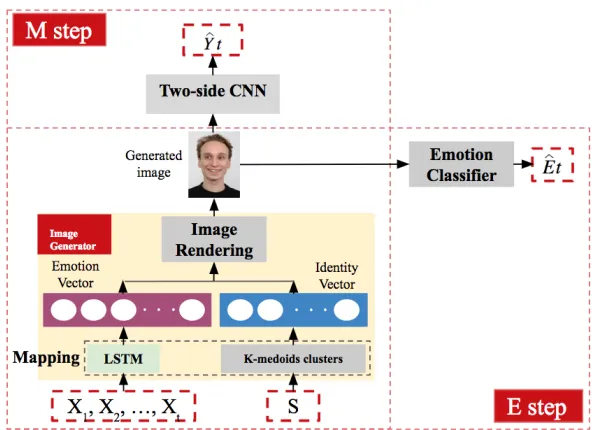
up with handcrafted layout rules and guarantee a high-quality image, let alone enforce visual homomorphism. Our framework employs a more principled approach: we designed anImage Generatorcomponent is based on neural network that learns the mapping automatically through back-propagation. Formally. theImage Generatorhas three parts:Mapping,Image Rendering, andEmotion Classifier.Image Generatorfirst maps the incoming EHRs, including both static and dynamic information, to a high-level image representation throughMapping. Given these high-level representations (i.e., the emotion vector and identify vector), images can be generated by the second partImage Rendering. To ensure the quality of the generated image and to enforce visual homomorphism, the third partEmotion Classifieris introduced to recognize different emotions (i.e., neutral, sad, angry, fear and happy) from a given facial image. We hypothesized that using the generated image representations allow us to fully take advantage of 2CNN’s power, thus the
framework would yield improved results.
In the thrust 3, we investigated if the prediction would be further improved if we use both EHRs and the generated images as inputs. More specifically, after 2CNN is applied to capture the
spatial-invariant patterns within the image representations derived from the EHRs, its output is
concatenated with the dynamic information at every temporal step. The concatenated vectors were fed into LSTM to make a final prediction. We hypothesized the framework in thrust 3 would achieve
the best results.
Dataset-[Lan10]was used to learn the weights inImage RenderingandEmotion Classifier. This database is a public dataset provided by the behavior Science Institute of the Radbound University. The dataset contains high-quality profile images showing eight facial expressions: anger, disgust, fear,
happiness, sadness, surprise, contempt, and neutral. All images have labels corresponding to the
depicted emotions and identities. A total of 456 front view images from 57 models were used in this dissertation. The second dataset is an EHRs dataset from Christiana Care Health System (CCHS),
Newark, USA. It was used for trainingMappingas well as carrying out our prediction experiments. This dataset consists of adult inpatients’ medical records from July 2013 to December 2015. In total, there are 119,857 patients and 210,289 hospitalizations in the CCHS dataset.
The framework was tested in two different experimental settings: the visit level early diagnosis
(left aligned) prediction and the event level early prediction (right aligned). For the visit level early diagnosis task, thefirstnhours of the patients’ EHRs were made available to the framework. The goal is to predict whether the patient will develop Septic Shock at any subsequent point during the visit.
To carry out this task, the patients’ sequences were left aligned, i.e., they were aligned by the start of their visits. Only records within the firstnhours of patients’ visit were used for training and testing.
Thisn-hour window is denoted as theobservation window. For the event level early prediction task, the goal is to predict whether the patient will develop Septic Shockmhours later. To carry out this task, weright alignedall sequences by their endpoint. For Septic Shock patients, the endpoint is the onset time of Septic Shock, whereas for non-Septic Shock patients, the end point is the end of truncated sequences. Note that for all Septic Shock patients, their shock onset time is identified
as the first occurrence of any abnormality within the specified Septic Shock criteria as defined by
clinicians. The EHRs within them-hour window leading up to endpoint were omitted. Thism-hour window is denoted as the hold-off window. Only the records before the hold-off window were used
to predict whether the patient will be in septic shock or notmhours later.
To evaluate the results, Recall, F1 Score, AUC, accuracy, and precision were computed. Generally speaking, the F1 score and AUC present the trade-off between different metrics, and they are more
robust. Therefore, we will mainly focus on these two metrics.
To summarize, the following hypotheses were investigated in this dissertation:
• Hypothesis 1: In thrust 1, introducing 1CNN between the input and the hidden states of LSTM would yield a similar or better performance.
• Hypothesis 2: In thrust 1, incorporating static information through a dense layer would lead
to improved performance.
• Hypothesis 3: In thrust 2, applying 2CNN to the generated image representations of EHRs
would achieve a similar or better performance than applying 1CNN to EHRs.
would achieve a similar or better performance than using either of them alone.
1.3
Contributions
The contributions of this dissertation are three fold. First, the framework introduces an innovative
way of generating image representations from EHRs via a component calledImage Generator. The image representation allows us to fully take advantage of 2CNN’s computational power. The 2CNN is capable of extracting the most important features contributing to septic shock prediction while
filtering out irrelevant information. Second, the proposed framework has achieved great success in Septic Shock early diagnosis and prediction, thus making it possible to identify patients at high
risks early on so timely treatment can be provided. Finally, as a byproduct, the generated graphic
representation can provide visualization for different sepsis stages. This can be a great visual aid for researchers to understand the process of disease progression.
1.4
Organization
The organization of this proposal is as follows: Chapter 2 introduces the background of Sepsis and Septic Shock. Chapter 3 compares classic machine learning models and LSTM. This chapter serves
as the motivation for our work. Chapters 4, Chapter 5 and Chapter 6 present a detailed description
of the three research thrusts mentioned above. For each thrust, the literature review, proposed framework, experimental design, and results are presented. Chapter 6 concludes this dissertation
CHAPTER
2
SEPTIC SHOCK
Sepsis is a critical condition that arises when the body starts to unintentionally injure its own tissues
and organs in response to an infection[Del04]. This condition is characterized by several negative factors including longer and larger number of hospitalizations, greater medical costs, and increased
risk of death. Compared to other conditions, sepsis increases the duration of hospitalization by
75%[Hal11]. Moreover, it is the second most common reason for hospitalization[TA06], with annual hospitalization for sepsis having more than doubled over the past decade[Ber13]. As a result, sepsis and its more severe stage, Septic Shock, have placed a $23.7 billion burden on the US healthcare
system, 75% of which is paid through Medicare and Medicaid[TA06]. Lastly, Septic Shock, the final and most severe stage of sepsis, dramatically increases the risk of mortality in patients, with the
mortality rates being nearly 50%.
Septic Shock, which causes circulatory and cellular/metabolic dysfunction, incrementally de-creases survival. Studies have shown that the identification of patients at risk of Septic Shock during
the critical “golden hours” is crucial[RM06]. In fact, early goal-directed therapy provided near the onset of Septic Shock has a significant benefit, which arises from the timely restoration of balance between oxygen delivery and oxygen demands in patients at high risk of cardiovascular collapse [Riv01]. For those in Septic Shock, mortality rate increases by 7.6% with each hour treatment is delayed after the onset of hypotension. Therefore, early recognition and treatment is key to the
2.1
Challenges
To this day, awareness of Sepsis and Septic Shock remains low. Several challenges prevent accurate
and timely identification of patients at risk of Septic Shock. These challenges arise from both clinical
and machine learning perspectives.
Clinical Perspective:There is continued disagreement between government agencies about
what defines Sepsis and Septic Shock (e.g., Center for Medicare and Medicate, professional societies,
and Third International Consensus Definitions for Sepsis and Septic Shock)[Sey16]. This disagree-ment is partly due to the vague nature of sepsis symptoms such as: subtle change in disagree-mental status,
minor fluctuations in white cell count, or elevated blood glucose levels[HK03]. Moreover, the sepsis disease spectrum is heterogeneous – sepsis includes multiple subtypes of pathologically distinct disease processes. For example, according to PIRO sepsis staging framework[Rat15],a sepsis subtype can be defined by a predisposition (e.g., age, gender, past medical conditions, etc), infection type
(e.g., pneumonia, urinary tract infection, etc), response (e.g., heart rate, respiratory rate, etc), and organ dysfunction (e.g., cardiovascular, metabolic, etc). Patients with a similar risk for mortality
may express drastically different symptoms depending on their sepsis subtype.
In practice, Various Early Warning Scores (EWS) systems have been developed to assess patients’
health status. Some prevailing examples are: the Sequential Organ Failure Assessment (SOFA) Score [Vin96], Mortality in Emergency Department Sepsis (MEDS)[Sha03], Acute Physiology and Chronic Health Evaluation (APACHE) system[Boh88], and Predisposition Insult Response and Organ failure (PIRO)[Rel09]. However, these scores are general-purpose tools and are not designed to predict a specific acute condition such as Septic Shock. Many more specific tools such as invasive monitoring or particular biomarkers drawn from blood tests are difficult to access in an emergency room setting.
Besides, many biomarkers have only been studied in specific patient populations and may not be
applicable to the broader patient population. In fact, clinicians have not yet reached a conclusion as to which molecular trigger can be responsible for tissue injury and organ failure among Septic Shock.
The potential indicators for sepsis risk are scattered in a wide range of clinical measurements, which
makes Septic Shock onset a non-trivial prediction task. The previous works on Sepsis prediction have been limited to small and carefully curated datasets with limited applicability[Ho12]. Due in part to all these reasons, many Septic Shock patients are under-diagnosed at earlier stages when
aggressive treatment could still reverse its course of progression[Riv01].
Machine Learning Perspective:The use of machine learning models offers a great alternative
to accelerating clinical research and predictive analysis. The recent wide adoption of Electronic
Health Records allows rich clinical information (e.g., demographics, vitals, labs, treatment,etc) to be saved in a digital format and shared among different entities. The secondary use of those EHRs has
enable data-driven predictions of clinical conditions. Nevertheless, in practice, models based on
to[Mio16]: “EHR data is challenging to represent and model due to its high dimensionality, noise, heterogeneity, sparseness, incompleteness, random errors, and systematic biases”. Therefore, it is necessary that all these factors are properly addressed in order to build reliable models.
Another challenge comes from the lack of ground truth labels. Most existing literature suggests
using the Ninth Revision of International Classification of Diseases (ICD-9). However, solely relying on ICD-9 can be problematic as it has been proven to have limited reliability due to the fact that its
coding practice is used mainly for administrative and billing purposes, not for research purpose.
More importantly, ICD-9 cannot tell when certain condition such as sepsis shock occurs, which is essential for our task. Therefore, two expert clinicians who have extensive experience in the field
of sepsis defined their own rules through many rounds of iterative discussions and face-to-face
meetings. In this dissertation, these rules are used as our ground truth together with ICD-9 codes.
2.2
Four Stages
Our clinicians defined four stages of sepsis ordered by increasing severity:Infection,Inflammation, Organ Failure, andSeptic Shock. In order to identify these stages using the data elements available in our EHRs, the clinicians generated the following definitions:
• Infection: administration of a single dose of any infective (antibiotic, antiviral, or
anti-fungal) or any positive PCR test result.
Rationale:This definition identifies the population at risk for Sepsis outcomes and will serve as our global denominator. Since our goal is to optimize the sensitivity of this population, the clinicians intentionally set low criteria with the anticipated inclusions of patients treated with
antibiotics for preventative measures and empiric coverage.
• Inflammation: The presence of an abnormality within any of the inflammatory criteria will define a positive inflammatory state, with each abnormality being summative representing
the inflammatory burden:
– Cellular Response:
White blood cell>12,000 cells; Bandemia of white blood cells>10%;
Erythrocyte Sedimentation Rate (ESR)>20 mm/hr; C-Reactive Protein (CRP)>8 mg/L;
Procalcitonin>0.15 ng/mL. – Physiologic Response:
Respiratory rate>=20 breaths/minute; Shock Index>1.0;
Temperature>=38oC (100.4oF);
Temperature<36oC (96.8oF).
Rationale: Inflammation exists on a broad spectrum that can be identified by different biomark-ers. By expanding the inflammatory criteria can be useful in the risk stratification of Sepsis.
Their inclusion is mainly intended for investigation purpose.
• Organ Failure: The presence of an abnormality within any of the specified organ systems
criteria defines a positive organ failure state. Each dysfunction is summative representing an organ failure burden:
– Cardiovascular:
Systolic blood pressure<90 mmHg; Mean arterial pressure<65 mmHg;
Decrease in systolic blood pressure>40 mmHg within an 8 hour window. – Metabolic:
Lactate>2.0 mmol/L. – Renal:
Creatinine>1.2 mg/dL;
Creatinine increase>50% from initial creatinine; Urine output<500mL over 24 hours;
BUN>20 mg/dL. – Respiratory:
New oxygen requirement;
Mechanical ventilation requirement;
Pulse Oxygen OR SpO2<90%; Fio2>21%;
SpO2/FiO2 ratio<421. – Nervous:
Glasgow Comma Score (GCS)<14; Verbal GCS<5.
Bilirubin>2 mg/dL.
Rationale:Organ failure represents the primary outcome in the infection spectrum that we wish to prevent and target the recovery from patients who develop organ failure associated
with infection. Sepsis is defined by the presence of organ dysfunction with an active infection.
The specific criteria defined represents an assimilation of all accepted markers of organ dys-function used by previously validated scoring systems. However, there is limitation associated
with this criteria – some of them are poorly reliable within the EHRs, for example, the true
incidence of a new oxygen requirement is unclear depending on hospital practice. While we anticipate a poor capture of these elements, including them allow for future incorporation of
novel predictive tool and re-design of EHRs.
• Septic Shock: The presence of an abnormality within any of the specified septic shock criteria
defines a positive organ failure state:
– Persistent hypotension as shown through two consecutive readings (>=30 minutes apart) Systolic Blood Pressure<90 mmHg;
Mean arterial pressure<65 mmHg.
– Decrease in SBP>=40mmHg within an 8-hour period – Any vasopressor administration
Rationale:Traditional definition of septic shock would presume an intensive care unit admis-sion. Our definitions identifying a population in non-ICU beds by using persistent hypotension
CHAPTER
3
CLASSIC MACHINE LEARNING (ML)
MODELS VS. LONG SHORT TERM
MEMORY (LSTM)
3.1
Overview
In this chapter, LSTM is compared against several classic machine learning (ML) models on the task of Septic Shock prediction. This chapter shows the results and serves as a motivation for the rest of
the dissertation.
3.2
Related Work
In this section, we mainly focus on two categories of approaches, classic ML models and LSTM, that
are widely used in EHRs application for disease prediction.
Classic ML modelsNumerous studies have applied classic ML models for Sepsis related event
prediction. Tang et al.[Tan10]explored the use of principal component analysis (PCA) and nonlin-ear support vector machine (SVM) to predict severe Sepsis and systemic inflammatory response syndrome. Their results suggested that their ML classification model can be a potential useful
constructed an early warning system based on multivariate Logistic Regression with a greedy
for-ward feature selection method to detect Sepsis patients who will progress to Septic Shock. Their study defined Septic Shock as having Sepsis-induced arterial hypotension despite adequate fluid
resuscitation. Their studies were conducted using a public dataset called Multi-parameter
Intelli-gent Monitoring for Intensive Care II (MIMIC II). Their best Logistic Regression model achieved ROC=0.940. Thiel et al.[Thi10]developed a tool based on Recursive Partitioning and Regression Tree (RPART) to predict Septic Shock among hospitalized non-intensive care unit (ICU) medical patients.
In this study, Septic Shock is defined as having ICD-9 for acute infection and ICD-9 for acute organ dysfunction and the need for vasopressors within 24 hours of ICU transfer. Their data was collected
from Barnes Jewish Hospital, St. Louis, MO. Their model identified 54.7% Septic Shock patients from
the 635 patients in 2006 cohort, and identified 55.0% Septic Shock patients from the 667 patients in 2006 cohort. Another study[Ho12]used SVM combined with Bayesian PCA imputation to predict Septic Shock, defined as having any hypotension region (consecutive systolic blood pressure<90 mmHg) with a total fluid intake>600 mL. Their study also used MIMIC-II dataset. They concluded that PCA imputation approach leads to improvement of SVM in Septic Shock prediction.
In this dissertation, we also applied classic ML models as our baselines. However, there are
several important differences between the aforementioned studies and this dissertation. First of all, different ground truth rules to identify Septic Shock were employed. Second, out dataset was
collected from Emergency Department (ED), thus, our prediction was more challenging for the following reasons: 1) generally speaking, the physiological measurements are recorded at
higher-frequency in ICU, thus, there is more information and less missing entries in ICU dataset. 2) more
patients undergo invasive procedures in ICU and such procedures are necessary to obtain accurate bio-markers for Septic Shock.
Classic ML models do not adequately capture the temporal-sequential nature of the
medi-cal events or their dependencies. These models are trained using summary statistics (e.g., mean, standard deviation) calculated in a predefined window as extracted features[Tan10]. Furthermore, classic ML models heavily depend on feature engineering and selection. However, learning robust
features is a challenging task owing to the complexity of physiological processes and the nonlinear relationship between medical events. Therefore, manual feature engineering can be laborious and
time-consuming. In this dissertation, the framework relies on deep neural networks based approach
to learn optimal features directly from the data itself without any human guidance, allowing the automatic discovery of latent data relationships.
LSTMis one of the most extensively researched deep neural network that has been applied to
EHRs. Lipton et al. was the first study empirically evaluate the ability of LSTM to recognize patterns in multivariate time series of clinical measurements and to diagnose given frequently but irregularly
sampled clinical measurements. Their results show that LSTM based model outperform logistic
Many efforts have also been made, allowing LSTM to be better fit for EHRs applications. For
example, Lipton et al. focused on handling missing values and time irregularities. They sampled records in an hourly rate. Forward and back-filling were used to remove missing entries. A clinically
normal value was imputed if a single variable was missing entirely. In this dissertation, we addressed
the issue of missing values by first forward-filling vitals for 8 hours and lab values for 24 hours. For the rest of the missing entries, we applied zero filling and introduced a missing indicator. Some
other studies focused on addressing the episodic and irregular recording of EHRs. DeepCare[Pha16] used a vector derived from the time interval to model the forgetting dynamics. Baytas et al. divided the hidden memory into a short-term component and a long-term component. Thus, while the
information contained in the memory of the previous time step is being adjusted by the irregular
time interval, the global profile of the patient remains the same. Finally, Choi et al. adopted a simpler approach that concatenated its original input vector with elapsed time between consecutive
medical events. It is worth mentioning that this study also introduced sequential target replication
and auxiliary output training techniques. To address time irregularity, we introduced time interval between two medical recordings as an additional input variable to the model.
3.3
LSTM
LSTM[Sak14]is a type of Recurrent Neural Network (RNN) specifically designed to avoid the van-ishing and exploding gradient problems. LSTM enables the network to maintain the previous
information of hidden states as internal memory. Therefore, it is particularly suitable for tasks where long range temporal dependencies between events exist. A LSTM block (see Figure 3.1) consists
of a memory cell state denoted byCt and the following three gates: Forget gate ft ∈[0, 1], Input
gateit ∈[0, 1], and Output gateot ∈[0, 1]. These three gates interact with each other to control
the flow of information. During training, the network learns what to memorize and when to
al-low reading/writing in order to minimize the classification errors. More specifically, the Forget gate determines what information from the previous memory cell state is expired and should be removed; the Input gate selects information from thecandidatememory cell stateCt∗to update the cell state; the Output gate filters the information from the memory cell so that the model only
sigmoid sigmoid tanh sigmoid
Xt Yt
Yt Yt-1
Ct Ct-1
tanh
ft
it c*t ot
Forget Input Output
Figure 3.1A single LSTM block containing a forget, input and output gate
Table 3.1Contingency table for shock and non shock patients
Shock(Criteria) Non shock(Criteria)
Shock(ICD-9) 3,047 86
Non shock(ICD-9) 25,885 23,901
it=s i g m o i d(Wi·[yt−1,Xt] +bi)
ft =s i g m o i d(Wf ·[yt−1,Xt] +bf)
Ct∗=tanh(WC·[yt−1,Xt] +bc)
ot =s i g m o i d(Wo·[yt−1,Xt] +bo)
(3.1)
The memory cell valueCt and output labelyt from the LSTM block are computed using the
following formulas:
Ct=Ct−1·ft+Ct∗·it
yt =Ot∗t a n h(Ct) (3.2)
3.4
Datasets
In this study, we utilized retrospective EHRs obtained from Christiana Care Health System (CCHS) as part of our collaborative National Science Foundation supported grant entitled S.E.P.S.I.S.: Sepsis
Early Prediction Support Implementation System.
admis-sions per year and 1,100 hospital beds. The CCHS dataset includes retrospectively collected EHR
data for adult patients (age¾18 years) hospitalized within CCHS from July 2013 to December 2015, corresponding to 119,968 unique patients and 210,289 hospitalizations. Emergency department
(ED) visits without subsequent hospital admission were excluded.
According to the rules described in Chapter 2, we identified 3,047 shock positive visits and 23,901 negative visits who have consistent septic shock labeling from both ICD-9 and clinical rules
(Table 3.1). Given the imbalanced ratio of positive and negative shock visits, we further conducted a
stratified random sampling on shock negative visits while keeping the same underlying distribution of age, gender, ethnicity, length of stay and the number of records in both positive and negative
visits. As a result, the final dataset used to predict septic shock contains 6,049 visits (3,047 positives
and 3,047 negatives). This population is called “clean dataset".
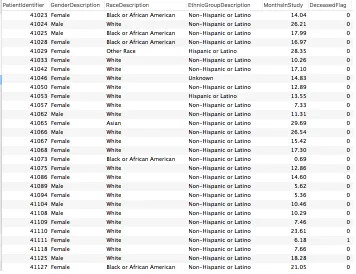
Data DescriptionThe EHRs contain static and dynamic information. Static information contains
background data generally collected once per visit, whereas dynamic information can be collected
multiple times during the entire hospitalization and has a time stamp associated with each record; hence, dynamic information can be expressed as a time series. In this study, we used 35 static
and 43 dynamic variables. The static ones include gender, age, ethnicity, 30 comorbid conditions
(e.g.,Diabetes and AIDS) and so on. A screenshot of static information is shown in Figure 3.2 . The
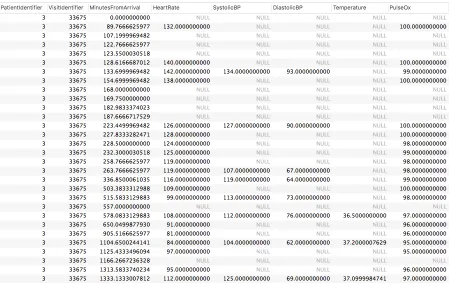
Figure 3.3The dynamic information in EHR
43 dynamic predictors are: 6 vitals (e.g., heart rate), 9 laboratory results (e.g., lactate, platelet), 2 assessment results (i.e., Glasgow comma scores and Glasgow best verbal response score), 18 culture
results (e.g., PCR influenza culture), 4 treatment (e.g., antibiotic), and 4 other categories (e.g., oxygen
source). A screenshot of dynamic information is shown in Figure 3.3.
3.5
Experiments
3.5.1 Two Experimental Settings
All the models were tested using two different early diagnosis tasks: the visit level early diagnosis
(left aligned) and the event level early prediction (right aligned).
For the visit level early diagnosis task (Figure 3.4), thefirstnhours of the patients’ EHRs were made available to the models. The goal is to predict whether the patient will develop Septic Shock
at any subsequent point during the visit. To carry out this task, the patients’ sequences were left
Figure 3.4Left align: predict whether a patient will have Septic Shock at the end of the visit using records in the firstn-hour window
Figure 3.5Right align: predict whether a patient will have Septic Shockmhours later
For the event level early prediction task (Figure 3.5), the goal is to predict whether the patient
will develop Septic Shockmhours later. To carry out this task, weright alignedall sequences by their endpoint. For Septic Shock patients, the endpoint is the onset time of Septic Shock, whereas
for non-Septic Shock patients, the end point is the end of sequences. Note that for all Septic Shock
patients, their shock onset time is identified as the first occurrence of any abnormality within the specified Septic Shock criteria as defined in Chapter 2. The EHRs within them-hour window leading
before the hold-off window (shaded area in Figure 3.5) were used to predict Septic Shockmhours
later.
3.5.2 Models for Comparisons and Implementations
In this chapter, we compared six classic machine learning baselines against LSTM. These six classic
ML baselines are Gaussian Naive Bayes, Random Forest, Logistic Regression, SVM, Decision Tree
and Multilayer Perceptron (MLP).
For classic ML baselines, features were extracted as these models do not handle time series
directly. Motivated by previous literature[Sha07], the mean, max, min, median, and standard devia-tion were calculated as features for numeric variables. For categorical variables, we counted how many times the variable was collected and how many times a given value was observed. Note that
static information was also included. The six machine learning baselines were all implemented using the scikit-learn package in Python. For Random forest, the number of trees was set to 10. The
function to measure the quality of a split was Gini impurity. The maximum depth was set to 4. The
minimum number of samples required to split an internal node was set to 2. The minimum number of samples required to be at a leaf node was set to 1. For SVM, ’rbf’ was used as kernel function. For
Decision Tree, CART algorithm was used. The minimum number of samples required to split an
internal node was 2. The minimum number of samples required to be at a leaf node was 1. For MLP, 3 layers of neural network with 100 nodes were used. The rectified linear unit (ReLU) was used as
activation function. Adam was applied as the optimization function. A constant learning rate of
0.001 was applied.
LSTM require us to address missing values and time irregularities in time series. To address
missing values, we adopted a missing indicator strategy originally proposed by Lipton et al.[Lip15]. An indicator variableMt was introduced for everyXt, whereMt =1 ifXt is missing and 0 otherwise. Then zero was imputed for the rest of the missing entries. To handle time irregularities, we introduced
the time interval between consecutive recordings as an additional variable. For LSTM layer, we used
200 hidden units.
3.5.3 Evaluation Metrics
AUC, F1 Score, accuracy, recall, and precision are the most commonly used evaluation metrics.
Accuracy tells the fractions of patients whose labels were correctly identified. Recall tells us what proportion of patients that actually had Septic Shock were correctly diagnosed. Precision tells us
what proportion of patients who were diagnosed as having Septic Shock actually had Septic Shock.
Finally, AUC calculates the trade-off between recall and specificity. F1 Score is the harmonic mean of precision and recall that sets their trade-off. We consider AUC and F1 Score as the most important
3.6
Results
3.6.1 Septic Shock Visit Level Early Diagnosis (Left Align)
In Table 3.2, we present the results for Septic Shock visit level early diagnosis when the observation
window size=24 hrs. The first six models are classic ML baselines and the last one is a vanilla LSTM. Since only dynamic information is used as input to LSTM, we use the notationdyn.LSTMfor clarity. The best performance metrics among classic ML baselines are highlighted in bold and the best
metrics among all models are highlighted in red.
Among the 6 classic ML baselines, Gaussian Naive Bayes achieves the highest recall=0.7250. Random Forest achieves the highest F1 Score=0.7150. Logistic Regression achieves the highest AUC=0.7885 and accuracy=0.7165. SVM achieves the best precision=0.7326. Comparing LSTM against all classic ML baselines, we found the former outperform the latter in all five performance
metrics significantly.
Table 3.2Septic Shock Visit Level Early Diagnosis (Observation Window=24 hrs)
Recall F1 Score AUC Accuracy Precision 1 Gaussian Naive Bayes 0.7250 0.7041 0.7553 0.6954 0.6844
2 Random Forest 0.7181 0.7150 0.7814 0.7138 0.7120
3 Logistic Regression 0.6861 0.7076 0.7886 0.7165 0.7304
4 SVM 0.6640 0.6966 0.7868 0.7108 0.7326
5 Decision Tree 0.6416 0.6468 0.6490 0.6497 0.6521
6 Multilayer Perceptron 0.6835 0.7063 0.7868 0.7158 0.7307
7 dyn.LSTM 0.8286 0.8611 0.9339 0.8664 0.8963
3.6.2 Septic Shock Event Level Early Prediction (Right Align)
In Table 3.3, we present the results for Septic Shock event level early prediction (right align) when
Table 3.3Septic Shock Event Level Early Prediction (Hold-off Window=1 hr)
Recall F1 Score AUC Accuracy Precision 1 Gaussian Naive Bayes 0.7114 0.7072 0.7683 0.7055 0.7031
2 Random Forest 0.6492 0.6837 0.7661 0.6996 0.7220
3 Logistic Regression 0.6621 0.6902 0.7693 0.7028 0.7207
4 SVM 0.6700 0.6947 0.7738 0.7056 0.7213
5 Decision Tree 0.5816 0.6165 0.6253 0.6381 0.6558
6 Multilayer Perceptron 0.7023 0.7005 0.7668 0.6998 0.6988
7 dyn.LSTM 0.7672 0.8000 0.8862 0.8082 0.8357
3.7
Summary
This chapter shows an comparisons between several classic ML baselines (e.g., Logistic Regression)
and LSTM on Septic Shock applications using EHRs. All models were tested on two different experi-mental settings: visit level early diagnosis (left align) and event level early prediction (right align).
The results from both experimental settings consistently show that LSTM significantly outperform classic ML baselines in all performance metrics. The temporal dependencies between medical
events extracted by LSTM provide valuable information for Septic Shock prediction. This finding
motivates us to explore how we can further improve LSTM while taking advantage of its ability in capturing temporal dependencies. While LSTM is more effective than other classic ML models, it
has worse results if the observation window size is less than 2 hours in visit level early diagnosis (left
align) setting because the sequence is too short. When hold-off window size is more than 24 hours in event level early prediction (left align), more than 70% patients do not have their records available
as their length of stay is less than 24 hours. Therefore, we mainly explored the models’ performance
CHAPTER
4
THRUST 1: INCORPORATING STATIC
INFORMATION AND ONE-SIDE CNN
4.1
Overview
This thrust explores whether LSTM can be improved by incorporating static information through a
dense layer, or applying a Convolutional Neural Network (CNN) layer to extract temporal-invariant
patterns from the dynamic information, or both.
4.2
Related Work
Static InformationEsteban et al.[Est16]introduced an independent dense layer to RNN to process static information. The output was then combined with the hidden states of RNN at every time step.
The models were applied to predict the outcome of patients with kidney failure. The results showed
that the model’s performance was improved greatly after static information was incorporated. Our framework also incorporated static information through a dense layer. The difference is,
their study used outpatient data to predict the outcome of a patient’s next visit. Thus, the static
duration of that visit. Therefore, we concatenated the static information with LSTM only atthe last time step.
CNNOriginally invented for computer vision, CNN has been shown to achieve remarkable
results in many image/video related tasks[Kri12]. Despite its huge success in vision, its applica-bility to EHRs is still unclear and mixed results have been reported. For example, Razavian et al. [Raz16]compared three variations of CNN with LSTM and found all four models achieved similar performances. Che et al.[Che17]applied CNN with different filter sizes: smaller filter size captured short-term dependency whereas larger filter size captured longer temporal dependency. Unlike im-age processing tasks, where convolution operation is applied over both width and height, this study
only applies convolution operations over the temporal dimension but not the attributes/feature dimensions. Their model was applied to two tasks: diabetes prediction and heart failure prediction. The results showed the model performs well in the first task, but not in the latter. Another study [Che16]proposed a similar CNN model for extracting phenotype. In contrast to the previous model, where a dense layer was added on top of CNN to make the final prediction, this study investigated several temporal fusion mechanisms[Kar14]. Finally, Suresh et al. compared CNN with LSTM to predict different interventions and found mixed results.
Our framework also applied CNN and only allowed its convolution operations to be applied over the temporal dimension. However, our framework is different than previous studies in that
LSTM was applied on top of CNN to capture temporal dependencies, whereas the previous literature applied a dense layer or temporal fusion mechanisms instead. As far as we know, this is the first
attempt to combine both CNN and LSTM for Septic Shock prediction using EHRs.
4.3
Framework
In this thrust, the framework is based on LSTM. It is further extended by introducing two additional
components: a dense layer that incorporates static information, and a CNN layer that extracts
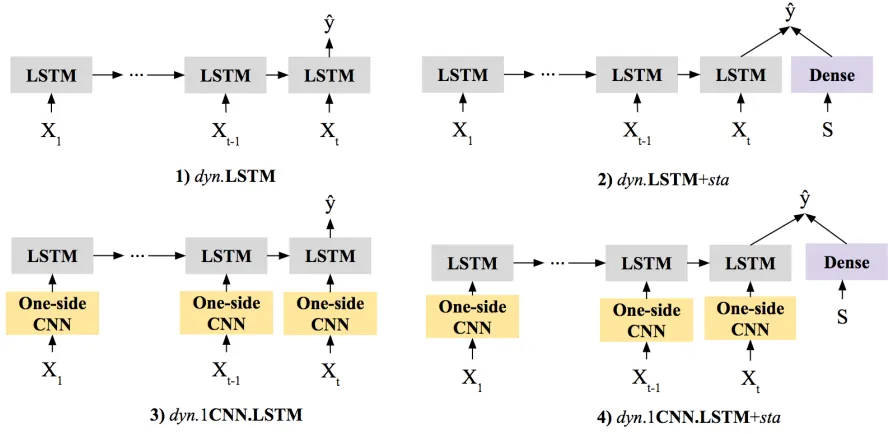
temporal-invariant patterns from the dynamic information. To determine the effectiveness of introducing static information and 1CNN to LSTM, four models are compared against each other as
illustrated in Figure 4.1. The dynamic information is represented as a sequence:x1.x2, ...,xT. The
static information is represented as S. The output is the predicted septic shock label, represented as ˆy. Dense represents a dense layer (or a fully connected layer). The first model is a plain LSTM named as
dyn.LSTM wheredynrepresents dynamic information. The second model isdyn.LSTM+sta, which combines LSTM with a dense layer that handles static information.starepresents static information. Their outputs are combined to make final septic shock prediction. The third modeldyn.1CNN.LSTM
Figure 4.1Framework in Thrust 1
Static Informationour framework employs a dense layer (or fully connected layer) to extract
compressed representations from static information. The output is then concatenated with the
hidden states of LSTM only in thelast or finaltime step.
1CNNOur framework employs CNN ( Figure 4.2) to extract local, temporal-invariant dependency.
The input of CNN is dynamic information represented as time series; the output of CNN is compact state representations that are further fed into LSTM in the next step. The CNN consists of three
types of layers: the Convolutional Layer, the Rectified Linear Unit (ReLU) Layer, and the Pooling
Layer. The Convolutional Layer employs a set of convolutional filters that look for specific patterns, the ReLU layer introduces non-linearity. The pooling layer reduces the spatial/temporal span of the extracted features.
The convolutional filters always span the entire feature dimension, but are connected to only a small temporal region of the data. They carry out a set of computations to determine whether
specific patterns show up. Then the filters traverse along the temporal direction of the sequence,
producing a sequence of outputs indicating where different patterns occur. Note that when CNN is applied to image tasks, the filters were allowed to travel through both width and height dimensions.
However, when it is applied to EHRs, the convolutional filters moveonly in the temporal dimension. Therefore, we will use the terms two-side CNN (2CNN) to refer to its application on images, and one-side CNN (1CNN) to refer to its application on EHRs.
This demonstrates 1CNN architecture has the following distinguishing properties: local receptive
Figure 4.21CNN extracts temporal-invariant patterns from dynamic information
employs a set of filters which are only connected to local temporal region. The temporal extent of
the connectivity is controlled by a hyperparameter calledlocal receptive field. Figure 4.2 shows an example of a convolutional layer with alocal receptive fieldof size 3. Parameter sharing is employed to limit the number of parameters and it is based on the reasonable assumption that if a pattern
exists at some temporal location, then it can also exist in other temporal location. More specifically,
the convolutional filters traverse from one location to the next, carrying out a set of computations to look for specific patterns. Finally, the pooling layer performs temporal sampling by taking an
average or using the min/max operation, thereby reducing the model’s sensitivity to shifts and distortion. Note that the CNN is capable of learning its own feature extractors automatically through backpropagation.
4.4
Experiments
In this thrust, we used the same CCHS EHRs as described in Chapter 3.4. Four modelsdyn.LSTM,
dyn.LSTM+sta,dyn.1CNN.LSTM anddyn.1CNN.LSTM+stawere compared against each other. All the models were tested in two different experimental settings: the visit level early diagnosis (left
align) and the event level early prediction (right align). For a detailed descriptions of these two
experimental settings, please refer to Chapter 3.5.1.
The application of LSTM require us to address missing values and time irregularities in time
series. A detailed description is provided in Chapter 3.5.2. For LSTM, we used 200 hidden units.
For 1CNN, 50 filters with filter size=4 and pooling size=2 were used. Since the task is to predict Septic Shock, binary Cross-entropy was applied as loss function and Adam optimizer was used for
optimization. Early stopping were applied to avoid overfitting.
descriptions of these metrics, please refer to Chapter 3.5.3.
4.5
Results
4.5.1 Septic Shock Visit Level Early Diagnosis (Left Align) for Thrust 1
In Table 4.1, we present the results for Septic Shock visit level early diagnosis when the observation
window size=24 hrs. The best model among all models are highlighted in red.
Four modelsdyn.LSTM,dyn.LSTM+sta,dyn.1CNN.LSTM anddyn.1CNN.LSTM+staare com-pared against each other. The best model among them isdyn.LSTM+sta, which achieves the highest F1 Score=0.8791, AUC=0.9538, accuracy=0.8823 and precision=0.9036.dyn.1CNN.LSTM+stahas the best recall=0.8644. Comparing models with static information against models without static information (dyn.LSTM+stavs.dyn.LSTM anddyn.1CNN.LSTM+stavs.dyn.1CNN.LSTM ), we find adding static information improves all performance metrics, except thatdyn.1CNN.LSTM +stahas slightly worse precision thandyn.1CNN.LSTM (0.8777 vs. 0.8830). Then we compare the models with 1CNN layers against models without 1CNN layers (dyn.1CNN.LSTM vs.dyn.LSTM anddyn.1CNN.LSTM+stavs.dyn.LSTM+sta), we find adding 1CNN layer only improves the recall, whereas the rest of the metrics are affected negatively.
Table 4.1Septic Shock Visit Level Early Diagnosis (Observation Window=24 hrs) in Thrust 1
Recall F1 Score AUC Accuracy Precision
1 dyn.LSTM 0.8286 0.8611 0.9339 0.8664 0.8963
2 dyn.LSTM+sta 0.8559 0.8791 0.9538 0.8823 0.9036
3 dyn.1CNN.LSTM 0.8352 0.8584 0.9306 0.8623 0.8830
4 dyn.1CNN.LSTM+sta 0.8644 0.8710 0.9449 0.8720 0.8777
To investigate whether the same patterns exist when the observation window size changes, Figure 5.7 show the most robust metrics AUC and F1 Score while varying the observation window
from 3 hours to 24 hours by 1 hour increments. For all models, both evaluation metrics increase
over time because more information became available as the observation window becomes larger. As we can see, the model achieves the best F1 Score and AUC isdyn.LSTM+sta. Comparing mod-els with static information and those without static information (dyn.LSTM+stavs.dyn.LSTM anddyn.1CNN.LSTM+stavs.dyn.1CNN.LSTM), adding static information achieves better results in both F1 Score and AUC. Comparing models with 1CNN layer and those without 1CNN layer