Modified Polyester Fibre Concrete Ability to
Arrest Cracking Due To Drying Shrinkage
Vishal
1, Prof. Sheo kumar
2, Dr.V.Pandey
3P.G. Student, Department of Civil Engineering, BIT Sindri, Dhanbad, Jharkhand, India1 Associate Professor, Department of Civil Engineering, BIT Sindri, Dhanbad, Jharkhand, India2 Head of department, Department of Civil Engineering, BIT Sindri, Dhanbad, Jharkhand, India3
ABSTRACT: This paper focuses on the experimental investigation carried out on modified polyester (recron3s) fibre reinforced concrete with fibre taken in weight fraction of 0.25%, 0.5%, 0.75%, 1% and 1.25% to the weight of cement in mix, which was prepared using normal hand mixing with general approved procedure. All raw constituent as cement, aggregates and water are tested and examined for appropriate concrete mix. The crack due to drying shrinkage was studied for concrete by comparing specimen with different proportions of polyester fibre. An experimental arrangement is prepared with a panel, binding wire, smooth plastic film etc and exposing specimen to extreme condition to gain enough crack width that can be evaluated. The cracking is determined by comparing the cracking of test panels exposed simultaneously to a set of severe conditions designed to cause cracking, this is an experimental test to determine cracking only due to drying shrinkage. The net result of all these impart that fibre composite most amazing effect in controlling dry-shrinkage crack under extreme condition which is unheard of in ordinary concrete. Addition of Recron fibres Contributed towards the secondary reinforcement at micro level with bridging action which resulted in controlling the formation of micro-cracks.
KEYWORDS: Cracking,Drying shrinkage, Concrete, Polyester fibre & weight fraction.
I. INTRODUCTION
Low tensile strength is one big disadvantage of concrete despite its high compressive strength. When subjected to tensile stresses, unreinforced concrete will crack and fail easily. Based on previous studies, fibre reinforcing increases tensile loading capacity and improves properties such as fracture toughness, ductility, crack-width control, and make it light weight per volume. Reinforcing fibres will stretch more than concrete under loading. Fibrous Concrete behaves normally as if it were unreinforced until it reaches its “first crack strength”. After this point the force is transferred to the fibres which hold the concrete together beyond its normal fracture point. It is important to understand that the yield strength of the fibres is not fully reached by the fibrous concrete mix during testing due to fibres pulling out of the composite. Some fibres are more “slippery” than others and affect the property of the concrete which is based on the total energy absorbed by the fibres prior to failure.
Properties of Fibre Reinforced Concrete are influenced by: - ● Type of fibres used. ● Volume percent of fibre: this is the percent of fibre within the concrete mix ● Aspect ratio: the length of a fibre divided by its diameter which is related to surface area of fibres ● Orientation of the fibres in the matrix: usually random within the concrete mix or spray.
II. RELATEDWORK
The test panel here in the experiment is exposed to adverse conditions that incorporate the major causes of cracking this maximizes the cracking of the test specimen. Test makes the use of panel, 600 x 800 mm specimens only 19 mm depth. The first numerical results of the test can become available within a matter of hours and complete results are normally available within 24 hours.
Mixing technique: Since test use the panel of 19 mm thick and tries to maximise the cracking to study the effect of admixture. Coarse aggregate are not to be introduced in panel. So mix starts with cement past with high water-cement ratio 0.60, (which is kept high to gain more shrinkage & more crack so that the crack can be evaluated) then coarse aggregate introduce in mix after small time of mixing as they got coated with cement past. Coarse aggregate screened out by help of screen. After that fine aggregate and fibre are introduced in mix.
Maximizing Crack:- The panel used in test is provided with cover of smooth plastic film to avoid any bottom restraining & water move to upper side & 19mm from the side of panel binding wire run throughout the perimeter of panel in three layer one above another. This is done to restrain from the sides or one can say control the shrinkage of specimen from side.
The mix is poured in panel and properly spread with the help trowel and 600mm flat bar with painted side to obtain smooth finish. Just after that blower are used on both panel in tilted position for next four hour and at same time casted specimen is exposed to full sun (temp approx 32 c to 42 c). This should kept in mind test must be start at approx 9 am in sunny day so to obtain harsh condition to cause crack. No curing is done to cast sample. Cracks are visible within four hours of casting and in next twenty hour cracks open wide and ready for evaluations. Panels re-evaluated at 24 days have shown no significant further change in cracking patterns.
Crack lengths and average crack widths are measured and recorded for each panel. Crack widths divided into four categories, each of which is assigned a weighted value:
Table 1 Crack width & weighted value
Crack width Weighted value Large (about 3 millimetres) 3mm
Medium (about 2 millimetres) 2mm Small (about 1 millimetre) 1mm
Hairline (about 0.5 millimetre) 0.5mm
For each categories crack length the weighted value is multiplied by the crack length in millimetres to give the weighted average value. The sum of the weighted average values of all cracks in a panel is called the “total weighted average value” for the panel. This represents the cracking value.
The following are some of the factors that contribute to cracking:
• Materials and design • placing and finishing techniques • Temperature and humidity• curing practices • Ground conditions (for slabs on ground)
This test is to analyse the effect of drying shrinkage on cracking not individually drying shrinkage or cracking.
III.CRACKINGDUETODRYING
S
HRINKAGEIV.EXPERIMENTAL RESULTS
:-M25mix design is used for the test, Cement: used, Portland Slag Cement (is 455:1989), Fine aggregate of zone two, Coarse aggregate maximum size 20mm with 40 % 10mm below & portable water is used for the test.
table 2 Portland slag CEMENT (grade 33)
Table 2 shows property of cement based on the test performed in lab (as per IS code specification) after collecting Portland slag cement from source,
to justify that it play proper role in concrete.
Table 3 Properties of fine aggregate: Table 3 Properties of coarse aggregate:
Specific gravity 2.75 Specific Gravity 2.63 Water absorption 0.5% Water absorption 1% Fineness modulus 4.37 Fineness Modulus 2.88
Free (surface) moisture Nil Free (surface) moisture Nil
Table 3 and Table 4 shows property of coarse and fine aggregate respectively based on the test performed in lab (as per IS code specification) after
collecting coarse and fine aggregate from source to justify that it play proper role in concrete.
Mix Proportion (by weight). (Table-5)(M 25)
Water : Cement : FA (sand) : CA (stone chips) 197.7 : 414 : 551.23 : 1226.5 0.48 : 1 : 1.33 : 2.96
Table 5 shows mix proportion of concrete by weight which is obtained as per IS 456:2000. Here as per mix design ratio of water to cement is 0.48 while fine aggregate is 1.33 and coarse aggregate is 2.96.
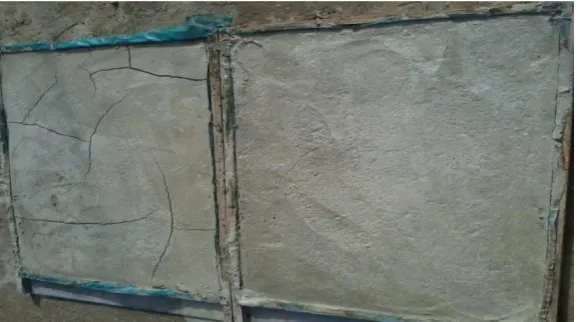
Fig 1 Test specimens after 20 hours of testing
Specific gravity 3.12 Initial setting time (min) 115 Final setting time (min) 435 Standard consistency of cement 31% Compressive strength of cement sample
33N/mm² Soundness of sample 0.30mm fineness test (by sieve of 9 micron) 97%
Figure 1 showing test specimens after 20 hours of testing. A control panel (left) show maximum cracking. A test panel (right) differs from the control panel in one respect that is to be checked for its effect on changing the cracking. In this particular instance the test panel contains modified polyester (Recron) fibres while the control panel does not.
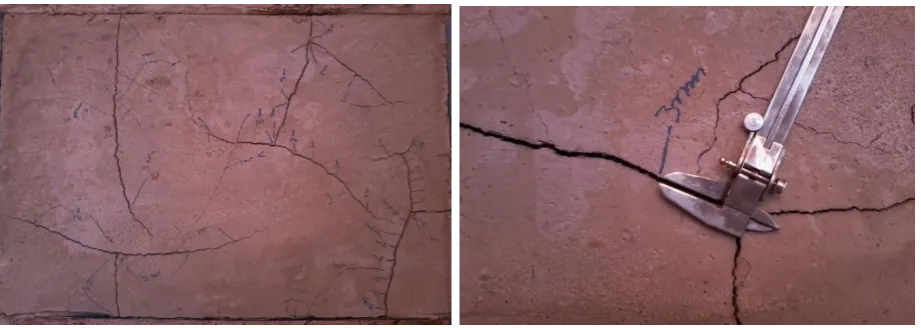
Figure 2 & 3 showing close view test specimens after 20 hours of testing. Here Figure 2 shows whole crack thought the panel with different zone of cracking and figure 3 shows individual measurement of crack of 3 mm with the help of
vernier scale.
Table 6 Crack width & weighted value
Fiber content
Test
panel 3mm crack Avg 2mm crack Avg 1mm crack Avg <1mm crack Avg 0 % Panel 1 517
523 1210 1070 1065 1175 800 786 Panel 2 529 930 1285 762
0.25% Panel 1 0
0 0 0 389 405 1288 1240 Panel 2 0 0 421 1192
0.50% Panel 1 0
0 0 0 0 0 1067 1040
Panel 2 0 0 0 1013
0.75% Panel 1 0
0 0 0 0 0 369 386
Panel 2 0 0 0 403
1% Panel 1 0
0 0 0 0 0 114 112
Panel 2 0 0 0 110
1.25% Panel 1 0
0 0 0 0 0 0 0
Panel 2 0 0 0 0
Table 6 show the reading taken on panels for evaluation cracking. Table shows reading in all percentage of fibre considered with average value for all four weighted value of crack (3mm, 2mm, 1mm, <1 mm). As above data 3mm cracks omitted when just 0.25% fibre introduced in mix.
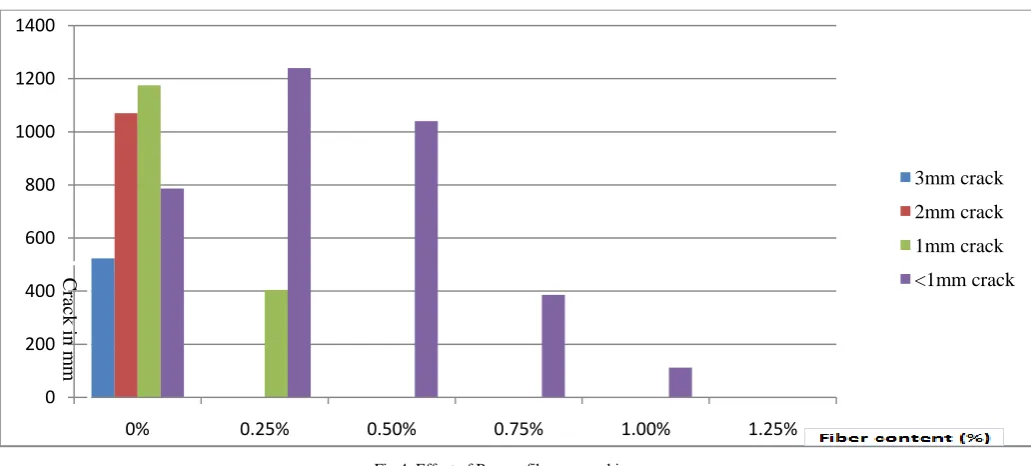
Fig.4. Effect of Recron fibre on cracking
The bar graph shown in Fig.4 shows cracks of different width with respect to different fibre contain panel as above graph in 0.50% fibre content we got only crack up to 1040 mm which width is less then 1mm and in 1.25% crack completely vanished. Here is the test result of panel containing different percentage of fibre.
Control with 0% of fibre: - =523 × 3 + 1070 × 2 + 1175 × 1 +786 × 0.5 =5277 mm2
Panel with 0.25% of fibre: - =0 × 3 + 0 × 2 + 605 × 1 + 1240 × 0.5 =1225 mm2
Panel with 0.5% of fibre: - =0 × 3 + 0 × 2 + 0 × 1 + 1040 × 0.5 =520 mm2
Panel with 0.75% of fibre: - =0 × 3 + 0 × 2 + 0 × 1 + 386 × 0.5 = 193 mm2
Panel with 1% of fibre: - =0 × 3 + 0 × 2 + 0 × 1 + 112 × 0.5 = 56 mm2
.
Panel with 1.25% of fibre: - =Nil
Table.6. Cracking in panels of flowing six different ratios of Recron Fibres (percent by weight of cement).
Panel Cracking (Total weight average Value) in mm2
Reduction in crack In %
1. Control (0% of fibre) 5277 - 0% 2. 0.25% fibrous 1225 =(5277-1225)*100/5277 76.78% 3. 0.5% fibrous 520 =(5277-520)*100/5277 90.14% 4. 0.75% fibrous 193 =(5277-193)*100/5277 96.34% 5. 1% fibrous 56 =(5277-56)*100/5277 99% 6. 1.25% fibrous 0 =(5277-0)*100/5277 100%
0 200 400 600 800 1000 1200 1400
0% 0.25% 0.50% 0.75% 1.00% 1.25%
3mm crack 2mm crack 1mm crack <1mm crack
C
rac
k
in
m
Table.6 shows the total weight average value of crack in mm2 and reduction in cracking with respect to control panel for each percentage of fibre taken in experiment.
FIBRE CONTENT %
As per table 6 line graph between percentage of reduction in crack percentage and fibre contain is drawn. As per it huge rise can be seen from 0% to 0.25%. Then steady rise can be seen from 0.25% to 1%
V. CONCLUSION
Cracking due to shrinkage is very effectively checked by addition of fibre even in small amount, As result shows that cracking due to shrinkage is reduced 76.78% when 0.25% of fibre by weight of cement is add to mix and in geometric progression manner increase to 90.14% when 0.5% of fibre by weight cement. The fibres act as secondary reinforcement (actually fibre boost the strength in micro label and maintain the homogeneous strength quality even in small cross-section) which not only increase strength also checking these cracks so amazingly that it almost got disappear when 1.25% of fibre by weight of cement added( become 0% in 1.25% fibre). The crack appears in control panel shows overall stresses developed because of sensitivity to the water- cement ratio of the paste. These cracks develop slowly maximum percent of them develop under 24hrs. Since most drying shrinkage cracks start as micro cracksin the mortar fraction of the concrete, the crack evaluationtest described here has been based on thisfraction.
REFERENCES
1. M. H. Zhang and G. Yang (Department of Civil Engineering, National University of Singapore, Singapore)International Journal of Impact Engineering Volume 31, Issue 7, Pages 825–841, August 2005
2. Ronald F. Zollo, “Fibre-reinforced Concrete: an Overview after 30 Years of development”, Cement & Concrete Composite, Vol. 19, 107-122, 1997
3. Clifford N. MacDonald, “Cracking Histories of Synthetic Fibre Reinforced Concrete Applications” American concrete institute, volume-276, page 1-10, on March 1 2011.
4. Kraai, Paul P. "A proposed test to determine the cracking potential due to drying shrinkage of concrete." Concrete Construction 30, no. 9 (1985): 775-778. PUBLICATION # C850775, the Aberdeen Group, 1985
5. P.S. Song, S. Hwang and B.C. Sheu, “Strength properties of nylon- and polypropylene fibre- reinforced concretes”, Cement and Concrete Research, Vol. 35, 1546-1550, 2005
0 20 40 60 80 100 120
(0% fiber) 0.25% fiber 0.5% fiber 0.75% fiber 1% fiber 1.25% fiber Reduction in crack%
Reduction in crack% Reduction in
6. Clifford N. MacDonald , Michael L. Ballouy & Daniel T. Biddle (_Forta Corporation, Minnesota, USA Bullhide Fibers and Shotcrete Supply, Utah, USA Forta Corporation, Pennsylvania, USA .Respectively ) 2009 ECI Conference on Shotcrete for Underground ,Support XI ,Paper 5, 2009
7. D.SUJI1, S. C NATESAN2, & R .MURUGESAN3 (1Sathyabama Institute of Science and Technology, Chennai, Tamil Nadu, India)( 2VLB, Janakiammal College of Engineering and Technology, Coimbatore, Tamil Nadu, India) (3Gojan School of Business and Technology, Red Hills Chennai, Tamil Nadu,) India Journal of Zhejiang University SCIENCE , Suji et al. / J Zhejiang Univ Sci A 2007 8(7):1101-1109, 2007 8. Labib, Wafa, and Nick Eden. "An Investigation into the Use of fibres in concrete industrial ground-floor slabs." Liverpool John Moores
University, Liverpool (2006).
9. ASTM C157, “Standard Test Method for Length Change of Hardened Hydraulic-Cement Mortar and Concrete.
10. IS 456: 2000, “Indian Standard Code of Practice for Plain and Reinforced Concrete”, Bureau of Indian Standard, New Delhi 11. IS 10262: 1982, “Recommended Guidelines for Concrete Mix design”, Bureau of Indian Standard, New Delhi