Study of CO
2
Laser Parameters for
Generating Slot with Multi Pass Using DOE
Approach
R.J.Ajudiya
1, A.A.Shaikh
2Research Scholar, Dept. of MED, Sardar Vallabhbhai National Institute of Technology, Surat, Gujarat, India1 Associate Professor, Sardar Vallabhbhai National Institute of Technology, Surat, Gujarat, India2
ABSTRACT: The micromachining can be employed by using laser as a source for evaporation of material. The control
of power and traverse speed of head are main parameters at the autofocus distance from workpiece to laser head. The present work deals with imparting laser beam on passing laser beam on straight line for multipass to observe material removal and the depth of cut obtained by the experimentation is used for statistical analysis to develop the predictive model. The predictive model developed for acrylic material found with fair closeness with experimental depth of cut obtained.
KEYWORDS: CO2 laser, slot, multi pass, micro machining, DOE
I. INTRODUCTION
Laser beam cutting (LBC) process has a wide range of applications in different manufacturing processes in industry due to its advantages of high cut quality and cost effectiveness through mass- production rate[1]. Micro machining using laser is the most common industrial application now a day in manufacturing, the basic process of laser machining is the use of a focused light beam to generate highly localized heating that melts the material. The molten material is subsequently blown away by a gas jet. Controlled, local laser heating can also be used to modify surface layers and textures of materials. One of the potential advantages with laser machining is that the cutting is a contamination-free, near-zero force operation, thereby eliminating the relatively high force loads and contamination potential common with traditional machining methods [2]. High intensity laser beam can be directed to a narrow region in order to instantly evaporate material with very narrow heat affected zone. This ability to cut instantly with extremely narrow laser beam distinguishes it from other cutting methods. The key to success in precision cut by laser depends on many factors such as laser characteristics, material properties of the specimen, and manufacturing parameters [3]. In precision manufacturing the quality of the cut is often measured based on the shape of the groove and amount of material removal. Therefore, better understanding of the process and role of various parameters are essential for investigation [4-5].
hole are significantly affected by laser power and inclination angle [8].At a given thickness, the MRR increases with an increase of laser parameters, i.e., pulse width, pulse frequency, and peak power. The effects of pulse width and pulse frequency are more prominent than those of peak power in enhancing the MRR. As the thickness of workpiece increases the MRR also increases [9]. It is found that increasing the laser power intensity enhances the kerf width size and this is more pronounced with reducing cutting speed. It was reported that a small variation in laser power results in a large variation in the kerf size. And also the influence of cutting speed was less than that corresponding to the laser power. Also, observed that by using defocused laser beam, which in retrain reduces the laser power density, would increase the kerf width size [10]. Increasing laser power and energy coupling factor increase the kerf width size and also any increase in the cutting speed reduces the kerf width. It was found that the laser power has a highly significant effect on the kerf size [11].The current experimentations are on the base of study the shape of generated hole by CO2
laser micromachining and the slot generated by using multi pass technique as well as the change in the shape with change in the input CO2 laser parameters.
II. EXPERIMENTAL PROCEDURE
The experiments are performed on the MERCURY Laser Pro CO2 laser machine 25 watt capacity and pure acrylic
specimen with 6 mm thickness is selected. Here acrylic material is preferred due to the absorptivity of laser beam energy is unity [12]. Laser cutting on acrylic material is non toxic process and due to its transferency generated cavity can be easily measured in the optical measurement system with higher accuracy. The thickness of acrylic material is selected by using try end error method in such a way that the generated cavity by minimum and the maximum level of the parameters should easily accommodated in the material. CO2 laser machine works with interfacing software. In the
CO2 laser machine the input parameters are power and speed of laser head. On the control console power and speed are
in the percentage form (i.e. 20% power = 5 watt power), the maximum travelling speed of laser head is 42 IPS (inch per second, i.e. 10% speed = 4.2 inch per second). The experiments are performed at the focus distance of 50 mm.
The machine setup used in present work is CO2 laser machine which removes the materials by two mode vector mode
and raster mode. Vector mode gives the line cut or curvature cutting ware as the raster cutting cuts the cavity on the material.
The design of experiments (DOE) method is followed for deciding the numbers of experiments run. The numbers of parameters are three or less than three the full factorial method is suitable for the optimization [13-14]. For generating slot input parameters are power (p), laser head speed (s) and numbers of overlapping lines (nl).
III. EXPERIMENTATION FOR GENERATING SLOT GEOMETRY
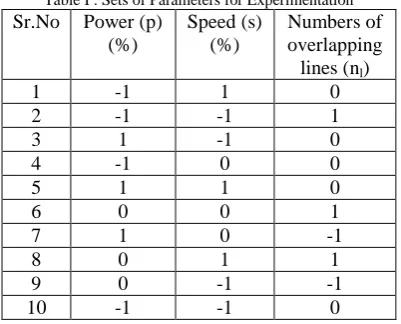
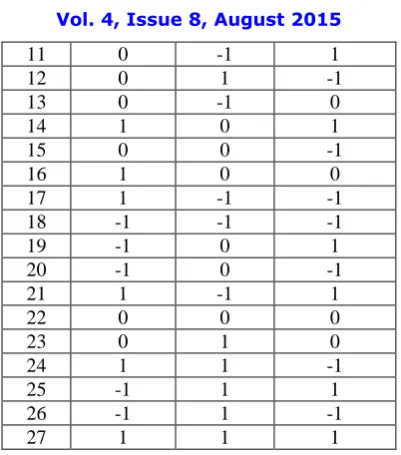
The selection of cutting parameters are on the bases of try end error method in such a way that the generated slot should be in the range of specimen size of 6 mm and DOE by the full factorial method have suggested the sets of experiments as mention in table no.I.
Table I : Sets of Parameters for Experimentation
Sr.No Power (p) (%)
Speed (s) (%)
Numbers of overlapping lines (nl)
11 0 -1 1 12 0 1 -1 13 0 -1 0 14 1 0 1 15 0 0 -1 16 1 0 0 17 1 -1 -1 18 -1 -1 -1 19 -1 0 1 20 -1 0 -1 21 1 -1 1 22 0 0 0 23 0 1 0 24 1 1 -1 25 -1 1 1 26 -1 1 -1 27 1 1 1
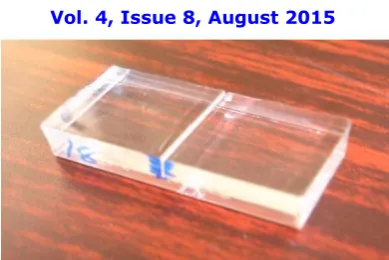
By doing the autofocus and selecting the parameters which gives the cutting limited to the specimen thickness the 60, 40, and 20 numbers of overlapping lines are engraved on the particular specimen as shown in fig1. with varying the power 90%, 60%, and 30%. With the combinations of speed 70%, 40%, and 10%. The experiments are performed as per run order suggested by the statistical software.
Fig. 1 Specimen 30×15×6 mm3 size
The numbers of overlapping lines are placed on the one layer of interfacing software file as shown in fig.2
Fig. 2 Overlapping lines in interfacing software
By using the various power levels, numbers of overlapping lines and various head travelling speed the generated slot on the acrylic material specimen is as shown in fig.3.
Numbers of overlapping lines
Fig. 1 Machined specimen in CO2 laser machine by overlapping of lines
The width of slot can be measured on the microscope interfacing with the computer with the software and the measurements can be taken using this interfacing software in the precision of 0.1 micron. The measurement interface is as shown in fig.4.
Fig. 4 Measurement of width of slot in computer interface of microscope
For measurements of slot depth all the specimens are arranged on the flatbed scanner with scale as shown in fig.5 indirect light is blow on the specimens to highlight the slot clearly that can be easily scan in the scanner.
Fig. 5 Scanning of specimen on flat bed scanner
The option of high resolution is selected for getting the scanning image that can be further processed through cad drafting package. In CAD package the a scale is developed by using the scanned steel rule as the reference. All the groves are measured by mapping the grove length with the generated scale as shown in fig.6.
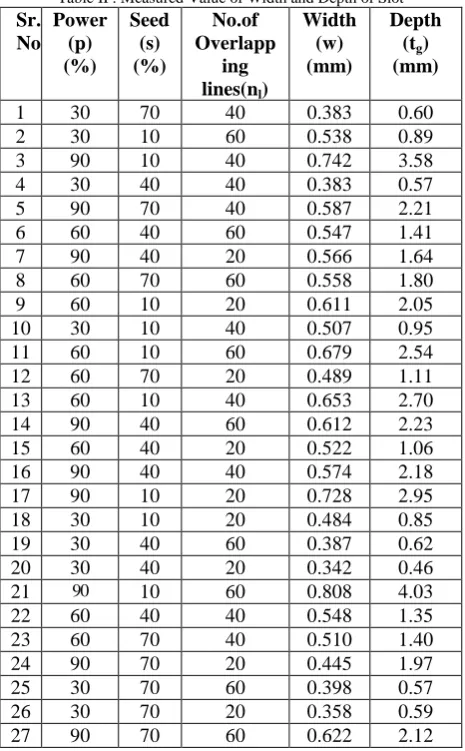
The width of grove measured from the microscope and the depth of grove measured from the cad package are mansion in the following table no II.
Table II : Measured Value of Width and Depth of Slot
Sr. No
Power (p) (%)
Seed (s) (%)
No.of Overlapp
ing
lines(nl)
Width (w) (mm)
Depth (tg)
(mm)
1 30 70 40 0.383 0.60 2 30 10 60 0.538 0.89 3 90 10 40 0.742 3.58 4 30 40 40 0.383 0.57 5 90 70 40 0.587 2.21 6 60 40 60 0.547 1.41 7 90 40 20 0.566 1.64 8 60 70 60 0.558 1.80 9 60 10 20 0.611 2.05 10 30 10 40 0.507 0.95 11 60 10 60 0.679 2.54 12 60 70 20 0.489 1.11 13 60 10 40 0.653 2.70 14 90 40 60 0.612 2.23 15 60 40 20 0.522 1.06 16 90 40 40 0.574 2.18 17 90 10 20 0.728 2.95 18 30 10 20 0.484 0.85 19 30 40 60 0.387 0.62 20 30 40 20 0.342 0.46 21 90 10 60 0.808 4.03 22 60 40 40 0.548 1.35 23 60 70 40 0.510 1.40 24 90 70 20 0.445 1.97 25 30 70 60 0.398 0.57 26 30 70 20 0.358 0.59 27 90 70 60 0.622 2.12
IV. DEVELOPING PREDICTIVE MODEL FOR SLOT WIDTH AND SLOT DEPTH
The measured values of slot width and slot depth are submitted in the statistical software work sheet and performed the statistical analysis in the statistical software for finding out the predictive equations of the response values individually and calculating the analysis of variance (ANOVA). The following tables III to VIII shows the parameter tables of regression in the analytical software.
Table III : General Linear Model : Width (w) Versus Power (p), Speed (s), Numbers of Overlapping Lines (nl)
Table IV : Analysis of Variance for Width(w), Using Adjusted SS for Tests
Source DF Seq SS Adj SS Adj MS F P p 2 0.212381 0.212381 0.106190 117.15 0.000 s 2 0.132871 0.132871 0.066436 73.29 0.000 nl 2 0.020386 0.020386 0.010193 11.24 0.001
Error 20 0.018129 0.018129 0.000906 Total 26 0.383767
Table V : Regression Analysis : Width (w) Versus Power (p), Speed (s), Numbers of Overlapping Lines (nl)
Predictor Coef SE Coef T P Constant 0.36507 0.03664 9.96 0.000 p 0.0035259 0.0003779 9.33 0.000 s -0.002592 0.0003779 -6.86 0.000 nl 0.0016778 0.0005668 2.96 0.007
S = 0.0480985, R-Sq = 86.1%, R-Sq (adj) = 84.3%
Table VI : General Linear Model : Slot Depth (tg), Versus Power (p), Speed (s), Numbers of Overlapping Lines (nl)
Factor Type Levels Values p Fixed 3 30, 60, 90 s Fixed 3 10, 40, 70 nl Fixed 3 20, 40, 60
Table VII : Analysis of Variance for Width, Using Adjusted SS for Tests
Source DF Seq SS Adj SS Adj MS F P p 2 15.7607 15.7607 7.8803 80.85 0.000 s 2 5.5123 5.5123 2.7561 28.28 0.000 nl 2 0.7811 0.7811 0.3905 4.01 0.034
Error 20 1.9494 1.9494 0.0975 Total 26 24.0035
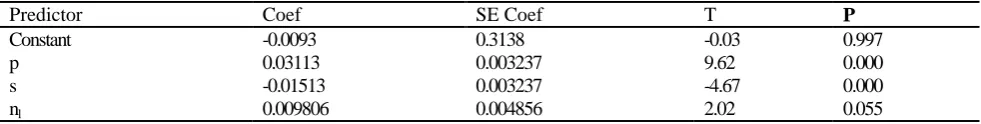
Table VIII : Regression Analysis : Slot depth (tg), versus Power (p), Speed (s), numbers of overlapping lines (nl)
Predictor Coef SE Coef T P
Constant -0.0093 0.3138 -0.03 0.997 p 0.03113 0.003237 9.62 0.000 s -0.01513 0.003237 -4.67 0.000 nl 0.009806 0.004856 2.02 0.055
S = 0.412007, R-Sq = 83.7%, R-Sq (adj) = 81.6%
Width (w) = 0.365 + 0.00353 p - 0.00259 s + 0.00168 nl
Depth(tg) = - 0.009 + 0.0311 p - 0.0151 s + 0.00981 nl
V. RESULTS AND DISCUSSION
From the output parameters the combine graph of slot width verses power, speed and numbers of overlapping lines are generated as graph no 5.The graph indicates that as the laser speed is increase the width of slot is decrease with constant power level because as the speed of laser head is increase the interaction time between laser spot and the material is decrease so due to less time of interaction less amount of material is evaporated.
Similarly as the numbers of overlapping lines are increase the width of slot is increase with particular power levels. Here as the numbers of overlapping lines are increase then the numbers of laser passes over the material is also increase so width is increase due to expansion of heat effected zone at the edges.
P OWER P OWER
SP EED SP EED
NO O F OVERLA P P ING LINES NO O F OVERLA P P ING LINES 70
40
10 20 40 60
0.8 0.6 0.4 0.8 0.6 0.4 POWER 90 30 60 SPEED 70 10 40
Interaction Plot (data means) for width
Graph 5 Width of slot verses speed and numbers of overlapping lines with particular power levels
Graph 6 shows the mean data of width verses power, speed and numbers of overlapping lines. It shows that as power is increase the width of slot is increase, as the speed of laser head is increase the width of slot is decrease and as the numbers of overlapping lines are increase the width of slot is increase.
M e a n o f w id th 90 60 30 0.65 0.60 0.55 0.50 0.45 70 40 10 60 40 20 0.65 0.60 0.55 0.50 0.45 POWER SPEED
NO OF OVERLAPPING LINES
Main Effects Plot (data means) for width
Graph 6. Slot width verses power, speed and no. of overlapping lines (mean data)
P OWER P OWER
SP EED SP EED
NO O F OVERLA P P ING LINES NO O F OVERLA P P ING LINES 70
40
10 20 40 60
3 2 1 3 2 1 POWER 90 30 60 SPEED 70 10 40
Interaction Plot (data means) for depth
Graph 7 Depth of slot verses speed and numbers of overlapping lines with particular power levels
Graph 8 is the combination of slot depth verses power, speed and numbers of overlapping lines. It indicates as power is increase the slot depth is increase, as the laser cutting head speed is increase the slot depth is decrease and as the numbers of overlapping lines are increase the slot depth is increase
M e a n o f d e p th 90 60 30 2.5 2.0 1.5 1.0 0.5 70 40 10 60 40 20 2.5 2.0 1.5 1.0 0.5 POWER SPEED
NO OF OVERLAPPING LINES
Main Effects Plot (data means) for depth
Graph 8. Slot depth verses power, speed and numbers of overlapping lines (mean data)
REFERENCES
[1]PowellJ.CO2 laser cutting.2nded..BerlinHeidelberg, NewYork:Springer-Verlag; 1998
[2]Jeff. Hecht (1986) “The laser guide book”, McGraw-Hill Company, Singapore, 1 to 75, 132-149. [3] W. Steen (2005) “Laser material processing”, Springer-Verlag Limited, London, 1-9, 61-152.
[4] Salman Nisar, M.A.Sheikh (2010) “The effect of material thickness, laser power and cutting speed on cut path deviation in high-power diode laser chip-free cutting of glass” Optics & Laser Technology 42 1022–1031
[5] X.C. Wang, H.Y.Zheng (2010) “High quality femtosecond laser cutting of alumina substrates”, Optics and Lasers in Engineering 48 657–663 [6] JayTu n, AlexanderG.Paleocrassas, NicholasReeves, NileshRajule (2014) “Experimental characterization of amicro-hole drilling process with short micro-second pulses by a CW single-mode fiber laser”, Optics and Lasers in Engineering 55(2014)275–283
[7] A.Bharatish, H.N.NarasimhaMurthy, B.Anand, C.D.Madhusoodana,, G.S. Praveena, M.Krishna(2013),” Characterization of hole circularity and heat affected zone in pulsed CO2 laser drilling of alumina ceramics “,Optics &LaserTechnology53(2013)22–32
[8] Kuan-Chung Yao, Jehnming Lin(2013), “The characterization of the hole-contour and plume ejection in the laser drilling with various inclination angles”,Optics & Laser Technology 48 (2013) 110–116
[9] Sanjay Mishra, Vinod Yadava(2013), “Modeling and optimization of laser beam percussion drilling of thin aluminium sheet”, Optics & Laser Technology 48 (2013) 461–474
[10]Uslan I. “CO2 laser cutting : kerf width variation during cutting”, Proceedings of IMechE, PartB, Journal of Engineering Manufacture 2005 ; 219 : 572–7.
[11] A A Shaikh, A M Varsi(2014), “Investigation on Depth of Cut by Varying Cutting Parameters for Single Pass Cutting On CO2 Laser”, IJIRSET.2014.0309018
[12] Radovanovic M, Dasic P. “Research on surface roughness by laser cut”, the Annals of University „„Dunarea De Jos‟‟ of Galati Fascicle VII, Tribology 2006:84–8.
[13] Jiju Antony (2003) “Design of Experiments”, Elsevier Science & Technology Books, ISBN: 0750647094.