Mass Production of Microalgae Using Waste
Water as Supplement and Extraction of Bio
Oil by Transesterification
G. Krithika
1, P. Manasa Satheesh
2Student, Department of Biotechnology, Holy Cross College (Autonomous), Tiruchirappalli, Tamil Nadu, India1
Director, Genewin Biotech, Hosur, Tamil Nadu, India2
ABSTRACT:Developments in the Biofuel production has created more awareness in Research due to the rapid increase in oil price and growing environmental issues. Microalgae have gathered attention towards them in the Biofuel production. Transesterification process converts algal oil or lipids to fatty acids. Because of their high Biomass and Lipid accumulation, the microalgae suited for the production of bio oil in industrial level. The lipid content was 28.22±1.38%, carbohydrate 16.8% and protein 58.2% for Chlorella pyrenoidosa. The amount of oil extracted was found to be 25.8 ml for (Alternate Media) AM1 and 20.6 ml for AM2. The pH was found to be 7.8 for AM1 and 7.6 for AM2. In this study, scaling up of Chlorella pyrenoidosa in poultry waste water was done with fertilizers and analysingparameters for its growth and production of Bio oil from Chlorella pyrenoidosa has been examined from the scaling up in poultry waste water.
KEYWORDS: Bio oil, Lipids, Carbohydrates, Chlorella pyrenoidosa, Proteins, Transesterification, Wastewater.
I. INTRODUCTION
Microalgae are sunlight-driven cells that convert carbon dioxide to potential biofuels, foods, feeds and high-value bioactives. Microalgae could provide alternatives to petroleum based fuels without competing with crops. Microalga is an economical and potential raw material of biomass energy [12].
Chlorella pyrenoidosa is a unicellular green alga that grows in fresh water. C. pyrenoidosa contains much more protein and chlorophyll than other plants. Spirulina, like any blue-green algae, can be contaminated with toxic substances called microcystins. It can also absorb heavy metals from the water where it is grown [7]. Chlamydomonas
is the algae from genus of microscopic, unicellular green plants (algae) which live in fresh water. It has been found that they can be used to generate hydrogen from light, water, and basic nutrients. The possibility of generating large quantities of hydrogen, which is a renewable fuel, from cheap and abundant sources is produced by Chlamydomonas
[11].A critical growth‐limiting factor is the carbon, usually supplied as CO2 that occurs in enriched environments.
Supply of pure CO2 into algae cultivations is expensive and not an encouraged option for large scale algae production.
However, through a lower cost option, algae have the ability to capture CO2 from combustion gas and from natural gas
operations and hold the opportunities to recycle CO2 [15].
from the results obtained by various trials and the extraction of bio oil is done successfully by transesterification process.
II. MATERIALSANDMETHODS
Collection of algal strains and Waste water:
The algal strains such as Chlorella pyrenoidosa, Spirulina and Chlamydomonaswere collected from NCIM, Pune and maintained properly in its selective medium at Genewin Biotech, Hosur. Poultry waste water was obtained from Maruthi Hatcheries, Hosur and Tannery waste water obtained from a leather industry Vanitech, Vaniyambadi.
Determination of Lipid Content in the Three Algae Species:
Extraction and determination of intracellular lipids were conducted according to the standard protocols in the previous literatures [1]and[3]by Gravimetry.Freeze-dried algal biomass (50−100 mg) were extracted three times with methanol containing 10% DMSO (volume fraction) for 50 min under stirring. Then the mixture was centrifuged (2000 g, 10 min), and the supernatant was removed. The residua were re-extracted twice with a mixture of hexane and diethyl ether (1:1, volume ratio) for 30 min. After extractions, hexane and water were added to the combined supernatants, so as to obtain a ratio of 1:1:1:1 (volume ratio) for the above four solvents. The mixture was shaken and then centrifuged for 10 min and the upper organic layer was collected. After the water phase was re-extracted twice with a mixture of hexane and diethyl ether (1:1, volume ratio), the organic phases were combined and evaporated to dryness. Then it was redissolved with a small amount of hexane. The lipid solution was transferred into a pre-weighed vial, initially evaporated in a water bath (30 °C) using a rotatory evaporator and then dried under high vacuum. The dried residua were weighed on an electronic microbalance.
Determination of Protein Content in the three Algae Species
The Lowry method was used to measure the protein content of the pre-treated biomass [2]and[16].The absorbance of the sample was measured at a wavelength of 750 nm in a spectrophotometer [5].
Reagents
Alkaline copper sulphate solution was prepared freshly by mixing 1.0 mL of 0.5% CuSO4.5H2O in 1%
Potassium sodium tartarate with 50.0 mL of 2% sodium carbonate in 0.1 N NaOH. Diluted Folin-phenol reagent was prepared by diluting Folin-ciocalteu reagent obtained with an equal volume of glass distilled water.
Procedure
To one millilitre of protein solution, 5.0 ml of alkaline copper sulphate solution was added and allowed to stand at room temperature for 10 minutes. Then 0.5 ml of diluted Folin-phenol reagent was added and mixed well[8]. The solution was allowed to stand for 30 minutes and absorbance was read at 500 nm using a Hitachi UV 2001 spectrophotometer. BSA (Sigma fraction V) was used as standard.
The protein content of the biomass was calculated using the following equation: Protein (%, w/w) = CVD/m x 100
where C is the protein concentration (mg L-1) obtained from the calibration curve, V is the volume (L) of the lysis buffer used to resuspend the biomass,
D is the dilution factor and m is the amount of biomass (mg).
Determination of Carbohydrate Content in the Three Algae Species
Anthrone reagent
Anthrone (50.0mg) and thiourea (1.0 g) were added to 100.0 ml of 72% cold sulphuric acid and stored in a dark bottle. Freshly prepared reagent was used for every estimation.
Trials done with Waste water and Fertilizers:
Two types of waste water were selected and trials were put with the Alternate media (AM1 and AM2) which are fertilizers available in the following ratios of N, P and K:
AM1: 0:52:34 (supplementing nitrogen with Urea)
AM2: 13:0:45 (supplementing P with super phosphate)
Various parameters necessary are measured in TWW and PWW for the growth of algae. Chlorella pyrenoidosawas trialled with various ratios with AM1 and AM2 fertilizers at pH 6, 7, 8. It was clearly seen that the TWW did not promote growth of Chlorella as the ratio of TWW was higher than the fertilizers. So the experiment was further continued with PWW. Altering the biological parameters of TWW, the Chlorella can be grown in the TWW with the various ratios along with the fertilizers supplementation.PWW was used for the growth of Chlorella once the biological parameters are analysed. Various trials such a PWW: AM1 and PWW: AM2 with the ratios 0:50, 50:0, 30:20, 20:30, 40:10, 10:40 were put using two different fertilizers for checking the suitable combination of ratio for the growth of Chlorella pyrenoidosa.
Estimation of Growth of Chlorella with CO2:
As with all photosynthetic organisms, algae use CO2 as a carbon source. No growth can occur in the absence
of CO2. Based on the average chemical composition of algal biomass, approximately 1.8 tonnes of CO2 are needed to
grow 1 tonne of biomass.
Method:
The CO2 coming out from a tall chimney was collected and sent in through a motor which directly sent the
CO2to the algae bottle. Side by side control with the aerators where kept and corresponding OD values recorded at
intervals of 1 hrs. each [6].
Bio oil Production:
The collected Chlorella was expanded in the Fog’s medium. The factors necessary for the cultivation of algae are Light, Temperature, and Nutrients. The algae which was cultivated was grown and then expanded in the 25 liters Bubble tops inorder to achieve the mass production of algae. The medium used for the growth of Chlorella was Fog’s medium. The algae was grown in the Bubble tops and the algal biomass was collected for the oil extraction. Flocculation is a reliable method for algae separation. The effect of culture pH on the flocculation efficiency was carried out by adjusting the culture pH ranging from pH 10 to pH 10.6 using either 5 M sodium hydroxide (NaOH) or 5 M potassium hydroxide (KOH). The bases were added to the culture by agitation using magnetic bar stirrer (38 mm), agitated at 200 rpm to allow for steady increase in pH [14].Biomass biologically is the material of plants which are specifically called lignocellulosic biomass. The biomass was collected after filtration and weighed.Algae were ground with motor and pestle and the ground algae were dried for 20 min at 80°C in a incubator for releasing water. Hexane and ether solution (20 and 20 mL) were mixed with the dried ground algae to extract oil. Then the mixture was kept for 24 h for settling.
Transesterification Process:
0.25 g NaOH was mixed with 24 ml methanol and stirred continuously for 20 minutes. The mixture of catalyst and methanol was poured to the algal oil in a conical flask and tranesterification process allowed to take place.The bio-oil is separated from the sedimentation by a flask separator. Bio-bio-oil was washed with 5 % sterile water until it becomes clean. Bio-oil dried by using a dryer and kept under air for 12 hrs. Harvesting has been claimed to contribute 20–30 percent to the total cost of producing the biomass [6].Bio oil production was measured by using measuring cylinder; pH was measured and stored for analysis.
III.RESULTS AND DISCUSSION Determination of Lipids,Proteins and Carbohydrates
Lipids are produced during physiological experiments and biomass production processes. Here, the lipid
content is estimated for three species.The lipid content was found to be high in Chlorella pyrenoidosa of
28.22±1.38 %followed by Spirulina of 24.00±4.49 %and Chlamydomonas15.61±0.63%.Proteins make up a large fraction of the biomass. The Lowry method is one of the most accurate methods for quantifying proteins [5]. Bovine serum albumin (BSA) is the most commonly used standard. The protein content was found to be highest in Chlorella pyrenoidosa of 58.2% followed by Spirulina of 52.6% and Chlamydmonas of 48%. Determination of carbohydrate concentrations is the colorimetricmethod based on reaction between hydrolysed carbohydrate solution and a colouring reagent that develops colour that is detectible in the visible range of the electromagnetic spectrum. Carbohydrate content was highest in Chlorella pyrenoidosa of 16.8% and lowest in Spirulina of 12.4%.
Table 1
Algae name Lipid content (%) Protein content (%) Carbohydrate content (%)
Chlorella pyrenoidosa 28.22±1.38 58.2% 16.8
Spirulina sp. 24.00±4.49 52.6 12.4
Chlamydomonas 15.61±0.63 48 14
In the lab scale estimation of Proteins, Carbohydrates and lipid content of the three algae species, it is clearly proved that Chlorella pyrenoidosa showed high level of Proteins, Carbohydrates and lipid than the other species. So the further works were carried out using Chlorella pyrenoidosa.According to studies available it is noticed that the bio oil extraction and lipid content is high in Chlorella pyrenoidosa than Spirulina and Chlamydomonas, so the work is carried out focusing only on this species.
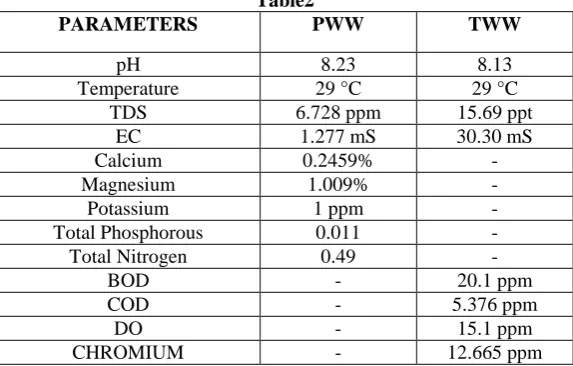
Table2
PARAMETERS PWW TWW
pH 8.23 8.13
Temperature 29 °C 29 °C TDS 6.728 ppm 15.69 ppt
EC 1.277 mS 30.30 mS Calcium 0.2459% - Magnesium 1.009% - Potassium 1 ppm - Total Phosphorous 0.011 - Total Nitrogen 0.49 -
BOD - 20.1 ppm COD - 5.376 ppm
DO - 15.1 ppm
CHROMIUM - 12.665 ppm
parameters specific for the water analysis to be used and it is not related with the growth of Chlorella. SO, PWW was used for the further trials and Bio oil production.
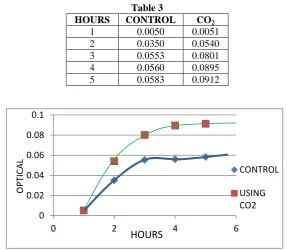
CARBON DIOXIDE EXPERIMENT FOR THE ALGAL GROWTH
Carbon dioxide experiment was conducted in order to check the growth of Chlorella using carbon dioxide. A control was also checked without using the carbon dioxide. The absorbance was taken for a period of 5 hours to check whether Carbon dioxide is helping the Chlorella growth[13].
Table 3
Chart 1 Graph Indicating the Growth ofChlorella Using Carbon dioxide
It was found that the carbon dioxide helped its growth and drastically the absorbance was increased each hour whereas the absorbance of the control was also found increasing slowly each hour. This proves that the Carbon dioxide is an important parameter for its rapid growth.
Bio oil Extraction by Transesterification andExpansion of Algae in Bubble Tops:
The Chlorella was expanded in 25 litres Bubble tops for the mass production of algae and the Biomass was collected for bio diesel production based on the various trials carried out. It is clearly found out that the ratio of 30:20 with AM1 and 25:25 with AM 2 proved to have fat growth of algae thus the expansion in large scale was also done with this particular ratio.
Fig - 1: EXPANSION OF CHLORELLA IN LARGE SCALE HOURS CONTROL CO2
1 0.0050 0.0051 2 0.0350 0.0540 3 0.0553 0.0801 4 0.0560 0.0895 5 0.0583 0.0912
0 0.02 0.04 0.06 0.08 0.1
0 2 4 6
CONTROL
USING CO2
HOURS
OPT
ICAL
AM1 – POULTRY WASTE WATER
30:20 AM2 – POULTRY
The expansion was done in the above ratio in the bubble tops and the growth of Chlorella was seen in both the ratios. It took about 1 week for the Chlorella to reach its maximum growth rate.
Scaling Up in Bubble Tops:
The scaling up of the PWW was done with AM1 fertilizer in the ratio 30:20 and the Chlorella was allowed for expansion. It took 10 days for the Chlorella to reach its maximum growth.
The scaling up of the PWW was done with AM2 fertilizer in the ratio 25:25 and the Chlorella was allowed for expansion. It took 10 days for the Chlorella to reach its maximum growth.
Chart 2 Graph Showing the Scaling up with AM1 Chart 3 Graph Showing the Scaling up with AM2
It was observed that the mean absorbance was 1.463±0.0039 on the 10th day which showed the efficiency of AM1 in PWW.It was observed that the mean absorbance was 0.71815±0.0239 on the 10th day which showed that AM2 was not much efficient in PWW when compared to AM1.
Flocculation:
The Flocculating agent used was Aluminium Chloride for the separation of algae and the water in the bubble top for the collection of biomass. The Flocculation involved the separation of species by gravity. The various techniques used for flocculating were decreasing the pH to 4 using acid, increasing the pH to 11 using alkali, Addition of ferrous sulphate, Addition of aluminiumsulphate, Addition of ferric chloride. It is found that decreasing the pH to 4 using acid seemed to help in flocculation faster followed by aluminium chloride. Trials were put and then concluded as to which method to flocculate algae in large scale production. Algae were collected and dried for 20 minutes at 80 °C in an indicator for releasing water. Hexane and ether solution (20 ml each) were mixed with the dried ground algae to extract oil. The mixture was kept for 24 hrs. for settling. The Biomass was collected after the Flocculation process and the collected biomass was weighed.
(a) 0
0.5 1 1.5
1 2 3 4 5 6 7 8 9 10 11
SCALING UP - AM1
OPTICA L DENSIT Y
DAYS
AV
G OD
00.2 0.4 0.6 0.8
1 2 3 4 5 6 7 8 9 10 11
SCALING UP - AM2
Opti cal Dens ity
DAYS
Avg
The collected Biomass cake obtained from AM1 after drying was observed as 21 g which was higher when compared to AM2 and this was further used for carrying out Bio oil production.
(b)
Fig. 2 Biomass Collection (a)Collected Biomass – Algal cake from AM 1 (b) Collected Biomass – Algal cakefrom AM 2
The collected Biomass cake obtained from AM2 after drying was observed as 18g.As the quantity obtained was lesser amount, it was not used for the bio oil production.
Evaporation of oil from algae:
The collected oil was evaporated in order to eliminate the catalyst mixture from the oil. The catalyst mixture contained Sodium hydroxide and the solvent Methanol. The extracted oil was evaporated in vacuum to release hexane and ether solutions using rotary evaporator.
Fig. 3 Evaporation of Oil
The evaporated solution which is free from the hexane and ether solutions was then separated from the algae after the Transestertification process to obtain the Bio oil content.
Fig. 4 Separation of Bio oil
IV.CONCLUSION
It was concluded that the Bio oil can be produced from the algal species efficiently which was environmental friendly and Pollution free. Algae species which is known for its high availability in nature, renewable energy source and low cost, it could be used to produce Bio oil in an inexpensive manner. In this study, the oil was produced from the algae efficiently by Transesterification. The amount of oil extracted was found to be 25.8 ml for AM1 and 20.6 ml for AM2. The pH was found to be 7.8 for AM1 and 7.6 for AM2. By this way, Chlorella pyrenoidosa can be used as renewable energy source.
V. ACKNOWLEDGEMENT
My sincere thanks to our Principal Dr.Sr.JEUSIN FRANCIS., Holy Cross College (Autonomous), Tiruchirappalli, for providing me an opportunity to carry out my project in the selected Research center.I solemnly express my heartiest gratitude to our beloved Dr.M. RAJALAKSHMI, M.Sc., M. Phil., Ph.D., Assistant Professor in Zoology, and Co-ordinator, Department of Biotechnology & Bioinformatics Holy Cross College (Autonomous), Tiruchirappalli, for her guidance and intellectual support that extended for successful completion of this work. The authors record their sincere thanks to Dr. V. PALANI, Managing Director of Genewin Biotech, Hosur for providing necessary laboratory facilities to carry out this work in his DBT certified laboratory.I express my sincere gratitude to Ms.MARY DANESHA FERNANDO, R&D Manager, Genewin Biotech, Hosur for her support & suggestion in the project work. Last but not the least I would like to extend my gratitude to other staff members of Genewin Biotech for their support in my project work.
REFERENCES
1. Chiara Bigogno, Inna Khozin-Goldberg, Sammy Boussiba, AvigadVonshak, and Zvi Cohen,“Lipid and fatty acid composition of the green oleaginous alga parietochloris incisa, the richest plant source of arachidonic acid”,Phytochemistry,Vol. 60, pp. 497−503, 2002.
2. Murphy, D.J., and Prinsley, R.T., “Interaction of Triton X-100 with the pigment– protein complexes of photosynthetic membranes”, Journal of Biochemistry, Vol.229, pp. 31–37, 1985.
3. Bligh, E.G., and Dyer,W.J., “A rapid method of total lipid extraction and purification”, Canadian Journal of Biochemistry and Physiology, Vol.37, Issue 8, pp. 911−917, 1959.
4. Bertoldi, F.C., Sant'Anna, E., and Barcelos-Oliveira, J.L., “Chlorella vulgaris cultivated in hydroponic wastewater”, Acta Horticulture, Vol. 843, pp. 203-210, 2009.
5. Peterson, G.L., “Review of the Folin phenol protein quantitation method of Lowry, Rosebrough, Farr and Randall”, AnalyticalBiochemitry, Vol. 100, pp. 201–220, 1979.
6. IvayloSirakov, Katia Velichkova, and GalinNikolov, “The effect of algae meal (Spirulina) on the growth performance and carcass parameters of rainbow trout (Oncorhynchusmykiss)”, Journal of BioSciences and Biotechnology, pp. 151 – 156, 2012.
7. Blinkova, L.P.,Gorobets, O.B., and Baturo, A.P., “Biological activity of Spirulina”, Journal of Microbiology, Epidemiologyand Immunobiology, Vol. 2, pp. 114-118, 2001.
8. Lees, M.B., and Paxman, S., “Modification of the Lowry procedure for the analysis of proteolipid protein”, Analytical Biochemistry, Vol. 47, pp. 184–192, 1972.
9. Rajasulochana,P.,Krishnamoorthy, P., and Dhamotharan,R. “Biochemical investigation on red algae family of KappahycusSp”,Journal of Chemical and Pharmaceutical Research, Vol. 4, Issue 10, pp. 4637-4641, 2012.
10. Kay, R.A., “Microalgae as food and supplement”. Critical Reviews of Food Science andNutrition, Vol. 30, pp. 555–573, 1991.
11. Dutcher, S., and Trabuco, E.C., “The UNI3 Gene is required for assembly of basal bodies of Chlamydomonas and encodes d-tubulin, a new member of the tubulin superfamily”, Molecular Cell Biololgy, Vol. 9, Issue 6, pp. 1293-1308, 1998.
12. Khan, S.A.,Hussain,M.Z., Prasad, S., and Banerjee,U., “Prospects of biodiesel production from microalgae in India”, Renewable Sustainable Energy Reviews,Vol. 13, Issue 9, pp. 2361-2372, 2009.
13. Sawayama, Inoue, S., Dote,Y., and Yokoyama,S., “CO2 fixation and oil production through microalga”, Energy Conversion and Management,Vol. 36, pp. 721-731, 1995.
14. SriharshaKarampudi, and Kamal Chowdhury,“Effect of Media on Algae Growth for Bio-Fuel Production”,NotulaeScientiaBiologicae,Vol. 3, Issue 3, pp. 33-41, 2011.
15. VinayakPathak, V., Chopra, A.K., Richa Kothari, Tyagi, V.V., “Growth characteristics of chlorella pyrenoidosa cultured in nutrient enriched dairy wastewater for pollutant reduction and lipid productivity”,Recent Advances in Bioenergy and Research, Vol. 2, pp. 310 – 317, 2013. 16. Hurkman, W.J., and Tanaka,C.K., “Solubilization of plant membrane proteins for analysis by two-dimensional gel electrophoresis”, Plant
BIOGRAPHY G. KRITHIKA
I am G. Krithika. I received my Undergraduate degree (B. Sc) in Plant Biotechnology from Holy Cross College (Autonomous), Tiruchirappalli, India, in 2006, and Master’s degree in Biotechnology from the St Joseph’s College, Tiruchirappalli, India, in 2008. In 2014, I joined the Department of Biotechnology, St Joseph’s College of Arts and Science for women, Hosur, as a Lecturer, and currently pursuing M. Phil Biotechnology in Holy Cross College (Autonomous), Tiruchirappalli. My research interests include working with Bio-oil production of Macro and Micro algae and estimating it properties.
Mrs. MANASA SATHEESH
Degree earned: Under graduate in Bachelor of technology (Biotechnology) from Sathyabama University, Chennai, Tamil Nadu in the year 2005 – 2009. Post-graduation in Master of technology (Biotechnology) from Sathyabama University, Chennai in the year 2010 to 2012. Currently pursing Ph.D. at VIT University, Vellore, Tamil Nadu, India