Abstract
AYRES, JENNIFER. Synthesis and Characterization of Nanoparticle Assemblies for Electronic Applications. (Under the direction of Dr. Christopher B. Gorman.)
While significant effort has been made to synthesize molecular wires for
electronic applications, the ability to insert these molecules between two metallic
contacts with directional control has yet to be demonstrated. Control over
molecular orientation is critical to the development of molecular devices such as
diodes, capacitors and transistors. In this study, directional control is achieved
using orthogonal self-assembly to synthesize electronic junctions between
nanoparticles of different compositions. Phenyl ethynylene oligomers were
synthesized with different end groups. One molecule was functionalized with a
thiol which exhibits preferential binding to gold and an isocyanide which exhibits
preferential binding to platinum. The other was functionalized with a thiol for
binding to gold and a carboxylic acid which exhibits preferential binding to metal
oxides.
One of the major challenges of this work was the synthesis of nanoparticle
building blocks that were suitable for the formation of these heterodimeric
structures. Metal and metal oxide particles were synthesized with capping
ligands that provided stability yet did not sterically hinder heterodimer formation.
Once appropriate nanoparticles had been identified, preliminary studies indicated
heterodimer formation. However, characterizing these structures presented
Several characterization techniques, including transmission electron microscopy
(TEM), size-exclusion chromatography (SEC), several types of electrophoresis
and small-angle x-ray scattering (SAXS), were evaluated for their ability to
characterize these structures with statistical accuracy. While all of these
techniques did indicate the presence of dimers or larger aggregates in solution,
Synthesis and Characterization of Nanoparticle Assemblies for Electronic Applications
by Jennifer Ayres
A dissertation submitted to the Graduate Faculty of North Carolina State University
in partial fulfillment of the requirements for the Degree of
Doctor of Philosophy
Chemistry
Raleigh, North Carolina
2009
APPROVED BY:
______________________________ Dr. Edmond Bowden, Chemistry
_____________________________ Dr. Gregory Parsons, Chemical and
Biomolecular Engineering
________________________________ Dr. Stefan Franzen, Chemistry
________________________________ Dr. Christopher B. Gorman, Chemistry
Dedication
Biography
Acknowledgements
The following people are acknowledged for their contribution to this work:
Dr. Christopher B. Gorman, advisor
Dr. Gregory Parsons, collaborator and member of the advisory committee
Dr. Edmond Bowden, Dr. Daniel Feldheim, Dr. Stefan Franzen, members of the advisory committee
Dr. Kusum L. Chandra, organic synthesis
Dr. Changwoong Chu, Jeong-Seok Na, lithography and electronic characterization
Wallace Ambrose, TEM assistance
Dr. David Cliffel and Brian Hixson, CFFE
Table of Contents
List of Tables ... xiv
List of Figures ... xviii
1.
Introduction 1
1.1.
Molecular Electronics ... 1
1.1.1.
Molecular Structure ... 2
1.1.2.
Molecular Contacts ... 7
1.2.
Project Impetus ... 23
1.2.1.
General Concepts ... 23
1.2.2.
Orthogonal Self-Assembly ... 26
1.2.3.
Objectives ... 33
1.3.
References ... 37
2. Synthesis, Stability and Properties of Metal
Nanoparticles ... 43
2.1.
Introduction and Background ... 45
2.1.1.
Colloid Stability ... 45
2.1.1.1. Electrostatic Stabilization ... 45
2.1.1.2. Steric Stabilization ... 51
2.1.2.
Particle Formation ... 53
2.1.2.1. Mechanisms for Particle Formation ... 53
2.1.2.2. Size Control ... 60
2.1.2.3. Shape Control ... 64
2.1.3.
Organization of Particles ... 76
2.1.4.
Properties of Nanoparticles ... 80
2.1.4.1. Optical Properties... 80
2.1.4.1.1 Effects of Nanoparticle Geometry ... 82
2.1.4.1.2 Effects of the Dielectric Constant and Surface Chemistry ... 86
2.1.4.2. Optical Properties of Platinum, Palladium and Nickel ... 87
2.1.4.3. Electrical Properties ... 89
2.1.5.
Literature Summary ... 90
2.2.
Results and Discussion ... 92
2.2.1.
Synthetic Requirements for Heterodimer Formation ... 92
2.2.2.
Gold Particles ... 94
2.2.2.1. Citrate-capped Gold Particles ... 94
2.2.3.
Platinum and Palladium Particles ... 99
2.2.3.1. Evaluation of literature methods for platinum and palladium nanoparticle synthesis ... 99
2.2.3.2. Synthesis of Tiopronin-Capped Platinum Nanoparticles ... 106
2.2.3.3. Attempted Synthesis of Glutathione-Capped Platinum Nanoparticles ... 108
2.2.3.4. Synthesis of 4-Mercaptobenzoic Acid capped Platinum Particles ... 109
2.2.3.5. Reverse Micelle Synthesis of Platinum Particles ... 115
2.2.4.
Nickel Particles ... 118
2.2.4.1. Evaluation of literature methods for nickel nanoparticle synthesis .... 118
2.2.4.2. Synthesis of Nickel Nanoparticles with CTAB and PTAB ... 122
2.2.5.
Summary and Conclusions ... 126
2.2.6.
Experimental ... 128
2.2.6.1. Synthesis of Tiopronin-capped Platinum Particles ... 128
2.2.6.2. Synthesis of Glutathione-capped Platinum Particles ... 129
2.2.6.4. Reverse Micelle Synthesis of Platinum Particles ... 130
2.2.6.5. Synthesis of Nickel Particles ... 131
2.2.6.6. Particle Characterization ... 132
2.3.
References ... 133
3.
Synthesis and Stability of Metal Oxide Nanoparticles ... 150
3.1.
Introduction and Background ... 152
3.1.1.
Synthesis of Metal Oxide Particles through Sol-Gel Methods . 152
3.1.1.1. Sol-gel concepts ... 1523.1.1.1.1. The Sol-gel Process ... 153
3.1.1.1.2. Steric and Inductive Effects ... 157
3.1.1.1.3. Additional Kinetic Effects ... 164
3.1.1.1.4. Titanium and Other Transition Metal Oxides ... 166
3.1.1.1.5. Summary ... 173
3.1.1.2. Overview of Literature Methods for TiO2 Particle Synthesis ... 173
3.1.1.2.1. Stability of Metal Oxide Particles ... 174
3.1.1.2.2. Synthesis of TiO2 Particles – General Considerations ... 176
3.1.1.2.3. Effects of the Molecular Precursor ... 179
3.1.1.2.4. The Synthesis of TiO2 Particles from Titanium Chloride ... 179
3.1.1.2.5. The Synthesis of TiO2 Particles from Titanium Alkoxides ... 183
3.1.1.2.6. Titanium Sol-gel Reactions within Reverse Micelles ... 188
3.1.1.2.7. Non-Hydrolytic Methods ... 194
3.1.1.2.8. Hydrothermal and Solvothermal Methods ... 202
3.1.1.2.9. Optical Properties of TiO2 Nanoparticles ... 210
3.1.1.2.10. Summary ... 210
3.1.1.3. Overview of Literature Methods for the Synthesis of Iron Oxide Particles ... 213
3.1.1.3.2. Coprecipitation of Fe2+ and Fe3+ Ions ... 219
3.1.1.3.2.1. General Considerations ... 219
3.1.1.3.2.2. Particles Coated with Polymers and Surfactant Molecules .. 222
3.1.1.3.2.3. Iron Oxide Particles Synthesized With Micelles and Liposomes ... 225
3.1.1.3.3. Thermal Decomposition of Iron Complexes ... 228
3.1.1.3.4. Summary ... 233
3.2.
Results and Discussion ... 235
3.2.1.
Synthesis of TiO
2Nanoparticles ... 235
3.2.1.1. Synthesis of Stearic-Acid Capped TiO2 Particles ... 235
3.2.1.2. Ligand-Exchange Involving Stearic Acid-Capped TiO2 Particles ... 237
3.2.1.3. Synthesis of TiO2 Particles from TiCl4 ... 241
3.2.1.4. Synthesis of TiO2 Particles from Titanium (IV) Isopropoxide ... 243
3.2.1.5. Synthesis of TiO2 Particles from Titanium (IV) Ethoxide ... 250
3.2.1.6. Synthesis of TiO2 Particles Using Solvothermal Methods ... 252
3.2.1.7. Summary and Conclusions ... 258
3.2.2.
Synthesis of Iron Oxide Nanoparticles ... 260
3.2.2.1. Synthesis of Iron Oxide Particles by Coprecipitation ... 260
3.2.2.2. Solvothermal Synthesis of Iron Oxide ... 262
3.2.2.3. Summary ... 266
3.3.
Experimental ... 267
3.3.1. Particle Synthesis ... 267
3.3.1.1. Synthesis of Hexanethiol-capped Platinum Particles ... 268
3.3.1.2. Synthesis of Stearic Acid-capped TiO2 Particles ... 269
3.3.1.3. Synthesis of TiO2 Particles from TiCl4 ... 269
3.3.1.4. Synthesis of TiO2 Particles from TIP in the presence of HCl and EtOH ... 270
3.3.1.6. Synthesis of TiO2 Particles Using a Solvothermal Method ... 271
3.3.1.7. Synthesis of Fe3O4 Particles by Coprecipitation ... 272
3.3.1.8. Solvothermal Synthesis of Fe3O4 ... 272
3.3.2. Particle Characterization ... 274
3.3.2.1. Transmission Electron Microscopy (TEM) ... 274
3.3.2.2. Transmission Infrared Spectroscopy ... 274
3.3.2.3. UV-VIS Spectroscopy ... 274
3.4.
References ... 275
4.
Synthesis of Nanoparticle Assemblies ... 286
4.1.
Overview of Literature Methods for Forming Particle
Assemblies ... 286
4.1.1.
Formation of Nanoparticle Assemblies on Surfaces ... 286
4.1.2.
Synthesis of Solution-Based Nanoparticle Networks ... 293
4.1.3.
Synthesis of Isolated Nanoparticle Aggregates ... 296
4.1.4.
Solution-Based Synthesis of Molecularly-Linked
Nanoparticle Dimers and Trimers ... 301
4.1.5.
Synthesis of Nanoparticle Assemblies Using Solid Phase
Place-Exchange ... 309
4.1.6.
Optical Properties of Nanoparticle Assemblies ... 315
4.1.7.
Summary ... 323
4.2.
Results and Discussion ... 327
4.2.1.
Synthesis of Gold Homodimers and Homotrimers ... 328
4.2.2.
Synthesis of Nanoparticle Gold-Platinum Heterodimers ... 337
4.2.3.
Synthesis of Nanoparticle Gold-Nickel Heterodimers ... 346
4.2.4.
Synthesis of Nanoparticle Gold-Metal Oxide Heterodimers .... 348
4.3.
Experimental ... 360
4.3.1.
Sample Preparation ... 360
4.3.2.
Particle Characterization ... 362
4.4.
References ... 362
5.
Size-Exclusion Chromatography of Particles and Particle
Assemblies ... 368
5.1.
Introduction and Background ... 369
5.1.1.
Size-Exclusion Chromatography – General Theory ... 369
5.1.2.
Liquid Chromatography of Nanoparticles in Organic Solution .. 374
5.1.3.
Aqueous Chromatography of Nanoparticles ... 378
5.1.4.
Recycling Size-Exclusion Chromatography ... 388
5.1.5.
SEC of Nanoparticle Assemblies ... 390
5.1.6.
Summary ... 392
5.2.
Results and Discussion ... 393
5.2.1.
Organic SEC ... 393
5.2.2.
Aqueous SEC ... 394
5.2.2.1. Normal Phase Chromatography ... 394
5.2.2.2. Reverse-Phase Chromatography ... 410
5.2.3.
Summary ... 426
5.3.
Experimental ... 429
5.4.
References ... 431
6.
Electrophoresis of Particles and Particle Assemblies ... 434
6.1.1.
Electrophoresis – General Theory ... 434
6.1.2.
Capillary Electrophoresis ... 392
6.1.3.
Micellar Electrokinetic Chromatography ... 436
6.1.4.
Particle Electrophoresis ... 441
6.1.5.
Gel Electrophoresis of Particles ... 460
6.2.
Results and Discussion ... 462
6.2.1.
Gel Electrophoresis of Particle and Assemblies ... 462
6.2.2.
Capillary Electrophoresis of Particles and Assemblies
– General Considerations ... 466
6.2.3.
Capillary Electrophoresis of Gold-Citrate Particles ... 470
6.2.4.
Capillary Electrophoresis of Nanoparticle Assemblies ... 478
6.2.5.
Capillary Electrophoresis of Platinum Particles ... 485
6.2.6.
Continuous Free-Flow Electrophoresis of Particles and
Assemblies – General Considerations ... 487
6.2.7.
Continuous Free-Flow Electrophoresis of Particles and
Assemblies – Results and Discussion ... 489
6.2.8.
Conclusions ... 444
6.3.
Experimental ... 498
6.3.1.
Sample Preparation. ... 498
6.3.2.
Gel Electrophoresis ... 500
6.3.3.
Capillary Electrophoresis ... 500
6.3.4.
Continuous Free-Flow Electrophoresis ... 502
6.4.
References ... 503
7. Small Angle X-Ray Scattering ... 508
7.2. Results and Discussion ... 513
7.3. Experimental ... 515
7.4. References ... 516
8. Ligand-Exchange Kinetics
...
518
8.1. Infrared Spectroscopy ... 519
8.2. Fluorescence Quenching ... 522
8.3. Summary and Conclusions ... 528
8.4. Experimental ... 528
8.4.1. Synthesis of 1-Isocyano-4-phenylethynyl-benzene ... 529
8.4.2. Synthesis of Hexanethiol-capped Platinum Particles ... 531
8.4.3. Synthesis of Polyacrylate-capped Platinum Particles ... 532
8.4.4. Analytical Techniques ... 532
8.4.4.1. Transmission Infrared Spectroscopy ... 532
8.4.4.2. Attenuated Total Reflectance Spectroscopy ... 533
8.4.4.3. Optical Absorbance Spectroscopy ... 533
8.4.4.4. Fluorescence Spectroscopy ... 533
8.5. References ... 533
Appendices ... 541
Appendix 1. Collaborative Publications Involving the
Integration of Nanoparticles and Nanoparticle
Assemblies into Lithographic Architectures 542
A-1.1.
References ... 553
Appendix 2. Geometric Calculations Involving Nanoparticle
Dimers and Trimers ... 554
A-2.1 Hydrodynamic Radii of Nanoparticle Dimers ... 554
A-2.2 Hydrodynamic Radii of Nanoparticle Trimers ... 565
A-2.3 Geometry of Nanoparticle Trimers ... 571
List of Tables
1. Introduction
2. Synthesis, Stability and Properties of Metal Nanoparticles
Table 2-1. Concentrations of citrate-capped gold particles as received by Ted
Pella, Inc. The values below were reported by the suppler. ... 96 Table 2-2. Observations recorded for platinum particles with 4-mercaptobenzoic
acid ... 111 Table 2-3. Nickel-CTAB particle Synthesis 1: Variables = NiCl2 and N2H4 conc.
and stirring ... 123 Table 2-4. Nickel-CTAB particle Synthesis 2: Variable = CTAB concentration ... 125
3. Synthesis and Stability of Metal Oxide Nanoparticles
Table 3-1. Effects of Relative Hydrolysis and Condensation Rates on Material
Structure ... 159 Table 3-2. Gelation Times (hours) for Silicon Alkoxides in Different Solvents ... 164 Table 3-3. Partial positive charges associated with the metal atoms in several
ethoxides ... 167 Table 3-4. Hydrolysis Rate Constants for Silicon and Titanium Alkoxides ... 169 Table 3-5. Effects of Reaction Parameters on the Size and Dispersity of TiO2
Particles ... 187 Table 3-6. Reaction Conditions for the Hydrolysis of TIP in the Presence of
Hydrochloric Acid and Ethanol ... 248 Table 3-7. Observations for the Hydrolysis of TIP in the Presence of Hydrochloric
4. Synthesis of Nanoparticle Assemblies
Table 4-1. Statistics obtained for heterodimer assemblies consisting of citrate-capped gold particles (20 nm) and mercaptobenzoic acid-capped platinum
particles ... 340 Table 4-2. Statistics Obtained for Heterodimer Assemblies Consisting of
Citrate-capped Gold Particles (15 nm) and Tartaric-acid-Capped Fe3O4 Particles
... 356 Table 4-3. Concentrations of gold particles ... 361
5. Size-Exclusion Chromatography of Particles and Particle
Assemblies
Table 5-1. Retention Volumes Observed for Platinum Particles with Different Capping Ligands ... 396 Table 5-2. Retention Volumes Observed for Platinum Particles with Different Capping Ligands ... 416 Table 5-3. Data Obtained from SEC Chromatograms of Nanoparticle
Assemblies ... 423
6. Electrophoresis of Particles and Particle Assemblies
Table 6-1. Approximate κa values for 5.3 nm and 19 nm gold particles in 10 mM CAPS buffer with varying concentrations of SDS. ... 454 Table 6-2. Ionic strengths, Debye lengths and κa values for buffers used in CE
experiments ... 471 Table 6-3. Data obtained from plots of migration time vs. particle diameter for buffers
at different pH values ... 475 Table 6-4. Retention times of platinum particles obtained using capillary
electrophoresis ... 486 Table 6-5. Statistics for particle solutions containing dimers determined by TEM
Table 6-6. Statistics for fractions collected after CFFE of gold dimers ... 495 Table 6-7. Concentrations of gold particles used in separations ... 498 Table 6-8. Concentrations of gold particles in solutions containing dimers and trimers
... 499 Table 6-9. Buffer conditions for CFFE separations ... 502
7. Small Angle X-Ray Scattering
8. Ligand-Exchange Kinetics
Table 8-1. Stern-Volmer Quenching Constants ... 525 Table 8-2. Concentrations of gold particles ... 529
9. Conclusions and Project Outlook
Appendix 1. Collaborative Publications Involving the
Integration of Nanoparticles and Nanoparticle
Assemblies into Lithographic Architectures
Appendix 2. Geometric Calculations Involving Nanoparticle
Dimers and Trimers
Table A-2-1. Hydrodynamic radii calculated for homodimers of various sizes
using both the rod-approximation and the dumbbell model. ... 558 Table A-2-2. Hydrodynamic radii calculated for heterodimers of various sizes
using the dumbbell model ... 559 Table A-2-3. Hydrodynamic radii calculated for homotrimers composed of
nanoparticles of various sizes using both the rod-approximation and
the cylindrical model based on the axial ratio. ... 565 Table A-2-4. Maximum particle sizes feasible for nanoparticle trimers with
Table A-2-5. Values calculated for the gap between particles both with and
List of Figures
1. Introduction
Figure 1-1. (A) Semilogarithmic plots of current vs. voltage for Au/SAM/Pd nanowires junctions formed from dodecanethiol, an oligomeric phenyleneethylene (OPE) and an oligomeric phenylenevinylene (OPV). (B) General structure of an OPE (C) General structure of
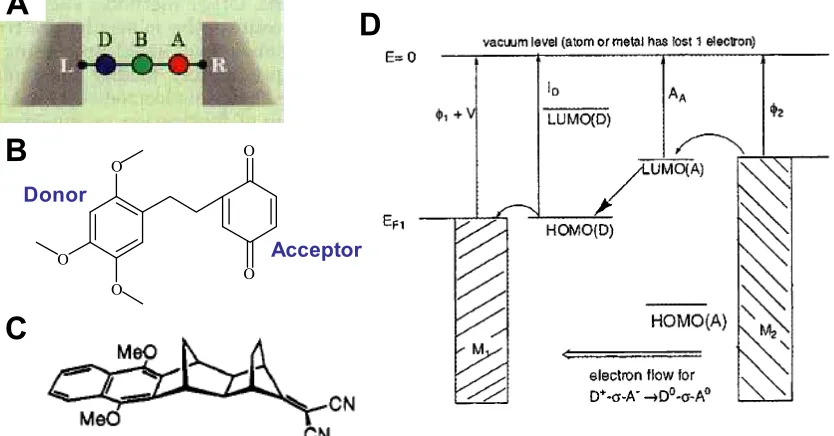
an OPV ... 2 Figure 1-2. (A) Schematic of an acceptor-bridge-donor molecular junction. (B)
Example of an acceptor-bridge-donor molecule. (C) Another example of an acceptor-bridge-donor molecule. (D) Electronic
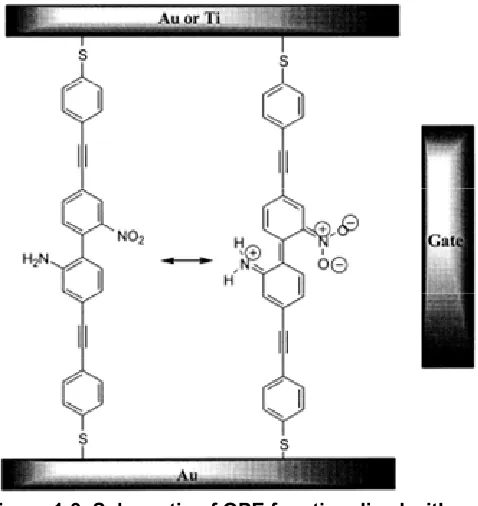
energy levels associated with an acceptor-bridge-donor junction. ... 4 Figure 1-3. Schematic of OPE functionalized with a nitro group and an amine ... 5 Figure 1-4. Schematics of molecular junctions formed through vapor deposition
(A) Titanium and gold evaporated onto a monolayer of
4-thioacetylbiphenyl. (B) Reaction of magnesium with a methoxy-terminated self-assembled monolayer. (C) Schematic of a pattern formed through the selective deposition of magnesium onto
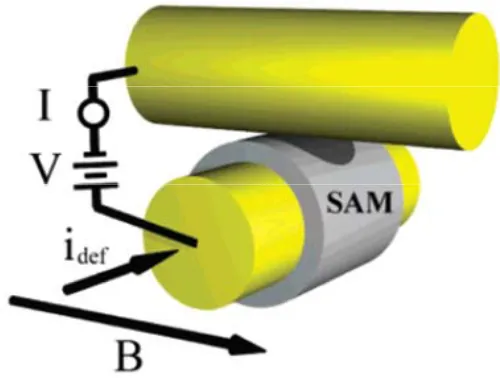
carboxylic acids. ... 8 Figure 1-5. Schematic showing a crossed-wire tunnel junction consisting of
two, 10 μm gold wires, one of which is modified with a molecular
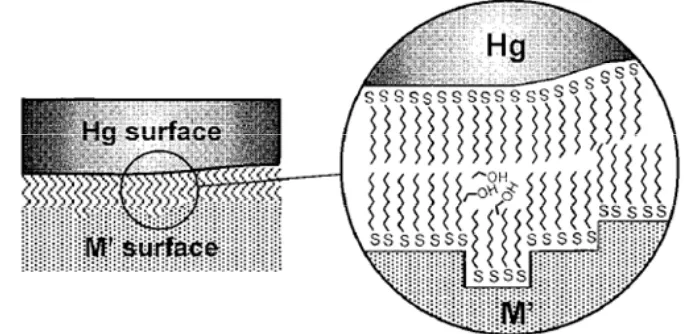
monolayer ... 11 Figure 1-6. Schematic of a Hg-SAM/SAM-M’ junction created using a mercury
drop. The magnified view shows the presence of some solvent
molecules (ethanol) at the interface. ... 12 Figure 1-7. (A) A metal-molecule-metal junction formed by contacting a
self-assembled monolayer with a gold-coated AFM tip (B) Schematic of a single-molecule molecular junction consisting of an OPE inserted
into an alkanethiol mololayer and then contacted with an STM tip ... 13 Figure 1-8. Schematic of a dithiol OPE, which was inserted into an alkanethiol
film and then bound to a nanoparticle. ... 15 Figure 1-9. (A) Schematic of 1,8’-octanedithiol covalently bound to a gold
thiol-terminated OPE bridged between a gold surface and a gold STM
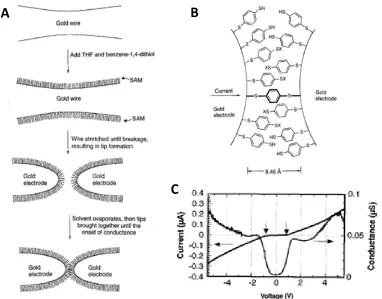
tip ... 16 Figure 1-10. (A) Method used to form a mechanical break junction by coating
xylyl dithiol onto a gold wire, stretching it until fracture and then bringing it back together until conductance was achieved. (B) Junction formed using the process shown in (A) (C) Differential
conductance curve measured for this junction ... 17 Figure 1-11. (A) Linear oligomeric phenylene ethylene (OPE) used to synthesize
nanoparticle dimers (B) Trigonal planar OPE used to synthesize nanoparticle trimers (C) Tetrahedral OPE used to synthesize nanoparticle tetramers (D) Tetragonal planar OPE used to synthesize nanoparticle tetramers (E) Dimer composed to 30 nm silver particles (F) Trimer composed of 10 nm gold particles (G) Planar tetramer composed of 10 nm gold particles (H) Tetrahedral
trimer composed of 10 nm gold particles ... 19 Figure 1-12. (A) Schematic showing an OPE-linked gold nanoparticle dimer
trapped within a lithographic trench (B) Current-voltage measurements through a trapped dimer indicating long-term
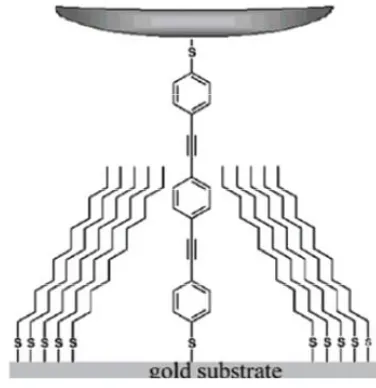
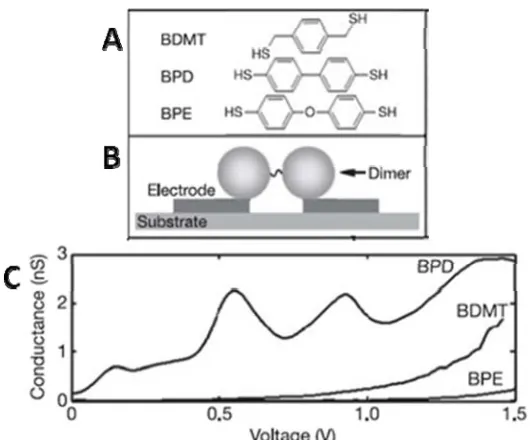
stability under vacuum ... 21 Figure 1-13. (A) The structures of three molecules used to form nanoparticle
dimers: 1,4-benzenedimethanethiol (BDMT), 4,4’-biphenyldithiol (BPD) and bis-(4-mercaptophenyl)-ether (BPE) (B) Schematic of a nanoparticle dimer (C) The differential conductance curves for
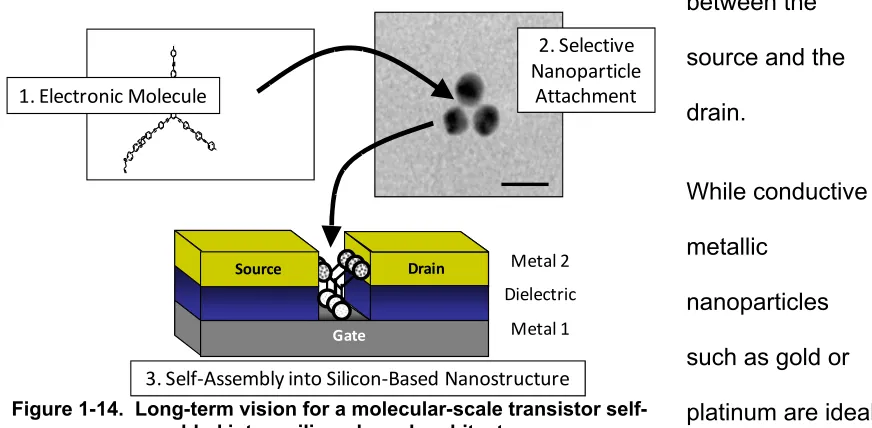
nanoparticle dimers with three different molecular linkers ... 22 Figure 1-14. Long-term vision for a molecular-scale transistor self-assembled
into a silicon-based architecture. ... 23 Figure 1-15. Possible method for functionalizing the TiO2 gate electrode with
redox-active molecules. ... 24 Figure 1-16. Schematic of a lithographic trench after reactive ion etching of the
SiO2 layer and assembly of a nanoparticle trimer. Here the S, D,
and G indicate the source, drain and gate for the proposed
transistor. ... 25 Figure 1-17. Orthogonal self-assembly of isocyanide on platinum and disulfide
Figure 1-18. Kinetic effects on bridging a bifunctional molecule between two electrodes using orthogonal self-assembly (A) One functional group binds at a faster rate, facilitating the formation of a molecular bridge (B) Both functional groups bind at similar rates, and electrochemical
stripping is required for the formation of a molecular bridge ... 29 Figure 1-19. Molecules used to evaluate orthogonal self-assembly (A)
Monofunctional OPE used as a control (B) Bifunctional linker
molecule ... 30 Figure 1-20. The binding of the bifunctional OPE observed using grazing angle
infrared spectroscopy on planar substrates (left) and transmission IR (right). (A) Spectrum of bifunctional OPE shown in Figure 1-19 (B) Spectrum of isocyanide-terminated control molecule shown in Figure 1-19 (A) after incubation with a platinum substrate (C) Spectrum of the bifunctional OPE after incubation with a gold substrate (D) Spectrum of the bifunctional OPE after incubation with a platinum substrate (E) Spectrum of the bifunctional OPE (F) Spectrum of the bifunctional OPE after incubation with hexanethiol-capped gold particles (G) Spectrum of OPE after incubation with
hexanethiol-capped platinum particles ... 32 Figure 1-21. Schematics of the proposed molecularly-linked nanoparticle
heterodimers (A) Gold-metal heterodimer linked by an OPE terminated with a thiol and an isocyanide. The metal could be either platinum, palladium or nickel. (B) Gold-metal oxide heterodimer linked by an OPE terminated with a thiol and a carboxylic acid. Possible metal oxides include titania and iron
oxide. ... 33
2. Synthesis, Stability and Properties of Metal Nanoparticles
Figure 2-1 Schematic showing mechanisms for particle stability (A)
Electrostatic stabilization (B) Steric stabilization ... 45 Figure 2-2. The relative magnitudes of various double-layer potentials of
interest ... 48 Figure 2-3. Potential energy curves for the interaction of two colloidal particles
in total interaction energy observed for different values of ionic
strength ... 49 Figure 2-4. Nanoparticles of different shapes achieved through kinetic control
of reaction conditions (A) Gold nanocubes (B) Rod-shaped gold particles (C) Gold multipods (D) Silver nanowires. (E) Triangular
silver nanoparticles. ... 65 Figure 2-5. Branched structures created through nucleation on seed crystals.
(A) Two-dimensional representation of crystal structure of a tetrapod (B) Schematic of the formation of heterostructured rods through the controlled addition of CdSe extentions to CdS nanorods (C) CdTe tetrapods. (D) Branched tetrapods formed from the
nucleation of CdTe on the branches of CdS tetrapods ... 67 Figure 2-6. Different shapes of copper nanocrystals formed in reverse micelles ... 68 Figure 2-7. Sacrificial polystyrene template used to form triangular gold
nanoparticles (A) deposition of polystyrene spheres on a substrate (B) thermal evaporation of gold onto substrate (C) removal of
polystyrene spheres to leave triangular gold nanoparticles ... 69 Figure 2-8. Schematic of encapsulating hydrophobic nanoparticle with
amphiphilic polymer and then subsequent cross-linking of the
polymer chains ... 74 Figure 2-9 (A) Superlattice of thiolated gold particles. (B) Ordered chains of
BaCrO4 nanorods. (C) Bimodal superlattice of gold and silver
nanoparticles. ... 76 Figure 2-10. Noncovalent linking of nanoparticles (A) Network of gold particles
capped with 1,10 phenanthroline and lithium ions. (B) Network of cyclodextrin-capped gold nanoparticles induced by fullerene
molecules ... 78 Figure 2-11. Schematic of Plasmon oscillation for a sphere, showing the
displacement of the conduction electron charge cloud relative to the
nuclei ... 80 Figure 2-12. (A) Optical spectra calculated for gold ellipsoids of varying aspect
ratios (R) using the dipole approximation and a dielectric constant of 2.05. (B) Optical spectra of gold nanorods obtained for gold
Figure 2-13. (A) Gold colloid nanoshells with decreasing shell thickness ... 84 Figure 2-14. Absorption spectra calculated for a gold ellipsoid (aspect ratio =
3.3) with as the dielectric constant of the surrounding medium
changes from 1.3 to 2.3 ... 86 Figure 2-15. Absorption spectra for 10nm spherical particles of platinum,
palladium and nickel calculated using Mie theory ... 88 Figure 2-16. Schematic of nanoparticle heterodimer (not to scale). Two
nanoparticles bound with an organic linker molecule terminated with different functional groups. Nanoparticles can be either
electrostatically or sterically stabilized. ... 92 Figure 2-17. OPE used to synthesize heterodimers ... 93 Figure 2-18. (A) Citrate ion (B) Tannic Acid ... 95 Figure 2-19 (A). UV-VIS absorption spectra of gold nanoparticles as received
from Ted Pella, Inc. (B) Relationship between particle diameter and the wavelength of the absorbance maximum for gold particles, both theoretical calculations and experimental data. (C) Particle concentrations and extinction coefficients at 520 nm were plotted as a function of particle diameter for gold nanoparticles as received
from Ted Pella, Inc. ... 97 Figure 2-20. Capping ligands used in the synthesis of platinum particles (A)
glutathione (B) tiopronin (C) 4-mercaptobenzoic acid ... 104 Figure 2-21 Pt-tiopronin particles (A) TEM image (B) absorption spectrum ... 107 Figure 2-22. Pt particles with 4-mercaptobenzoic acid (A) TEM image and (B)
absorption spectrum ... 110 Figure 2-23. Platinum particles with 4-mercaptobenzoic acid (A) thiol/gold ratio
of 0.5:1; particle size 2.1 ± 0.5 nm (B) thiol/gold ratio of 1:1; particle
size 3.0 ± 0.5 nm ... 114 Figure 2-24. Sodium 2-mercaptoethanesulfonate ... 115 Figure 2-25. Platinum particles synthesized using reverse micelles and capped
surfactant in pentane (C) Absorption spectrum of particles
synthesized with 10% surfactant solution ... 117 Figure 2-26. Schematic of surfactant bilayer surrounding a nanoparticle. ... 120 Figure 2-27 (A) Cetyltrimethylammonium bromide (CTAB)
(B) Phenyltrimethylammonium bromide (PTAB) ... 122 Figure 2-28. Aqueous solution containing Nickel-CTAB particles ... 124 Figure 2-29. (A) TEM of nickel particles (A) synthesized with 0.05 M CTAB (B)
synthesized with 0.05 M PTAB ... 126
3. Synthesis and Stability of Metal Oxide Nanoparticles
Figure 3-1. OPE used to synthesize heterodimers ... 150 Figure 3-2. Shrinkage of gel with condensation ... 157 Figure 3-3. TEOS precursor substitution reactions and the resulting hydrolysis
rates ... 158 Figure 3-4. Gel structures for acid and base catalyzed reactions ... 161 Figure 3-5. Computer simulations of structures formed by monomer-cluster and
cluster-cluster aggregation under reaction and diffusion-limited
conditions ... 165 Figure 3-6. Schematic structures of (A) [Ti(OR)4]4 (R = Me, Et) (B) Ti2(OR)8
(C) Ti2(OR)8(LH)2 (LH = ROH or RNH2) ... 168
Figure 3-7. Schematic of nucleation and growth process assumed for alkoxide
hydrolysis ... 177 Figure 3-8. Images of TiO2 particles synthesized via the hydrolysis of TiCl4 in
aqueous solution (A) SEM image of a film of TiO2 particles (B)
TEM image of TiO2 particles (C) TEM image of micron-sized TiO2
particles formed in the presence of Na2SO4... 181
Figure 3-9. TiO2 Nanostructures formed from the hydrolysis of TiCl4 in the
presence of HCl (A) Mixture of rutile (elongated) and brookite (spherical) structures (B) Brookite particles after separation
Figure 3-10. TEM images of TiO2 particles synthesized from the hydrolysis of
titanium isopropoxide under acidic conditions. The reaction
conditions associated with images A-D are listed in Table 3-5. ... 186 Figure 3-11. Surfactants and polymers used to create reverse micelles for TiO2
synthesis (A) Polyoxyethylene nonylphenyl ether; tradename Igepal® CO-520 for n~5 (B) Triton® X-100, n = 9-10 (C) Ammonium carboxylate perfluoroether (D) bis(2-ethylhexyl) sulfosuccinate sodium salt (AOT) (E) Copolymer consisting of a dimethyl amino ethyl metharcylate block and a perfluoroctyl
methacrylate block. ... 190 Figure 3-12. TEM images of titanium oxide nanostructures formed in reverse
micelles in the presence of (A) hydrochloric acid (B) nitric acid (C) sulfuric acid (D) phosphoric acid. The acid concentrations in all cases were equivalent to 2.5 M HCl. The insert in (A) in an electron
diffraction pattern indicating the rutile crystal phase ... 193 Figure 3-13. TiO2 particles synthesized using non-hydrolytic methods (A)
Particles synthesized from the reaction of TiCl4 with benzyl alcohol,
approximately 15 nm in diameter (B) Particles synthesized from
the reaction of TiCl4 with TIP in the presence of TOPO ... 199
Figure 3-14. Image and cross-sectional schematic of a stainless steel autoclave, specifically a General Purpose Acid Digestion Bomb manufactured
by the Parr Instrument Company ... 202 Figure 3-15. TiO2 nanoparticles synthesized using solvothermal methods (A)
Anatase particles synthesized from the reaction of TiCl4 in ethanol
at 150 ˚C. (B) Rutile particles synthesized from the reaction of TiCl4
in glycerol and acetic acid at 150 ˚C (C) Anatase particles
synthesized from the reaction of titanium isopropoxide with acetone
at 130 ˚C ... 205 Figure 3-16. TEM images of TiO2 synthesized using a solvothermal method (A)
Nanoparticles synthesized through the hydrolysis of Ti(OBu)4 in the
presence NH4HCO3and linoleic acid (B) Nanorods synthesized from
the non-hydrolytic reactions between Ti(OBu)4 and linoleic acid. ... 207
Figure 3-17. Titania nanocrystals synthesized through the hydrolysis and condensation of titanium isopropoxide (TIP) in the presence of trimethylammonium hydroxide (Me4NOH). (A) Triangular prismatic
Rectangular particles formed after autoclaving the particles shown
in (A) at 200 ˚C. ... 209 Figure 3-18. Absorption spectrum of anatase TiO2 particles ... 210
Figure 3-19. Iron oxide particles synthesized using sonochemical reactions (A) Fe3O4 particles (9 nm) synthesized from iron pentacarbonyl in the
presence of sodium dodecyl sulfate (B) FeO particles (3 – 8 nm) synthesized from iron pentacarbonyl in the presence of
poly(vinylpyrilidone). (C) Fe3O4 particles (10 nm) synthesized
sonochemically from iron (II) acetate in water ... 216 Figure 3-20. (A) Oleic acid (B) Stearic acid ... 217 Figure 3-21. Iron oxide particles synthesized via the coprecipitation of Fe2+ and
Fe3+ ions in the presence of NH4OH (A) and N(CH3)4)OH (B) ... 221
Figure 3-22. (A) Schematic of interdigitated bilayer formed from undecanoic acid and the ester formed from undecanoic acid and
poly(ethyleneglycol) (B) Fe3O4 particles stabilized with this
inter-digitated bilayer after gamma irradiation. ... 222 Figure 3-23. Iron oxide particles synthesized via the coprecipitation of Fe2+ and
Fe3+ ions. (A) Fe3O4 particles coated with poly(vinylalcohol). (B)
Fe3O4 particles coated with a bilayer consisting of lauric acid and
decanoic acid. (C) Fe3O4 particles coated with sulfonated
poly(acrylic acid) (D) Fe3O4 particles coated with a graft copolymer,
poly(glycerol monoacrylate)-g-(PEG methyl ether acrylate) (F) Fe3O4 particles synthesized in the presence of
tetramethylammonium hydroxide ... 223 Figure 3-24 Schematic of a liposome ... 225 Figure 3-25. TEM images of Fe3O4 particles (A) Particles synthesized in reverse
micelles of sodium dodecylbenzenesulfonate. (B) α-FeOOH
particles synthesized in phosphatidylcholine vesicles ... 226 Figure 3-26 TEM images of Fe3O4 paticles synthesized by the coprecipitation of
Fe2+ and Fe3+ ions both with (A) and without (B) the presence of
polyoxyethylene nonyl phenyl ether micelles. ... 227 Figure 3-27. TEM images of iron oxide particles (A) γ-Fe2O3 particles
synthesized from the thermal decomposition of Fe(Cup)3 in
decomposition of Fe(acac)3 in the presence of phenyl ether,
1,2-hexadecanediol, oleic acid and oleylamine ... 228 Figure 3-28. γ-Fe2O3 nanoparticles (7 nm) synthesized via the decomposition of
an iron-oleate complex ... 229 Figure 3-29. (A) Schematic of the reaction between iron acetylacetonate and
2-pyrrolidone (B) Fe3O4 particles coated with 2-pyrrolidone, 5 nm in
diameter ... 231 Figure 3-30. Fe3O4 nanoparticles synthesized through the solvothermal reaction
of Fe(acac)3 in benzyl alcohol (A) Particles as synthesized, 12 nm
in diameter (B) Particles dispersed in hexane after coating with undecanoic acid, 8 nm in diameter (C) Particles dispersed in water
after coating with dopamine, 12 nm in diameter ... 232 Figure 3-31. (A) TEM Image of TiO2 particles capped with stearic acid (B)
Absorption spectrum of TiO2 synthesized in the presence of stearic
acid and hexanoic acid ... 236 Figure 3-32. Molecules and bonds associated with the Pt/TiO2 Orthogonal
Self-Assembly Study (A) Control Molecule (B) Linker Molecule (C) Bidentate carboxylic acid – titanium bond (D) Bridging carboxylic
acid – titanium bond. ... 232 Figure 3-33. Transmission IR data of carboxylic acid and isocyanide terminated
molecules in the presence of TiO2 and Pt nanoparticles. (A) Free
stearic acid (B) Stearic acid upon binding to TiO2 (C) Control
molecule terminated with carboxylic acid (D) Control molecule after incubation with TiO2 particles (E) Bifunctional linker molecule
terminated with carboxylic acid and isocyanide functionalities (F) Bifunctional linker after incubation with TiO2 particles (G)
Bifunctional linker after incubation with Pt particles. ... 239 Figure 3-34 TiO2 nanostructures formed from the hydrolysis of TiCl4 in an
aqueous hydrochloric acid solution. (A) Spherical particles 7.2 ± 0.8 nm in diameter (B) A mixture of TiO2 nanorods and spherical
aggregates (C) Lower magnification image indicating the extent of
aggregation ... 242 Figure 3-35. TEM images of TiO2 particles synthesized from the hydrolysis of
Figure 3-36. TiO2 particles synthesized from the hydrolysis of TEO in the
presence of potassium chlroride ... 250 Figure 3-37. TiO2 particles synthesized using a solvothermal method ... 252
Figure 3-38. Ligands used for attempted-ligand exchange (A) glycerol (B)
succinic acid (C) tartaric acid. ... 253 Figure 3-39. TiO2 nanostructures observed after attempted ligand-exchange with
(A) glycerol (B) succinic acid (C) tartaric acid ... 254 Figure 3-40. Proposed mechanism for the formation of anisotropic
nanostructures from smaller nanocrystals through selective
desorption of ligands from the (001) crystal face ... 255 Figure 3-41. TiO2 nanostructures observed after attempted ligand-exchange with
(A) glycerol (B) succinic acid (C) tartaric acid. ... 256 Figure 3-42. Fe3O4 particles synthesized by the coprecipitation of FeCl2 and
FeCl3 in tetramethyl ammonium hydroxide (N(CH3)4OH) (A)
Particles synthesized in the presence of 58 mmol (N(CH3)4OH) (B)
Particles synthesized in the presence of 29 mmol mmol
(N(CH3)4OH) ... 261
Figure 3-43. Iron oxide particles synthesized solvothermally from iron acetylacetonate in benzyl alcohol (A) particles coated with
tridecanoic acid and dispersed in hexane (B) Particles coated with glycerol (C) Particles coated with succinic acid (D) Particles coated with tartaric acid. The insets in (C) and (D) show larger aggregates
also present in these solutions. ... 264
4. Synthesis of Nanoparticle Assemblies
Figure 4-1. Schematics of nanoparticle assemblies on solid substrates. (A) Gold nanoparticles covalently bound to a self-assembled
monolayer; the terminal functional group, A, binds to nanoparticles and adheres them to the surface (B) Gold nanoparticles adsorbed to the substrate through non-covalent interactions; nanoparticles
Figure 4-2. Microcontact printing of palladium colloids (A) Method used to form surface patterns (B, C) SEM images of patterns formed after
electroless copper deposition ... 288 Figure 4-3. Schematics of nanoparticle assemblies formed on substrates (A)
Bilayer created using two different sizes of CdSe quantum dots bound by 1,4-benzenedimethanethiol. (B) Bilayer of gold particles capped with 12-aminododecane bound by 1,8-octanedithiol on a
patterned subsrate ... 290 Figure 4-4. (A) Reaction scheme showing asymmetric functionalization of CdTe
tetrapods. Step 1: spin-coat polymer to partially cover tetrapods. Step 2: addition of hexanedithiol. Step 3: attach gold nanoparticles (red dots). Step 4: dissolve polymer layer (B) TEM image of formation from CdTe tetrapod functionalized with 5 nm gold nanoparticles (C) Schematic showing nanrod formation by breaking tetrapods using a TEM grid (D) TEM image of CdTe nanorods asymmetrically functionalized with 5 nm gold
nanoparticles ... 292 Figure 4-5. Schematic representation of DNA-directed assembly of gold
nanoparticles ... 294 Figure 4-6. The formation of a cadmium sulfide particle network through the
reaction of α,α’-dibromo-p-xylene with pyridine functionalities on
adjacent paticles. ... 295 Figure 4-7. Dimers formed through controlled aggregation (A) SEM image of
silica particles (330 nm) and dimers. Dimers are marked with a black line. (B) TEM image of gold particles (15 nm) and dimers
coated with a polymer shell. ... 297 Figure 4-8. (A) Method for coating the top of silica beads with a gold film. (B)
SEM images of SiO2 beads (600 nm) after coating with Ti/W alloy
(5 nm) and gold (25 nm) and annealing at 700 ˚C (C) TEM image
of Au/SiO2 dimers after removal from substrate ... 299
Figure 4-9. (A) Formation of heterodimeric structures through the thermal decomposition of iron pentacarbonyl in the presence of gold particles. (B) TEM image of heterodimer formed in non-polar solvent. (C) TEM image of ‘flower-like’ structures formed in polar
Figure 4-10. (A) Schematic showing the formation of Fe3O4-Ag heterodimers at
a micellar interface and the subsequent selective functionalization (B) TEM image showing Fe3O4-Ag heterodimer (C) TEM image
showing FePt-Ag heterodimer ... 301 Figure 4-11 (A) Schematic for the formation of a gold nanoparticle dimer from
gold nanoparticles functionalized with complementary DNA strands (B) Schematic for the formation of a dimer from DNA-functionalized gold nanoparticles bound by a longer, complimentary strand (C) TEM image of a dimer formed using the method shown in (B). (D) Schematic of a trimer formation from complimentary thiolated-DNA strands bound to nanoparticles (E) TEM images of trimer formed
using the method shown in (D) ... 302 Figure 4-12. Nanoparticle assembly consisting of a gold core (31 nm)
surrounded by smaller gold satellites (8 nm) ... 303 Figure 4-13. (A) Linear oligomeric phenylene ethylene (OPE) used to synthesize
nanoparticle dimers (B) Trigonal planar OPE used to synthesize nanoparticle dimers (C) Tetrahedral OPE used to synthesize nanoparticle tetramers (D) Tetragonal planar OPE used to synthesize nanoparticle tetramers (E) Dimer composed to 30 nm silver particles (F) Trimer composed of 10 nm gold particles (G) Planar tetramer composed of 10 nm gold particles (H) Tetrahedral
trimer composed of 10 nm gold particles. ... 305 Figure 4-14. Diruthenium-bis(OPE) compounds used to synthesize nanoparticle
dimers and linear chains ... 306 Figure 4-15. (A) Structure of bis(acyl hydrazide) (B) TEM image of CdSe
homodimers linked by bis(acyl hydrazine) after repeated
size-selective precipitation to isolate dimers ... 307 Figure 4-16. Gold nanoparticle dimers synthesized using a solid phase approach
(A) Reaction scheme showing dimer formation (B) TEM images of gold nanoparticle dimers synthesized from particles 2.8 nm in
diameter ... 310 Figure 4-17. Synthesis of dimers from mono-functionalized gold nanoparticles.
The particles were functionalized using both polystyrene Wang and
poly(ethylene glycol)acrylamide (PEGA) copolymer-based resins ... 311 Figure 4-18. Gold nanoparticle dimers synthesized using asymmetrical
11-mercapto-1-undecanol (MUOH) (C) 16-mercaptohexadecanoic acid (MHA) (D) Mercaptoethylamine (MEA) (E) Amide linkage formed from the reaction of MHA with MEA (F) TEM image of gold nanoparticle dimers synthesized from particles 41 nm in diameter (G) TEM image of a dimer consisting of a 41 nm and a 30 nm
particle ... 313 Figure 4-19. Optical absorption of gold nanoparticle assemblies (A) Calculated
extinction spectra of spherical aggregates each containing 2,600 Au nanospheres for increasing gold volume fraction. (B) Calculated extinction spectra for spherical aggregates of gold nanospheres in
water for increasing aggregate size at a fixed Au volume fraction. ... 316 Figure 4-20. Core-satellite structures with reconfigurable tether in both the
hairpin (A) and extended (B) states ... 317 Figure 4-21 A) Schematics of gold particles with carboxylic acid functionalities,
PAMAM dedndrimers, the self-assembly of gold particles with dendrimers and the decreased coupling that occurs with increasing dendrimer generation (B) Optical absorption spectra for gold
nanoparticles self-assembled in the presence of dendrimers ... 318 Figure 4-22. (A) Optical absorption spectra of 8 nm gold nanoparticles both
before (lower spectrum) and after (upper spectrum) the addition of the OPE linker in (B). The inset shows the time evolution of the
absorbance at 535 nm ... 319 Figure 4-23. Optical spectra for silver nanoparticle dimers (A) Spectra calculated
for 60 nm silver particles as a function of inter-particle distance. (B) Optical absorption spectra for 30 nm silver nanoparticles linked by
OPE molecules ... 320 Figure 4-24. (A) Method for assembling nanoparticle multi-layers on a surface
(B) Photograph of Au, Au/Ag and Ag nanoparticle multilayer
samples ... 321 Figure 4-25. Oligomeric phenylene ethylene (OPE) molecules used to
synthesize homodimers of gold nanoparticles (A) 3-ring linker (B)
5-ring linker (C) 7-ring linker ... 328 Figure 4-26. TEM images of gold nanoparticle homodimers (A) Solution
containing 15 nm citrate-capped gold homodimers (B) Homodimer of 20 nm citrate-capped gold particles. Dimers were linked with
Figure 4-27. (A) Graph shows the percentages of particles that appeared to be in dimers on a TEM grid for citrate-capped gold particles of various sizes both without and with the addition of an OPE linker. (B) The percentage of particles that appeared to be in dimers in the
presence of three different linker molecules. ... 330 Figure 4-28. Three-armed oligomeric phenylene ethylene (OPE) molecules used
to synthesize gold nanoparticle trimers (A) Linker with 7 rings (B)
Linker with 10 rings ... 331 Figure 4-29. TEM images of gold nanoparticle trimers (A) Solution containing
5 nm citrate-capped gold trimers linked with a 10-ring three-armed OPE. (B) Trimer of 15 nm particles linked with a 7-ring OPE. (C)
Trimer of 15 nm particles linked with a 7-ring OPE. ... 332 Figure 4-30. (A) Graph shows the percentage of particles that appeared to be in
trimers on a TEM grid for citrate-capped gold particles of various sizes both without and with the addition of a three-armed OPE linker. These values reflect averages measured for 2-3
experiments (B) The percentage of 15 nm particles that appeared to be in dimers and trimers in the presence of two different linker
molecules. ... 333 Figure 4-31. Optical absorption spectra for citrate-capped gold nanoparticle
solutions containing dimers and trimers. (A) Solutions of 5 nm
particles (B) Solutions of 15 nm particles. ... 336 Figure 4-32. Bifunctional linkers used to link gold particles to platinum and nickel .... 338 Figure 4-33. TEM images of citrate-capped gold particles (20 nm) and
mercaptobenzoic-acid-capped platinum paticles (7 nm) in the
presence of the bifunctional linker shown in Figure 4-32 (A) ... 339 Figure 4-34. TEM image of citrate-capped gold particles (10 nm) and platinum
particles capped with 2-mercaptoethanesulfonate in the presence
of the linker shown in Figure 4-32 (B) ... 342 Figure 4-35. TEM image of citrate-capped gold particles (5 nm) in the presence
of tiopronin-capped platinum particles and the bifunctional linker
shown in Figure 4-32 (A) ... 342 Figure 4-36. Optical absorption spectra of gold and platinum particles upon the
mercaptobenzoic acid (MBA) – capped platinum particles (B)
10 nm gold particles with tiopronin-capped platinum particles ... 344 Figure 4-37. TEM image of aggregated citrate-capped gold particles (10 nm) in
the presence of PTAB-capped nickel particles ... 347 Figure 4-38. Bifunctional linker used to link gold particles to TiO2 and Fe3O4 ... 349
Figure 4-39. TEM image of citrate-capped gold particles (15 nm) with succinic acid-capped TiO2 particles (9 nm) in the presence of the
bifunctional linker shown in Figure 4-38 ... 350 Figure 4-40. TEM images of hetero-assemblies formed between citrate-capped
gold particles (15 nm) and tartaric acid-capped Fe3O4 particles
(7 nm) ... 351
5. Size-Exclusion Chromatography of Particles and Particle
Assemblies
Figure 5-1. Schematic of column used for size-exclusion chromatography ... 369 Figure 5-2. Sample van Deemter plot calculated from Equation 5-5 indicating
the effects of flow rate on the plate height of a chromatographic
separation ... 374 Figure 5-3. Chromatograms of monodispersed hexanethiol-capped gold
nanoparticles before and after ligand-exchange with a
ferrocenyl-octanethiol ligand ... 375 Figure 5-4. (A) TEM image of dodecanethiol-capped gold particles. The
majority of particles appeared to be 3-4 nm, but lower contrast particles of approximately 1.4-1.6 nm were also observed in this region. (B) Size-exclusion chromatograms of
dodecanethiol-capped gold particles. ... 377 Figure 5-5. Chromatograms of CdS particles (5.7 nm) obtained using Nucleosil
500 C4 and Nucleosil 1000 C4 columns in series at various sodium
chloride concentrations ... 379 Figure 5-6. Size-exclusion chromatograms of citrate-capped gold particles
(5.3 nm and 38.3 nm) with varying concentrations of sodium dodecyl sulfate in the mobile phase. (A) 0 mM (B) 0.1 mM (C)
Figure 5-7. Schematics of possible interactions between sodium dodecyl sulfate (SDS) and both gold particles and size-exclusion
chromatography columns (A) Interactions between SDS and silica column material coated with an alkyl chain (B) No interactions between SDS and gold particles; SDS micelles act independently of gold particles (C) Hydrophobic tails of SDS associate with gold
particles (D) Inter-digitated bi-layer structure ... 381 Figure 5-8. (A) Effects of the sodium dodecyl sulfate (SDS) concentration on
retention the times of gold nanorods (a) and gold nanoparticles (b) in size-exclusion experiments. (B) Effects of the concentration of
Brij-35 added to a mobile phase consisting of 40 mM SDS ... 382 Figure 5-9. Schematic of SDS hemimicelles formed at a moderately-charged
gold electrode ... 383 Figure 5-10. Structure of Brij-35®, polyoxyethylene (23) lauryl ether ... 386 Figure 5-11. Three-dimensional size-exclusion chromatogram for a solution
containing gold nanoparticles (5.3 nm and 19.3 nm) and nanorods.
Mobile phase = 40 mM SDS with 10 mM Brij-35® ... 387 Figure 5-12. Closed-loop recycling chromatography of broadly distributed
1-decanethiol-gold nanoparticles (A) The configuration of the closed-loop recycling system. (B) Closed-closed-loop recycling chromatogram of 1-decanethiol-gold nanoparticles taken on a 1000 Å column with a
flow rate of 0.5 mL/min ... 388 Figure 5-13. Alternate-recycling chromatography of broadly distributed
1-decanethiol-gold nanoparticles (A) configuration of the alternate-recycling system. (B) Alternate-alternate-recycling chromatograms for a broadly distributed 1-decanethiol-gold nanoparticle sample at a flow
rate of 1.0 mL/min. ... 389 Figure 5-14. (A) Size-exclusion chromatogram showing the retention times of
citrate-capped gold nanoparticles: (a) 10 nm particles (b) 30 nm particles (c) solution containing both 10 nm and 30 nm particles (B) Chromatograms for assembles if 10 nm particles: (a) isolated particles (b) solution containing nanoparticle trimers (c) solution
containing nanoparticle dimers ... 391 Figure 5-15. (A) SEC Chromatograms of various sizes of citrate-capped gold
particles (B) Plot showing linear relationship between retention
Figure 5-16. SEC Chromatograms (A) citrate-capped gold particles (5 nm) upon addition of OPE linker molecule; chromatograms were taken as a function of time after linker addition and offset along the y-axis for clarity. (B) citrate-capped gold particles (10 nm), mercaptobenzoic acid-capped platinum particles, and a solution of both particles after
incubation with a bifunctional linker molecule ... 397 Figure 5-17. SEC chromatograms of citrate-capped gold particles with varying
mobile phase compositions ... 399 Figure 5-18. SEC Chromatograms (A) capped gold particles (B)
citrate-capped gold particles after ligand-exchange with BSPP ... 400 Figure 5-19. Bis(p-sulfonatophenyl) phenylphosphine (BSPP) ... 401 Figure 5-20. (A) SEC chromatograms of BSPP-capped gold particles. (B)
Normalized peak areas as a function of particle size for different
separation conditions. ... 402 Figure 5-21. SEC chromatograms of BSPP-capped gold particles at various
SDS concentrations. ... 404 Figure 5-22. (A) Retention of BSPP-capped gold particles as a function of SDS
concentration in the mobile phase (B) Resolution between 5 and
20 nm particles as a function of SDS concentration ... 405 Figure 5-23. The plate height and the resolution between 5 nm and 20 nm
particle as a function of flow rate ... 407 Figure 5-24. SEC chromatograms of BSPP-capped gold particles at (A) 0 mM
SDS, (B) 10 mM SDS and (C) 40 mM SDS ... 408 Figure 5-25. SEC chromatograms of gold nanoparticles (5 nm) and particle
assemblies (A) After ligand-exchange with BSPP (B) In the
absence of BSPP ... 409 Figure 5-26. SEC Chromatograms of citrate-capped gold particles ... 411 Figure 5-27. SEC Chromatograms of citrate-capped gold particles at various
SDS concentrations ... 412 Figure 5-28. SEC chromatograms of citrate-capped gold particles and tannic
Figure 5-29. Normalized peak areas for citrate-capped gold particles
characterized with several different SEC columns. ... 414 Figure 5-30. (A) Plot showing linear relationships between retention volume and
log(particle diameter) for citrate-capped gold particles in both Macrosphere (300 Å) and Nucleosil (500 Å) columns in series and a silica-C18 column (500 A) (B) Resolution between 5 and 20 nm
particles as a function of SDS concentration. ... 415 Figure 5-31. (A) SEC chromatograms of citrate-capped gold particles (10 nm) as
a function of time after the addition of an OPE linker molecule. (B)
Magnified view of chromatograms shown in (A) ... 417 Figure 5-32. SEC Chromatograms of a solution of citrate-capped gold particles
(10 nm) in a solution containing additional sodium citrate and
organic solvent taken as a function of time ... 418 Figure 5-33. Optical absorption spectra for a solution of citrate-capped gold
particles (10 nm) as a function of time after the addition of a molecular linker. The inset shows the absorption at 460 nm and
520 nm as a function of sqrt(time) ... 419 Figure 5-34. OPE molecule used in control experiment ... 420 Figure 5-35. (A) SEC chromatograms of a solution of citrate-capped gold
particles (10 nm) as a function of time after addition of the molecule shown in Figure 5-34 (B) Optical absorption spectra corresponding to the sample in (A). The inset shows the absorption at 460 nm
and 520 nm as a function of sqrt(time) ... 420 Figure 5-36. (A) SEC chromatograms of citrate-capped gold particles (10 nm) as
a function of time after the addition of a three-armed OPE linker
molecule. (B) Magnified view of chromatograms shown in (A) ... 421 Figure 5-37. Peak heights observed in SEC chromatograms plotted as a
function of sqrt(time). These data correspond to chromatograms shown in Figure 5-31 and Figure 5-36. (A) Observed heights for peaks associated with individual particles (B) Observed heights for
peaks associated with dimers and trimers ... 422 Figure 5-38. SEC chromatograms of mixed particle solutions (A) citrate-capped
gold particles (5 nm) with succinic acid-capped titania particles (B) citrate-capped gold particles (5 nm) with glycerol-capped iron oxide
Figure 5-39. SEC chromatograms of particle solutions containing citrate-capped
gold particles (5 nm) and tartaric acid-capped Fe3O4 particles. ... 425
6. Electrophoresis of Particles and Particle Assemblies
Figure 6-1 Electrophoretic velocity of charged molecules in an electric field is
dependent upon charge-to-size ratio ... 435 Figure 6-2. (A) Electrical double layer along capillary wall creates
electroosmotic flow (B) The total velocity of ions is determined by
the sum of the elecrophoretic and electroosmotic components ... 438 Figure 6-3. Forces acting on a charged particle in an electric field k1 =
electrophoretic force exerted on particle by electric field; k2 =
Stokes friction; k3 = retarding force; k4 = force due to relaxation
effect ... 445 Figure 6-4. The limits of Smoluchowski and Huckel in terms of particle radius
and double-layer thickness compared to the domain in which the
majority of colloids exist. ... 446 Figure 6-5. Variation of mobility with zeta potential for a spherical colloidal
particle in KCl at ka values > 3 ... 449 Figure 6-6. Electrophoretic mobility of nanoparticles with ζ-potential of
102.6 mV ... 451 Figure 6-7. Effects of SDS concentration on the electrophoretic mobility of gold
nanoparticles. CAPS, 10 mM, pH 10.0, applied voltage 20 kV (A)
5.3 nm (B) 19.0 nm ... 452 Figure 6-8. (A) Electrophoretic mobilities of α,γ-Al2O3 and Fe2O3 as a function
of pH (B) Electrophoretic mobilities of γ-Al2O3 and TiO2 as a
function of pH (C) Electropherograms of γ-Al2O3 and TiO2 at pH
9.0 (D) Electropherograms of a mixture of (a) α,γ-Al2O3, (b) γ-Al2O3
and (c) TiO2 as a function of pH ... 457
Figure 6-9. Gel electrophoresis of gold particles in 2% agarose gel (A) A mixture of 5 nm, 10 nm, 15 nm, 20 nm, 30 nm and 60 nm particles (B) A plot of migration distance vs. particle diameter showing that
Figure 6-10. Gel electrophoresis of particle assemblies in 2% agarose gel (A) Solution containing dimers of 5 nm particles compared to solution of isolated 5 nm particles (B) Solutions containing dimers and trimers composed of 10 nm and 15 nm particles compared to
solutions of isolated particles. ... 465 Figure 6-11. Molecules involved in CE experiments (A) Gold-citrate particles
underwent ligand-exchange with BSPP for added stability (B) CAPS buffer (C) SDS was added to mobile phase (D) Mesityl oxide was added to the sample and elutes at t0 (E) Octanophenone was
added to the sample and elutes at tmc ... 468
Figure 6-12. Electropherograms of 5 nm, 10 nm, 15 nm and 20 nm gold-citrate particles (A) CAPS Buffer, pH 9.8 (B) Phosphate Buffer, pH 8.0 Applied voltage = 18 kV, λdet = 254 nm; EOF marker = mesityl oxide
(t0); Micellar marker = octanophenone (tmc) ... 470
Figure 6-13 The dependence of pH on gold particle migration times, mobilities and interaction parameters (A) Migration times of mesityl oxide (t0)
and octananophenone (tmc) as a function of pH (B) Migration time
relative to EOF vs. nanoparticle diameter at several pH values (C) Electroosmotic and electrophoretic mobilities as a function of pH. (D) Interaction parameters of gold particles vs. nanoparticle
diameter as several pH values. ... 472 Figure 6-14. Migration time vs. nanoparticle diameter for gold particles in 10 mM
CAPS Buffer, 70 mM SDS, pH ~ 8-9 ... 474 Figure 6-15. Electroosmotic and electrophoretic mobilities as a function of
applied voltage ... 476 Figure 6-16. Capillary electropherogram of solution containing 5nm
nanoparticles and dimers linker contained three phenyl rings ... 478 Figure 6-17 (A) Capillary electropherograms of solutions containing 10 nm
particles, dimers and trimers (B) electropherograms altered to
reflect time relative to EOF (toluene) ... 480 Figure 6-18 (A). Capillary electropherogram of solution containing 5nm particles
and dimers (B) electropherograms of solutions containing 10nm
Figure 6-19 (A). Capillary electropherograms of solutions containing 5 nm particles and dimers (B) electropherograms of solution containing
10 nm particles, dimers and trimers ... 484 Figure 6-20. Schematic of Continuous Free-Flow Elelctrophoresis Apparatus ... 487 Figure 6-21. Photograph taken of 5nm particles in the CFFE chamber ... 489 Figure 6-22. Concentrated fractions collected after the CFFE separation of
particle solution containing dimers of 5 nm particles ... 490 Figure 6-23. UV-VIS spectra of fraction collected after CFFE separation of 5 nm
gold particles (A) Intensity increases for fractions 9-12 (B) Intensity decreases for fraction 12-21 (C) Plot of the peak maximum versus
fraction number ... 491 Figure 6-24. UV-VIS spectra of concentrated fractions collected after the CFFE
separation of particle solution containing 5nm dimers ... 492 Figure 6-25. Sample TEM images of fractions collected after CFFE separation of
particle solution containing dimers of 5 nm gold particles ... 494
7. Small Angle X-Ray Scattering
Figure 7-1. (A) Schematic of x-rays interacting with crystalline lattice (B) Higher magnification view of (A) showing the trigonometric basis
for Bragg’s Law ... 508 Figure 7-2. (A) Schematic of small x-ray scattering associated with a colloidal
solution (B) Images of SAXS set-up at Lawrence Berkeley National Lab. The flight path was adjustable from 1.3 m to 4.3 m. ... 511 Figure 7-3. Calculated scattering intensity profiles for nanoparticle solutions
containing nanoparticle homodimers (10 nm). ... 512 Figure 7-4. (A) Scattering profiles for citrate-capped gold particles (10 nm) in
the presence of sodium citrate and organic solvent taken over a period of six hours (B) The scattering profiles in (A) plotted on a
logarithmic scale. ... 513 Figure 7-5. (A) Scattering profiles for citrate-capped gold particles (10 nm) as
an OPE linker molecule (B) The scattering profiles in (A) plotted
on a logarithmic scale ... 514
8. Ligand-Exchange Kinetics
Figure 8-1. Psuedo-first-order rate plots for the exchange of
phenylethanethiolate by p-nitrophenol onto Au140(SC2Ph)53. The
natural log of the free ligand concentration was plotted versus time ... 518 Figure 8-2. Isocyanide-functionalized OPE molecule used in IR kinetic
experiments ... 519 Figure 8-3. (A) IR spectra of the isocyanide-functionalized OPE shown in
Figure 8-2 during incubation with hexanethiol-capped platinum particles monitored over a period of 75 minutes. (B) The
disappearance of the free isocyanide at 2120 cm-1 with time. ... 520 Figure 8-4. IR spectra of isocyanide-functionalized OPE obtained both after
deposition onto a KBr plate and in aqueous solution ... 521 Figure 8-5. Fluorescence quenching observed upon binding of a fluorescent
carboxylic acid-terminated thiophene to stearic-acid coated TiO2 ... 522
Figure 8-6. Bifunctional linker molecules used in fluorescence quenching
experiments ... 523 Figure 8-7. Optical absorbance and fluorescence spectra for Linker B.
Fluoresence spectrum was obtained after excitation at 380 nm. ... 524 Figure 8-8. Fluorescence spectra of Linker A in aqueous solution recorded over
a period of 1200 minutes. ... 525 Figure 8-9. (A) Fluorescence spectra taken for Linker B as citrate-capped gold
particles (5 nm) were added to the solution (B)Stern-Volmer plot of quenching observed as citrate-capped gold particles (5 nm) were
added to solutions of Linker A and Linker B ... 526
Appendix 1. Collaborative Publications Involving the
Integration of Nanoparticles and Nanoparticle
Assemblies into Lithographic Architectures
Appendix 2. Geometric Calculations Involving Nanoparticle
Dimers and Trimers
Figure A-2-1. Nanoparticle homodimer approximated as a rod ... 554 Figure A-2-2. Calculated linker lengths ... 556 Figure A-2-3. Nanoparticle trimer approximated as a cylinder ... 565 Figure A-2-4 Translational diffusion coefficient and hydrodynamic radius as a
function of cylindrical radius for a cylinder with a constant length of
5nm ... 568 Figure A-2-5. (A) Schematic of three-armed linker molecule with different linker
lengths (B) trimer geometry (C) high magnification schematic of trimer geometry showing how maximum particle size was
calculated ... 571 Figure A-2-6 (A) Trimer geometry showing gap between particles (B)
High-magnification schematic showing how the gap between the
1. Introduction
1.1. Molecular Electronics
The current trend in electronics is to manufacture faster devices with higher circuit densities and processing speeds. As processing speeds are limited by the time it takes for an electron to travel between devices,8 higher circuit densities (i.e. smaller feature sizes) are required for improved device performance. However, industry cannot sustain this trend with current silicon-based architectures as there is a limit to the feature size achievable via a lithographic, top-down approach to device
fabrication. As of 2001, the feature size on microchips was less than 0.1 µm. Once this size approaches 0.01 µm, silicon no longer retains its fundamental band
structure and quantum limitations will most likely hinder device performance.4,17 The
bottom-up approach of molecular-based device fabrication offers the possibility of continuing the trend towards miniaturization while avoiding the limitations imposed by current lithographic techniques. Using devices on the molecular length scale, it could be possible to incorporate 1014 devices per cm2, which is a million-fold increase over the density of the current Pentium chip, which contains 107-108 devices per cm2.4 In addition to performance improvements, molecular electronics offer potential cost and processing advantages over current semiconductor
finding efficient ways to link the molecular devices to the macroscale, outside world. Bridging the length scales between molecules (ca. 1 nm) and lithographic patterns (ca. 100 nm) will be necessary in a bottom-up approach for electronics fabrication.
1.1.1. Molecular Structure
One of the first challenges associated with developing nano-scale devices is identifying candidates for molecular ‘wires’ that are suitable for conduction. Oligomeric
phenylene
ethynylene (OPE) and phenylene vinylene (OPV) structures have been identified as
promising structures based on their linear, rigid structures and extended
conjugation. Figure 1-1 shows that these molecules are
R R
n
n R
R
A
B
C
Figure 1-1. (A) Semilogarithmic plots of current vs. voltage for Au/SAM/Pd nanowires junctions formed from dodecanethiol,
an oligomeric phenyleneethylene (OPE) and an oligomeric phenylenevinylene (OPV). Error bars were based on 10 or more electronic junctions. Figure taken from Cai et al.19
several orders of magnitude more conductive than a similarly-terminated alkane chain.14,19,24 Research focus has been directed towards OPEs, and significant efforts have been expended to develop facile methods for synthesizing long-chain OPEs for electronic applications.4,8,17,26,27 In addition, many variations of the basic OPE structure have been prepared. The molecular approach to electronics offers the advantage that each structure can be synthetically tailored to achieve the properties desired for a particular application. For example, electron-donating substituents can be added to increase the conductivity along the molecular
backbone.17 In contrast, insulating methylene groups can be incorporated to disrupt conductivity.4,17
One of the first examples of a molecule that was tailored to exhibit device characteristics was demonstrated in 1974 by Aviram et al.,13 who incorporated electron-donating, electron-withdrawing and insulating groups within a single
bridge so that the π-levels of these two groups did not interact on the time-scale of electronic motion. It was necessary that the LUMO of the acceptor molecule lie at or above the Fermi level of the electrode so that electron flow did not occur in the absence of an applied field. An applied field raised the Fermi level of the cathode and facilitated electron transfer to the acceptor as shown in Figure 1-2 (C). Electron transfer across the bridge occurred via either tunneling or thermally-activated
hopping to the donor, which then transferred current to the anode. Current did not flow in the reverse direction, because this pathway was energetically uphill.13,28
Another example shows how the addition of functional groups to an OPE backbone
O
O
O
O
O
B
A
D
Donor
Acceptor
C
Figure 1-2. (A) Schematic of an acceptor-bridge-donor molecular junction. Figure taken from Heath et al.1 (B) Example of an acceptor-bridge-donor molecule. Figure
adapted from Aviram et al.13 (C) Another example of an acceptor-bridge-donor