20th International Conference on Structural Mechanics in Reactor Technology (SMiRT 20) Espoo, Finland, August 9-14, 2009 SMiRT 20-Division 9, Paper 2604
Stability Analysis of Storage of Spent Fuel in stack of Trays in Pool
O P Singh
a, P. P. Karkhanis
a, K. Agarwal
a, K. N. S. Nair
aand G. R. Reddy
ba
Nuclear Recycle Group , BARC,, Mumbai, India, e-mail: [email protected]
b
Reactor Safety Division, BARC,, Mumbai, India, Keywords: 1.Spent fuel bundle 2.Fuel pool, 3.storage trays.
1
ABSTRACT
The spent fuel bundles from Pressurised Heavy Water Reactors (PHWRs) are stored under water in spent fuel storage facilities in stacks of 20 to 30 trays inside the water depth of 6-7 meters. All the safety systems, structures and components of storage the facility are required to meet Design basis Earthquake (DBE). A stability analysis of stack of trays of fuel bundles in seismic condition has been carried out for 20, 25 & 30 trays using transient FEM analysis based on time history of pool and discussed in this Paper.
A finite element model of stack of spent fuel trays has been developed to represent the behaviour under seismic condition. The models are created for each individual tray and spent fuel bundles are modelled as a lumped mass in tray FE model. The interlock between trays has been simulated using combination (i.e. spring + Gap) element. The contact element has been used in FE model to capture the lifting and sliding motion between trays and the same has been used for contact between resting surface and bottom most tray of stack. A time history analysis was performed for stack of 20, 25, and 30 trays with different friction of coefficient (0.1, 0.2 & 0.3) to verify its overall stability against turning and sliding under seismic event. These stacks of trays are found stable under the designed level of earthquake.
2.
INTRODUCTION
The natural Uranium spent fuel bundles having 19-pin geometry from Indian PHWRs are stored in water pools. These pools are underground structures provided with thick RCC walls and floors which are lined with SS plates. The pool is filled with demineralised water up to a depth of 6-7 m for radiation shielding consideration.
The spent fuel bundles are stored horizontally in stainless steel trays which are stacked one above the other on the pool floor. The trays have guiding and locking features for remote under water operation. There are number of such stacks (more than 200) of 20/30 trays spaced at 150 mm apart inside the pool as shown in figure.-1.
The overall size of individual storage trays is 1420x521x100 mm height and weight of tray with spent fuel bundles is 200 Kg approximately. Each tray contains 11 spent fuel bundles (figure-2 shows a tray with single fuel bundle for clarity). There are four tapered locators on the top of tray and corresponding female cut outs are provided on the bottom of tray as shown figure-2 for guiding and locking of trays. The overall height of stack of 30 trays is 3170 mm.
The stacks of trays are free standing over pool floor. Under the seismic event, stack of trays may slide and collide with neighbouring stacks or may topple. The regulatory requirement on this subject is that the stability of stack of trays has to be ensured under the Design Basis Earthquake (DBE).
2
One free standing stack of 20, 25 and 30 trays have been analysed with varying coefficient of friction. FE transient nonlinear analysis of stack of trays is carried out to predict the toppling and sliding behaviour based on the DBE time history motion of Fuel pool.
Details of analysis are discussed below.
3
FE MODEL & ANALYISI OF TRAYS AND FUEL BUNDLES
3.1
Computational model
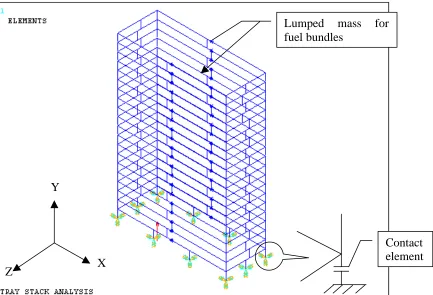
Each tray in a stack has been modelled using beam elements. There are four locators in a tray as shown in figure-2. These Locators have been modelled using Multi Point Constraint (MPC) element. Resting surface between bottommost tray and pool floor has been simulated using contact elements. Contact element has capability to simulate the friction and to capture the sliding of trays with respect to resting surface. Similarly the contact elements have been used to simulate the contact between the trays in a stack. Contact element has got capability to simulate the friction, sliding and uplift. Mass of the fuel bundles have been lumped on respective trays. During seismic event, stack of tray may lift up from the floor or individual tray can lift up from the underneath tray in stack. This vertical lift up of individual tray / stack of trays has been simulated using gap element which is part of contact element. The bottom holes of a tray have been shown in figure-2. The available horizontal gap (i.e operational clearance) between locator and corresponding locating hole has been simulated using combination ( gap + spring) element. The X and Z axis are lying in the horizontal plane and Y-direction indicates vertical Y-direction. FF Model is shown in figure-5(a) and typical deflected shape of stack of trays is shown in figure-5(b). Hydro dynamic effect of water has not been taken into account. Spent fuel pool is assumed rigid in analysis. The properties of material used for modelling the structural part of model are shown below.
Material Density, kg/m3
Modulus of elasticity, N/m2
Yield strength, N/m2
Ultimate strength, N/m2
Poisson’s ratio SS 304 L 8000 2 X 10¹¹ 170 X 106 485 X 106 0.3
3.2 Methodology:
The free standing stack of 20, 25 and 30 trays have been analysed for three different values of friction coefficient (µ=0.3, 0.2, 0.1) to simulate the dry and wet surfaces and to understand the trend and behaviour of structure under DBE. The analysis has been performed for simultaneous triaxial excitation time histories. Newmark method has been used for the time integration to get time history response. For force equilibrium Newton- Rapson iterative scheme has been used at each time step.
4
RESULTS AND DISCUSSION
As mentioned before the objective of non-linear transient analysis is to determine maximum uplift of trays to predict the toppling under DBE time history. Maximum slide of tray stack has been obtained from time history response to check the interaction of neighbouring stacks. Analysis has been carried out for stacks of 20, 25, and 30 trays under different friction coefficient of to predict the trend of structural behaviour. Displacement time history response of top most tray of stack have been shown in figure-6 to figer-8 for different cases in graphical form. The Maximum slides and vertical lift at bottom most trayand maximum displacement and maximum lift of top most tray of stacks are tabulated in Table-1. Results for different cases are discussed below
.
Contact
element
Figure 5(a)
-
Finite element model of stack of trays with fuel bundles
X
Y
Z
Lumped mass for
fuel bundles
4
The table-1 gives the summary of results for different cases as mentioned above
Table-1:
No. of trays and friction coefficient
Description Stack of 20 Trays Stack of 25 Trays Stack of 30 Trays
Displacement at bottom
most tray of stack µ = 0.1 µ = 0.2 µ = 0.3 µ = 0.1 µ = 0.2 µ = 0.3 µ = 0.1 µ = 0.2 µ = 0.3
Max. Slide in X-Dir. 27.3 6.2 1.9 24.0 5.6 2.8 21.1 2.7 2.3 Max. Vertical corner lift
in Y-Dir.
NO LIFT
NO
LIFT 0.035
NO
LIFT 0.031 1.4
NO
LIFT 0.27 2.2 Slide in Z-Dir. 25.3 5.6 0.3 22.8 4.7 0.8 23.8 4.2 1.6
Displacement of top
most tray of stack µ = 0.1 µ = 0.2 µ = 0.3 µ = 0.1 µ = 0.2 µ = 0.3 µ = 0.1 µ = 0.2 µ = 0.3
X-direction 32.8 23.2 12.1 31.4 32.1 17.1 35.1 26 21.05 (Vertical lift) Y NO
LIFT
NO
LIFT 0.24
NO
LIFT 0.25 1.60
NO
LIFT 0.48 2.5 Z-direction 36.8 23.8 19.3 44.0 37.1 20.2 49.4 40 29.5
Note- All dimensions are in mm.
It has been observed that the uplifting occurs at higher friction coefficient (µ=0.3) and it ceases as friction decreases. It has also been observed that the lift is maximum for stack of 30 trays and it decreases to zero for stack of 20 trays even at µ=0.3. The maximum uplift is 2.3 mm for bottom most tray and 2.5 mm for top most tray in the case of µ=0.3 and stack of 30 trays. It has been noticed that sliding increases with reducing value of µ. Maximum sliding observed is 27.3 mm for µ=0.1. As the height of stack increase (i.e. 20 tray, 25 tray & 30 trays) the sliding has reduced. This may be due to the increase in flexibility resulting low response acceleration attracted by stacks. It has also been observed that displacement of top trays along the X and Z-direction in general increasing except in the case of 25 tray stack along X-direction. This may be attributed to numerical problem which is being investigated. It can be observed from the graphs of time history response that the frequency contents are increasing with higher fiction as system behave more rigid due to sticking condition at higher friction.
5 20 trays, =0.1
Fig.6(a)-x: Displ. in X-dir., at =0.1
20 trays, =0.1
Fig.6(a)-y: Displ. in Y-dir.,, =0.1
20 trays, =0.1
Fig.6(a)-z: Displ. in Z-dir.,, =0.2 20 trays, =0.2
Fig.6(b)-x: Displ. in X-dir., at =0.2
20 trays, =0.2
Fig.6(b)-y: Displ. in Y-dir.,, =0.2
20 trays, =0.2
Fig.6(b)-z: Displ. in Z-dir.,, =0.2 20 trays, =0.3
Fig.6(c)-x: Displ. in X-dir., at =0.3
20 trays, =0.3
Fig.6(c)-y :Displ. in Y-dir., at =0.3
20 trays, =0.3
Fig.6(c)-z: Displ. In Z-dir., at =0.3 25 trays, =0.1
Fig.7(a)-x: Displ. in X-dir., at =0.1
25 trays, =0.1
Fig.7(a)-y: Displ. in Y-dir., at =0.1
25 trays, =0.1
Fig.7(a)-z : Displ. in Z-dir., at =0.1
6
5
CONCLUSION
From the detail dynamic transient analysis for stack of fuel storage trays for different value of friction coefficient it is concluded that in all cases the tray stack is stable and will not topple as the lift one corner of bottom most trays is negligible in comparison to the base dimension of tray. The extent of slide depends upon the friction coefficient between bottommost tray and SS lining at bottom of pool. From the tabulated results it can be concluded that lifting of top most tray is much less than locator’s height which prevent the fall of individual tray from a stack. The maximum displacement of top tray is 49.4 mm which is lesser than available gap of between two adjacent stacks. Hence the stacks will not collide with each other and system will be stable. These results are being verified with shake table tests using trays and dummy fuel bundles.
Acknowledgements. The author gratefully acknowledge the technical support and valuable suggestions provided by K. K. Vaze, Head, RSS, RSD, Dr. A. K. Ghosh, Head, RSD, Shri K. N. S. Nair, CDE (M), NRGP and Shri S. Basu, AD (P), NRGP.
Symbols
µ Fiction coefficient
REFERENCES
1. Design Basis Report of Spent Fuel Storage Facility at BARC, Tarapur 2. Envelope of Spectra for 540 MWe Plant on rocky site at NPP, Tarapur
8
0 10 20 30 40 50 60 70 80 90 100
0.0 0.2 0.4 0.6 0.8 1.0 1.2
Design Respose Spectra
Pse
Abs.
Acc.
(g)
Frequency (Hz)
Fig-4: