Copyright1999 by the Genetics Society of America
The Role of the Mismatch Repair Machinery in Regulating Mitotic and Meiotic
Recombination Between Diverged Sequences in Yeast
Wenliang Chen* and Sue Jinks-Robertson*
,†*Graduate Program in Genetics and Molecular Biology and†Department of Biology, Emory University, Atlanta, Georgia 30322
Manuscript received September 9, 1998 Accepted for publication December 18, 1998
ABSTRACT
Nonidentical recombination substrates recombine less efficiently than do identical substrates in yeast, and much of this inhibition can be attributed to action of the mismatch repair (MMR) machinery. In this study an intron-based inverted repeat assay system has been used to directly compare the rates of mitotic and meiotic recombination between pairs of 350-bp substrates varying from 82% to 100% in sequence identity. The recombination rate data indicate that sequence divergence impacts mitotic and meiotic recombination similarly, although subtle differences are evident. In addition to assessing recombi-nation rates as a function of sequence divergence, the endpoints of mitotic and meiotic recombirecombi-nation events involving 94%-identical substrates were determined by DNA sequencing. The endpoint analysis indicates that the extent of meiotic heteroduplex DNA formed in a MMR-defective strain is 65% longer than that formed in a wild-type strain. These data are consistent with a model in which the MMR machinery interferes with the formation and/or extension of heteroduplex intermediates during recombination.
H
OMOLOGOUS recombination involves the for- a log-linear relationship between the rate of recombina-mation of heteroduplex DNA in which single tion and the level of sequence divergence has been strands of DNA derived from different parental du- observed (Zawadzki et al. 1995; Datta et al. 1997;plexes are base-paired. The point at which the duplexes Vulicet al. 1997). Such a relationship is consistent with
exchange pairing partners is referred to as a Holliday the concept of a minimal efficient processing segment junction, and endonucleolytic cleavage of this junction (MEPS;ShenandHuang1986), which is defined as the can either maintain or reverse the linkage of markers length of perfect identity needed to efficiently initiate that flank the region of heteroduplex DNA. Mismatches recombination. If one considers recombination sub-present in heteroduplex DNA are corrected by the post- strates as a linear series of overlapping MEPS, then one replicative mismatch repair (MMR) machinery and such would predict that the number of MEPS should be a repair results in the genetic phenomenon of gene con- linear function of substrate length and an exponential version. The concerted conversion of a contiguous se- function of substrate identity.
ries of potential mismatches constitutes a gene conver- Much of the limitation imposed on recombination sion tract, the length of which can be used as a minimal between diverged (homeologous) sequences derives estimate of the extent of heteroduplex formed during from action of the MMR system. Inactivation of a compo-recombination (AhnandLivingston1986;Judd and nent(s) of the MMR system usually increases the rate Petes 1988; Symington and Petes 1988; Borts and of homeologous recombination, sometimes restoring Haber1989; Mezard et al. 1992; Harris et al. 1993; it to a level comparable to the rate of recombination
Sweetser et al. 1994; Porter et al. 1996; Chen and between identical sequences (Rayssiguieret al. 1989; Jinks-Robertson1998). Bortset al. 1990;Zahrtet al. 1994;de Windet al. 1995; Although mismatches often are used to infer the na- Zawadzkiet al. 1995;Dattaet al. 1996, 1997;Hunter ture of recombination intermediates, sequence diver- et al. 1996;ZahrtandMaloy1997). The biochemistry gence has been found uniformly to decrease recombina- of the MMR system has been best characterized in Esche-tion in bacterial species, yeast, and mammalian cells (for richia coli, where the primary role of the system is to a review, seeModrichandLahue1996). Surprisingly, a remove incorrect nucleotides incorporated during DNA single mismatch within a region of otherwise perfect synthesis (reviewed in ModrichandLahue 1996). In identity is sufficient to inhibit transformation in Bacillus E. coli, a MutS homodimer binds to the mismatched (ClaverysandLacks1986) or mitotic recombination bases and MutH binds to a nearby hemi-methylated dam in yeast (Dattaet al. 1997). In both bacteria and yeast,
site, which is present in newly replicated DNA. A MutL homodimer acts as a “molecular matchmaker” to bring together the MutS and MutH proteins, which in turn Corresponding author: Sue Jinks-Robertson, Department of Biology,
activates a latent endonuclease activity of MutH. The
1510 Clifton Rd., Emory University, Atlanta, GA 30322.
E-mail: [email protected] unmethylated, newly synthesized DNA strand is then
nicked, thus marking it for removal by helicases and sites (Keeneyet al. 1997). In contrast to the dispensable
role recombination plays in yeast mitosis, meiotic re-exonucleases.
Mismatch recognition systems similar to the E. coli combination serves an essential function by providing a physical link between homologous chromosomes. This MutHLS system have been described in eukaryotes and
have attracted much attention because defects have link ensures the attachment of homologs to opposite poles of the meiotic spindle and their subsequent dis-been associated with some forms of human hereditary
cancer (reviewed inKolodner1996). In yeast, multiple junction (reviewed inRoeder1995). Yeast studies have demonstrated that the mitotic (Selvaet al. 1995, 1997;
homologs of the E. coli MutS (Msh1-6p) and MutL
(Pms1p, Mlh1-3p) proteins have been identified, with Dattaet al. 1996, 1997) and meiotic (Bortset al. 1990;
Chamberset al. 1996;Hunteret al. 1996)
recombina-the major players in nuclear mismatch recognition
be-ing Msh2p, Msh3p, Msh6p, Pms1p, and Mlh1p (re- tion barriers imposed by sequence divergence (see above) can be partially relieved if one or more of the viewed inCrouse1998). Msh2p dimerizes with either
Msh3p or Msh6p, and each of these heterodimers recog- MMR genes is inactivated. Unfortunately, it has not been possible to directly compare the published mitotic vs. nizes specific types of mismatches. Pms1p likewise forms
heterodimers with Mlh1p, and these heterodimers inter- meiotic data because of the very different assay systems that have been used. In addition, meiotic studies have act with the Msh2p-containing heterodimers in a
man-ner analogous to the bacterial MutS-MutL interaction. not employed the systematic variation in substrate iden-tity that has been used in some mitotic studies (Datta Although the yeast Msh2 and Pms1/Mlh1 proteins
ap-pear to participate equally in the postreplicative repair et al. 1997).
The relative sequence identity requirements for mi-of mismatched bases, their antirecombination activities
are different. It has been shown in several studies that totic vs. meiotic recombination is an interesting issue. On the one hand, one might expect the identity require-elimination of Msh2p stimulates recombination
be-tween diverged sequences to a greater extent than does ments of meiotic recombination to be more stringent than those of mitotic recombination in order to ensure elimination of Pms1p (Chamberset al. 1996;Dattaet
al. 1996). Methylation is not used as a strand discrimina- that most interactions are allelic interactions between homologs rather than ectopic interactions between dis-tion signal in eukaryotes, so it is not surprising that no
eukaryotic MutH homologs have been identified. persed repeats. Ectopic interactions have the potential to generate genome rearrangements, which, if they oc-The antirecombination activity of the MMR
mach-inery presumably derives from the recognition of cur in meiosis, can directly impact gamete viability as well as the fitness of progeny. On the other hand, be-mismatches present in heteroduplex recombination
intermediates, but how the MMR machinery inhibits cause recombination is necessary for proper homolog disjunction in meiosis, one might expect meiotic recom-recombination once mismatches are detected is not
clear. Based on studies in both bacteria (Claverysand bination to forego the stringent homology requirements of mitotic recombination in order to guarantee that at Lacks1986;Zahrtet al. 1994;ZahrtandMaloy1997)
and yeast (Alaniet al. 1994), it has been proposed that least one crossover occurs between each pair of homo-logs. A fair comparison of mitotic and meiotic sequence mismatch recognition by the MMR machinery might
trigger either helicase-driven unwinding of heterodup- identity requirements, as well as the role of the MMR machinery in enforcing these requirements, necessi-lex DNA or immediate resolution of the heterodupnecessi-lex
intermediate. According to such models, one might pre- tates the use of the same system to measure the rates of both types of events. In this study an intron-based dict that the extent of heteroduplex formation should
be greater in the absence of MMR than in its presence. inverted repeat assay system was used to measure and directly compare the rates of mitotic vs. meiotic recom-Worthet al. (1994) indeed have shown that both the
rate and extent of in vitro RecA-catalyzed heteroduplex bination between pairs of nonidentical substrates. In addition, mitotic and meiotic conversion tract end-formation are reduced in the presence of purified MutS
and MutL proteins. In yeast,Alani et al. (1994) have points in wild-type vs. MMR-defective strains were deter-mined to ascertain the impact of MMR proteins on the argued that meiotic heteroduplex is longer in
MMR-deficient cells than in wild-type cells, and we have found formation of recombination intermediates. that mitotic gene conversion tracts in a msh2 msh3 strain
are 50% longer than those in a wild-type strain (Chen
MATERIALS AND METHODS andJinks-Robertson1998).
Homologous recombination in yeast occurs during Media and growth conditions:Yeast strains were grown non-selectively in YEP medium (1% yeast extract, 2% Bacto-pep-both mitotic and meiotic cell divisions. In mitotically
tone; 2.5% agar for plates) supplemented with either 2% glyc-dividing cells recombination constitutes an important
erol and 2% ethanol (YEPGE) or 2% dextrose (YEPD). mechanism for repairing broken DNA molecules that
tic acid (5-FOA) was added to minimal synthetic medium sup- mine the total viable cell count and on SCGGE-his medium to select for His1 recombinants. Colonies on YEPD and plemented with appropriate nutritional requirements (Boeke
et al. 1987). For meiotic experiments, diploid strains were SCGGE-his plates were counted 2 and 5 days, respectively, after plating. Data from 12 or more cultures (6 from each pregrown in YEPD overnight followed by sporulation in 2%
KOAc supplemented with 10mg/ml histidine. Both vegetative independent diploid) of each strain were used to calculate the mitotic recombination rate by the method of the median growth and sporulation were conducted at 308.
E. coli strains used for plasmid manipulations were grown (LeaandCoulson1949).
For meiotic rate determinations, portions of the vegetatively at 378in LB medium (1% tryptone, 0.5% yeast extract, 1%
NaCl; 1.5% agar for plates) supplemented with 150 mg/ml grown cultures used to measure mitotic recombination rates were sporulated at a density of 1–23107cells/ml. Random
ampicillin as appropriate.
Plasmid constructions:All inverted repeat (IR) constructs spores were prepared by treating sporulated cultures with
b-mercaptoethanol, followed by glusulase treatment to digest were contained on a pRS306-based plasmid (Sikorski and
Hieter1989), which has URA3 as a selectable marker. An the ascal wall and kill vegetative cells (DavidowandByers
1984). The cultures were then sonicated to disperse the spores, outline of the plasmid constructions and the alignments of
the IR substrates used in this study are presented in Figures and aliquots of appropriate dilutions were plated nonselec-tively on YEPD medium and selecnonselec-tively on SCGGE-his medium. 1 and 2, respectively. Detailed descriptions of the plasmid
constructions as well as the IR substrates (with the exception Colonies arising on YEPD and SCGGE-his plates were counted 2 and 6 days, respectively, after plating. The meiotic His1 of the cb2a/cb2a-4mmA substrates; see below) can be found
inDattaet al. (1996, 1997). pSR615 contains the cb2a/cb2a- recombination rate for a particular strain was calculated by averaging the rates determined for 6–8 independent cultures 4mmA IR substrates, which were derived from pAB96
(ob-tained from G. F. Crouse). pAB96 contains chickenbtubulin (usually half from each independent diploid). All standard deviations were ,35% of the rates in wild-type strains and isoform 2 (cb2a) cDNA sequences in the 59 recombination
cassette, cb2a-4mmA sequences in the 39cassette, and LEU2 ,50% of the rates in the MMR-defective strains.
Generating independent recombinants for mapping conver-as a selectable marker. cb2a-4mmA differs from cb2a by four
evenly spaced base substitutions that were introduced by site- sion tract endpoints:One-ml cultures, each inoculated using a different colony, were grown nonselectively in YEPGE me-directed mutagenesis. pSR615 was constructed by ligating an
AatII/NgoMI IR-containing fragment from pAB96 to AatII/ dium to generate mitotic recombinants for molecular analysis. Cells were washed with sterile H2O, resuspended in 200ml of NgoMI-digested pRS306, thereby changing the selectable
sterile H2O, and 100ml were plated on SCGGE-his medium
marker from LEU2 to URA3.
to select for His1recombinants. Only one colony was taken Yeast strain constructions:A complete list of strains used
from each culture to ensure that all mitotic recombinants in this study is given in Table 1. All diploid strains are isogenic
analyzed were of independent origin. Because recombinants and were constructed by mating derivatives of haploid strain
generated in meiosis do not divide before selective plating, SJR216 with derivatives of either SJR231 or SJR328. A pms1D
each meiotic recombinant derived from a given culture can derivative of each parental haploid strain was constructed by
be assumed to be of independent origin. Meiotic recombi-a strecombi-andrecombi-ard two-step gene trrecombi-ansplrecombi-acement method (Rothstein
nants of each strain were, therefore, obtained directly from the 1991) using BstXI-digested pSR211 (Datta et al. 1996). A
SCGGE-his plates used to determine meiotic recombination
msh2D::hisG derivative of each parental haploid was
con-rates. structed by one-step gene disruption (Rothstein1991) using
Molecular analysis of recombinants:Genomic DNA was
ex-AatII/XbaI-digested GC1914 (msh2D::hisG-URA3-hisG
plas-tracted by glass bead lysis (HoffmanandWinston1987) from mid obtained from G. F. Crouse). Ura1transformants were
each recombinant and used as a template for PCR amplifica-selected following transformation with either pSR211 or
tion. Recombination products were amplified individually us-GC1914. Transformants were purified nonselectively on YEPD
ing primers annealing to sequences flanking the recombina-and then plated on 5-FOA medium to identify Ura2
segre-tion substrates (Figure 1). The recombinasegre-tion product located gants. The MSH3 allele of SJR231 msh2D::hisG was converted to
within the intron was amplified using primers HIS3-702F (59
-msh3D::hisG by one-step gene disruption using EcoRI-digested
GTTTCTGGACCATATG) and HIS3-765R (59-GCACTCAAC pEN33 (msh3D::hisG-URA3-hisG plasmid; seeDattaet al. 1996)
GATTAG). The recombination product located downstream as described above. All gene disruptions were confirmed
of the reconstituted HIS3::intron gene was amplified using by PCR.
primers HIS3-1751F (59-GATGGCAAACATGTC) and T3 (59 -Plasmids containing identical or mismatched IR constructs
TGATGTCGGCGATATAGG). PCR products were purified us-were transformed into the isogenic haploids SJR328, GCY121
ing Qiaquick Spin Columns (QIAGEN, Chatsworth, CA) and (SJR231 msh2D::hisG msh3D::hisG), GCY128 (SJR231 pms1D),
were used directly as templates for DNA sequencing. FAI (59 -or SJR626 (SJR328 pms1D). Plasmids were targeted to the
ATGGACTAAAGGAGGCT) and T3 were used as sequencing
URA3 locus by digestion with StuI and integration of a single
primers for the intron and downstream recombination prod-copy of each plasmid was confirmed by Southern analysis.
ucts, respectively. All sequencing reactions were carried out Measuring mitotic and meiotic recombination rates:Diploid
using ABI Prizm Dye Terminator Cycle Sequencing Ready strains were created immediately before rate measurement
Reaction Kits and were run on an ABI Prizm 377XL DNA experiments in order to avoid the accumulation of recessive
sequencer (PE Applied Biosystems). lethal mutations. Two independent diploids, each derived by
mating two independently constructed haploid parents, were used for rate determinations. Diploids were constructed by
mixing appropriate haploids on YEPD medium; after 5 hr, RESULTS
the mating mixtures were streaked onto medium selective for
diploids. Two-day-old diploid colonies were used directly to The intron-based inverted repeat recombination assay inoculate 5 ml of YEPD medium and cultures were grown system: The assay system used to examine the effects overnight to a density ofz23108cells/ml. Cells were washed
of sequence divergence on recombination was derived with 5 ml of sterile H2O and resuspended in 1 ml of sterile
from a galactose-inducible HIS3 gene containing an arti-H2O. For mitotic rate determinations, aliquots of appropriate
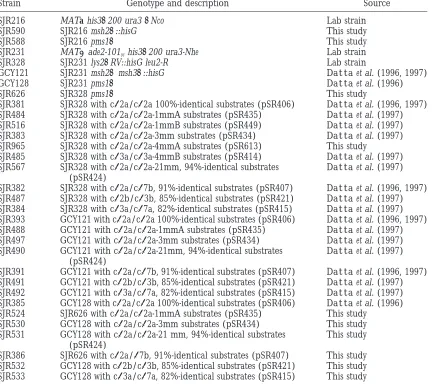
TABLE 1
Yeast strains
Strain Genotype and description Source
SJR216 MATa his3D200 ura3DNco Lab strain
SJR590 SJR216 msh2D::hisG This study
SJR588 SJR216 pms1D This study
SJR231 MATaade2-101ochis3D200 ura3-Nhe Lab strain
SJR328 SJR231 lys2DRV::hisG leu2-R Lab strain
GCY121 SJR231 msh2Dmsh3D::hisG Dattaet al. (1996, 1997)
GCY128 SJR231 pms1D Dattaet al. (1996)
SJR626 SJR328 pms1D This study
SJR381 SJR328 with cb2a/cb2a 100%-identical substrates (pSR406) Dattaet al. (1996, 1997)
SJR484 SJR328 with cb2a/cb2a-1mmA substrates (pSR435) Dattaet al. (1997)
SJR516 SJR328 with cb2a/cb2a-1mmB substrates (pSR449) Dattaet al. (1997)
SJR383 SJR328 with cb2a/cb2a-3mm substrates (pSR434) Dattaet al. (1997)
SJR965 SJR328 with cb2a/cb2a-4mmA substrates (pSR613) This study
SJR485 SJR328 with cb3a/cb3a-4mmB substrates (pSR414) Dattaet al. (1997)
SJR567 SJR328 with cb2a/cb2a-21mm, 94%-identical substrates Dattaet al. (1997)
(pSR424)
SJR382 SJR328 with cb2a/cb7b, 91%-identical substrates (pSR407) Dattaet al. (1996, 1997)
SJR487 SJR328 with cb2b/cb3b, 85%-identical substrates (pSR421) Dattaet al. (1997)
SJR384 SJR328 with cb3a/cb7a, 82%-identical substrates (pSR415) Dattaet al. (1997)
SJR393 GCY121 with cb2a/cb2a 100%-identical substrates (pSR406) Dattaet al. (1996, 1997)
SJR488 GCY121 with cb2a/cb2a-1mmA substrates (pSR435) Dattaet al. (1997)
SJR497 GCY121 with cb2a/cb2a-3mm substrates (pSR434) Dattaet al. (1997)
SJR490 GCY121 with cb2a/cb2a-21mm, 94%-identical substrates Dattaet al. (1997)
(pSR424)
SJR391 GCY121 with cb2a/cb7b, 91%-identical substrates (pSR407) Dattaet al. (1996, 1997)
SJR491 GCY121 with cb2b/cb3b, 85%-identical substrates (pSR421) Dattaet al. (1997)
SJR492 GCY121 with cb3a/cb7a, 82%-identical substrates (pSR415) Dattaet al. (1997)
SJR385 GCY128 with cb2a/cb2a 100%-identical substrates (pSR406) Dattaet al. (1996)
SJR524 SJR626 with cb2a/cb2a-1mmA substrates (pSR435) This study
SJR530 GCY128 with cb2a/cb2a-3mm substrates (pSR434) This study
SJR531 GCY128 with cb2a/cb2a-21 mm, 94%-identical substrates This study (pSR424)
SJR386 SJR626 with cb2a/b7b, 91%-identical substrates (pSR407) This study SJR532 GCY128 with cb2b/cb3b, 85%-identical substrates (pSR421) This study SJR533 GCY128 with cb3a/cb7a, 82%-identical substrates (pSR415) This study
replacement of the 39 or 59 half of HIS3::intron with the recombination substrates or the recombination products. It should be noted that neither intrachro-a 350-bp recombinintrachro-ation substrintrachro-ate creintrachro-ated intrachro-a 59 or 39
recombination cassette, respectively. All recombination matid gene conversion nor sister chromatid crossover produces His1recombinants. Intrachromatid gene con-substrates were derived from chickenb-tubulin cDNA
(cb) sequences and substrate pairs varied in identity version does not reorient the 39 HIS3::intron segment
and so recombinants are His2; a sister chromatid cross-from 82% to 100% (Figure 2). Juxtaposition of a 59and
39cassette in reverse orientation creates an IR construct over produces acentric and dicentric chromosomes and hence inviable His1 progeny.
with the recombination substrates flanking the 39half
of the HIS3::intron gene. Recombination between the We previously used the intron-based assay system to demonstrate that mitotic recombination between di-substrates via either intrachromatid crossover or sister
chromatid conversion flips the intervening HIS3::intron verged sequences in yeast is regulated in large part by the MMR machinery (Dattaet al. 1996, 1997). These
sequences (the “invertible segment”), thus
reconstitut-ing a full-length HIS3 gene with a complete intron con- studies, however, provided no information concerning the antirecombination role of the MMR machinery in taining one of the two recombination products. The
other recombination product is located distal to the meiotic recombination. To specifically address this issue and to directly compare the identity requirements of intact HIS3::intron gene. Because the recombinant cb
sequences within the HIS3::intron gene are spliced out mitotic vs. meiotic recombination, MATa strains con-taining IR constructs were mated with appropriate of the primary transcript and do not impact the gene
MSH2-defec-in the presence or absence of MMR proteMSH2-defec-ins. Mitotically, the cb2a/cb2a 100% substrates recombined at a rate ofz131026in the wild-type, msh2D, and pms1Dstrains. This similarity in recombination rates was unexpected because we consistently have found a two- to threefold elevation in recombination rates between identical se-quences in msh2D strains relative to MMR-competent strains (Datta et al. 1997; A. Bayliss, M. Hendrix, G. F. Crouse and S. Jinks-Robertson, unpublished results). Although we do not understand the reason for this discrepancy, we speculate that it could reflect either a haploid/diploid effect (all previous studies were done with haploid strains) or strain background differences (one of the haploid parents used in this study is the same as that used in other studies, but the other is unrelated).
The rate of meiotic recombination between the cb2a/ cb2a 100% substrates was z100-fold greater than the corresponding mitotic rate in the wild-type, msh2D, and
pms1D strains. It should be noted, however, that the induction of meiotic recombination is usually assessed using recombination frequencies rather than rates. Whereas the meiotic recombination frequency is equal to meiotic rate (all events occur in a single generation), the mitotic frequency is generally higher than mitotic rate because of the random occurrence of mitotic re-combination over several generations. With our sub-strates, the 100-fold difference between mitotic and mei-otic recombination rates translates to approximately a 10-fold difference in mitotic vs. meiotic recombination
Figure 1.—Construction of IR substrates. The
pGAL-frequencies. This is considerably less than the several HIS3::intron construct contained on plasmid pSR266 is shown
at the top. Open boxes correspond to HIS3 sequences, solid hundred-fold meiotic induction generally observed with boxes to artificial intron sequences, and gray boxes to cb allelic sequences, and may be related to the inherent sequences; boxes are not to scale. The positions of the oligonu- bias for intrachromosomal events in mitosis (Fabre et cleotides used as PCR primers are indicated by arrows
num-al. 1984;Kadyk and Hartwell 1992; Jinks-Robert-bered as follows: 1, HIS3-702F; 2, HIS3-1751F; 3, HIS3-765R;
sonet al. 1993) vs. interchromosomal events in meiosis
4, T3. The recombinant cb segment within the intron was
amplified using primers 1 and 3; the recombinant segment (Haberet al. 1984; Gameet al. 1989; Schwacha and downstream of the reconstituted HIS3::intron gene was ampli- Kleckner 1997). It can be estimated that z10% of
fied using primers 2 and 4. “meiotic” events involving the IR substrates are likely
of mitotic origin, but we do not believe that this 10% significantly impacts the meiotic data.
tive (msh2D/msh2D MSH3/msh3D), or PMS1-defective
We reported previously that a single mismatch within (pms1D/pms1D) diploid strains. The MSH2-defective
the 350-bp IR substrates was sufficient to reduce mitotic and PMS1-defective diploid strains will hereafter be
re-recombination 4-fold in a wild-type haploid strain, and ferred to as msh2D and pms1D strains, respectively. It
this reduction was entirely dependent on the MMR ma-should be noted that all diploids were heterozygous for
chinery (Dattaet al. 1997). Mitotic recombination rates
the IR plasmid, thus precluding the production of His1
in diploid strains were measured for two pairs of sub-recombinants by interchromosomal interactions.
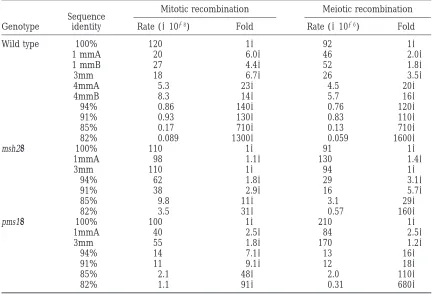
strates whose sequences differ by a single nucleotide: Recombination rates between identical and
mismatch-1mmA and 1mmB cb2a sequences differing at positions containing substrates:Mitotic and meiotic
recombina-884 (Arecombina-884G) and 883 (G883C), respectively. Although tion rates were inferred in each strain by measuring
the 1mmA and 1mmB substrates differ in the types of the rates of His1 prototroph formation by fluctuation
mismatches that potentially can be formed in hetero-analysis and random spore hetero-analysis, respectively, and
duplex recombination intermediates (A/C or G/T mis-these rates are presented in Table 2. Recombination
match for 1mmA; G/G or C/C mismatch for 1mmB), rates between 100% identical cb2a sequences were
mea-their mitotic recombination rates in a wild-type back-sured in the wild-type, msh2D, and pms1D strains, and
ground were decreased to similar extents relative to the these rates were used as a normalization standard when
Figure 2.—Alignment of recombination substrates de-rived from cb cDNA se-quences. (A) cb sequences were numbered as in the Gen-Bank files (see Datta et al.
1997 for details). For substrates containing one to four mis-matches, the nature and posi-tion of the mismatches are in-dicated as a subscript. Each potential mismatch (mm) be-tween a given pair of sequences is indicated by a vertical line. All sequences arez350 bp. (B) Alignment of cb2/cb2-21 mm sequences. Sequences of per-fect identities are boxed and shaded in gray. Although we refer to positions within the aligned sequences using the numbering system shown, it should be noted that the cb2a/ cb2a-21mm homology does not actually begin until posi-tion 7.
1mmB). In contrast to the approximately 5-fold effect served for the 1mm substrates, three mismatches re-duced mitotic recombination rates more than meiotic observed mitotically, the mismatches in the 1mmA and
1mmB substrates reduced meiotic recombination only rates (6.7-fold vs. 3.5-fold) in a wild-type background, and both reductions were completely dependent on the 2-fold and 1.8-fold, respectively, relative to the 100%
control substrates. This indicates that a single potential MMR machinery. When the recombination substrates differed by four or more nucleotides, however, meiotic mismatch has less impact on meiotic than on mitotic
recombination rates. Elimination of MSH2 restored the recombination rates in a wild-type background were reduced just as much as the mitotic rates (Table 2). mitotic and meiotic recombination rates of 1mmA to
those of the 100% control substrates. Although deletion Although elimination of Msh2p or Pms1p increased both mitotic and meiotic recombination rates, the rates of the PMS1 gene also increased the mitotic
recombina-tion rate between the 1mmA substrates, the pms1Drate for the 94%, 91%, 85%, and 82% identical substrates were not equivalent to those observed with the 100% for the mismatched substrates was lower than the 100%
control rate. Meiotic recombination between the 1mmA control substrates. The MMR-independent decrease in recombination rates with these lower levels of sequence substrates was not impacted by elimination of Pms1p.
To examine the effects of multiple mismatches on identity presumably reflects an inability of the recombi-nation machinery to efficiently initiate recombirecombi-nation mitotic and meiotic recombination, substrates
con-taining three or more mismatches were introduced into between these sequences (Dattaet al. 1997). In contrast
ob-TABLE 2
Rates of His1recombinants
Mitotic recombination Meiotic recombination
Sequence
Genotype identity Rate (31028) Fold↑↓ Rate (31026) Fold↑↓
Wild type 100% 120 13 92 13
1 mmA 20 ↓6.03 46 ↓2.03
1 mmB 27 ↓4.43 52 ↓1.83
3mm 18 ↓6.73 26 ↓3.53
4mmA 5.3 ↓233 4.5 ↓203
4mmB 8.3 ↓143 5.7 ↓163
94% 0.86 ↓1403 0.76 ↓1203
91% 0.93 ↓1303 0.83 ↓1103
85% 0.17 ↓7103 0.13 ↓7103
82% 0.089 ↓13003 0.059 ↓16003
msh2D 100% 110 13 91 13
1mmA 98 ↓1.13 130 ↑1.43
3mm 110 13 94 13
94% 62 ↓1.83 29 ↓3.13
91% 38 ↓2.93 16 ↓5.73
85% 9.8 ↓113 3.1 ↓293
82% 3.5 ↓313 0.57 ↓1603
pms1D 100% 100 13 210 13
1mmA 40 ↓2.53 84 ↓2.53
3mm 55 ↓1.83 170 ↓1.23
94% 14 ↓7.13 13 ↓163
91% 11 ↓9.13 12 ↓183
85% 2.1 ↓483 2.0 ↓1103
82% 1.1 ↓913 0.31 ↓6803
on mitotic and meiotic recombination rates between nant cb segments flanking the invertible HIS3::intron segment.
the 94%, 91%, 85%, and 82% identical substrates in
MMR-competent strains, it should be noted that, in As illustrated in Figure 2, the cb2a and cb2a-21mm sequences differ at 21 positions, thereby dividing the MMR-defective cells, meiotic recombination between
these substrates was consistently impacted more by a substrates into 21 intervals of perfect identity (two mis-matches are adjacent to each other). A given mismatch decrease in sequence identity than was mitotic
recombi-nation. Mitotic recombination rates between the 85% was considered to have been converted if the cor-responding nucleotides in the recombinant cb2a or 82% identical substrates, for example, were reduced
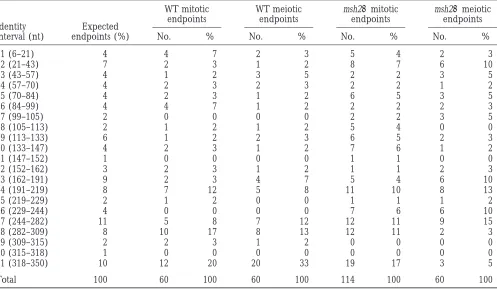
an average of 16-fold in the msh2Dstrains and 63-fold sequences were identical. A gene conversion tract en-compasses a series of contiguous mismatches and has in the pms1Dstrains. The corresponding meiotic
recom-bination rates between the 85% or 82% identical sub- endpoints in two discrete intervals. An endpoint was assigned to a given interval (intervals are identified by strates were reduced an average of 50-fold in the msh2D
strains and 180-fold in the pms1Dstrains relative to the the positions of the flanking mismatches) if the mis-match defining one side of the interval was converted 100% control substrates.
Mitotic and meiotic gene conversion tract endpoints but the mismatch defining the other side was not. If one assumes that gene conversion tracts start and end in wild-type and msh2D strains: One approach to
ad-dressing the mechanism of the MMR-associated inhibi- at random, then the number of endpoints contained in a given identity interval should be directly propor-tion of recombinapropor-tion is to determine whether the
for-mation of recombination intermediates is altered by the tional to the length of that interval. Interval 318–350, for example, contains 31 bp of perfect identity, which MMR machinery. Because gene conversion tracts are
generally assumed to be a direct reflection of the hetero- constitutes z10% of the 322 bp of perfect identity shared between the cb2a/cb2a-21mm substrates. One duplex DNA intermediate formed during
recombina-tion, 94% identical substrates were used to map the would predict, therefore, that this interval should con-tainz10% of all conversion tract endpoints. The experi-endpoints of conversion tracts in mitotic and meiotic
His1 recombinants derived from both wild-type and mentally determined conversion tract endpoint distri-butions were compared to the expected distribution by
msh2Ddiploid strains. Conversion tract endpoints were
TABLE 3
Distribution of conversion tract endpoints
WT mitotic WT meiotic msh2Dmitotic msh2Dmeiotic
endpoints endpoints endpoints endpoints
Identity Expected
interval (nt) endpoints (%) No. % No. % No. % No. %
1 (6–21) 4 4 7 2 3 5 4 2 3
2 (21–43) 7 2 3 1 2 8 7 6 10
3 (43–57) 4 1 2 3 5 2 2 3 5
4 (57–70) 4 2 3 2 3 2 2 1 2
5 (70–84) 4 2 3 1 2 6 5 3 5
6 (84–99) 4 4 7 1 2 2 2 2 3
7 (99–105) 2 0 0 0 0 2 2 3 5
8 (105–113) 2 1 2 1 2 5 4 0 0
9 (113–133) 6 1 2 2 3 6 5 2 3
10 (133–147) 4 2 3 1 2 7 6 1 2
11 (147–152) 1 0 0 0 0 1 1 0 0
12 (152–162) 3 2 3 1 2 1 1 2 3
13 (162–191) 9 2 3 4 7 5 4 6 10
14 (191–219) 8 7 12 5 8 11 10 8 13
15 (219–229) 2 1 2 0 0 1 1 1 2
16 (229–244) 4 0 0 0 0 7 6 6 10
17 (244–282) 11 5 8 7 12 12 11 9 15
18 (282–309) 8 10 17 8 13 12 11 2 3
19 (309–315) 2 2 3 1 2 0 0 0 0
20 (315–318) 1 0 0 0 0 0 0 0 0
21 (318–350) 10 12 20 20 33 19 17 3 5
Total 100 60 100 60 100 114 100 60 100
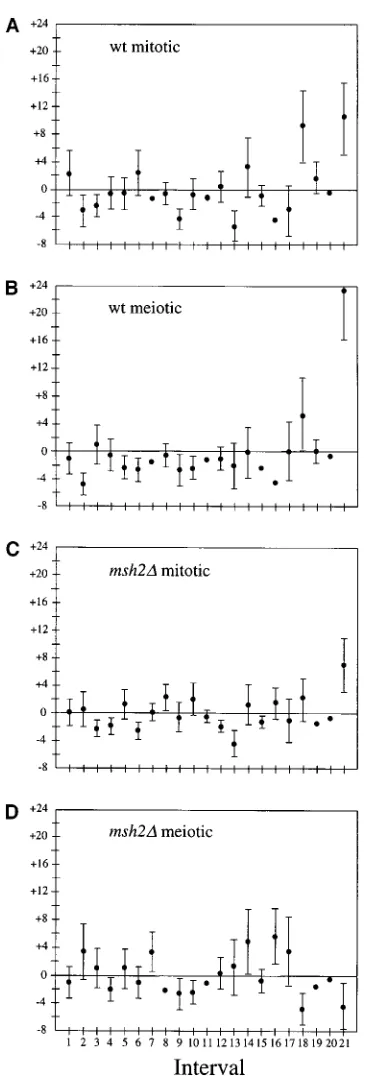
each identity interval from the percentage of observed endpoint distributions or in calculations of conversion tract lengths (see below). The distribution of the meiotic endpoints. This yields positive and negative percentages
which, when plotted, indicate an excess or deficit of conversion tract endpoints is presented in Table 3 and graphically compared to the expected distribution in endpoints, respectively.
Gene conversion tracts were determined for 30 mi- Figure 3B. Strikingly, the most 39interval, interval 318– 350, contained 33% of all endpoints whereas only 10% totic His1 recombinants generated in the wild-type
strain. Twenty-eight of the recombinants had continu- were predicted to be in this interval on the basis of its length. Most of the remaining identity intervals exhib-ous conversion tracts with all mismatches converted in
the same direction. The other two recombinants had ited a mild deficit of endpoints. A comparison of the distributions in Figure 3, A and B, indicates that the no detectable conversion events and, therefore, were
assumed to have both endpoints in the same interval. moderate mitotic clustering of endpoints at the 39end of the substrates is exaggerated in the corresponding The expected and observed distributions of conversion
tract endpoints are presented in Table 3 and are com- meiotic recombinants.
In the absence of a functional MMR system, the mis-pared graphically in Figure 3A. Several of the 39intervals
(e.g., intervals 318–350 and 282–309) have a notable matches present in heteroduplex molecules formed during recombination should be segregated at the next excess of endpoints, indicating that the ends of the
substrates proximal to the invertable HIS3::intron seg- round of DNA replication, thus producing the equiva-lent of a gene conversion tract. Sixty-three mitotic His1 ment may be preferred sites for initiating and/or
resolv-ing recombination intermediates. recombinants derived from the msh2D strain were se-quenced to estimate the extent of heteroduplex forma-To directly compare mitotic and meiotic conversion
tracts, conversion tracts were determined for 33 meiotic tion. Fifty recombinants had continuous asymmetric conversion tracts, 6 had no mismatches converted, and His1 recombinants isolated from the same wild-type
strain. Of these conversion tracts, 27 were continuous 7 had complex conversion events. This class distribution is not statistically different from that of the mitotic con-and asymmetric con-and 3 had no mismatches converted.
The remaining 3 recombinants contained either inter- version tracts in wild-type cells (P . 0.1 by x2 contin-gency test). The distribution of conversion tract end-rupted conversion tracts or continuous but bidirectional
Figure4.—Models of IR recombination. Inversion of a seg-ment of DNA between inverted repeats can occur by either (A) intrachromatid crossover or (B) sister chromatid gene conversion. The open and solid boxes correspond to the IR substrates that flank the invertible HIS3::intron segment, which is represented by a loop with an arrow indicating orientation. Open circles denote centromeres. It should be noted that if the internally paired chromatid in A is straightened, it is identi-cal to the top chromatid in B in terms of the recombination endpoints. Thus, although the conversion tract in A would be calculated to be quite short, a conversion tract with identical endpoints would be relatively long if one assumes the model in B.
to the weak 39 clustering of mitotic conversion tract endpoints evident in wild-type cells (Figure 3A), end-points appeared to be more or less randomly distributed in the MMR-defective cells.
Thirty-three meiotic His1recombinants derived from the msh2Dstrain also were analyzed. Twenty-six recombi-nants had continuous asymmetric conversion tracts, 4 had no mismatches converted, and 3 had complex tracts. This class distribution is the same as that of the meiotic recombinants isolated from a wild-type strain (P.0.9 byx2contingency test). The meiotic conversion tract endpoint distribution is presented in Table 3 and is compared graphically to the expected distribution in Figure 3D. In contrast to the very striking clustering of meiotic endpoints in interval 318–350 in wild-type cells (Figure 3B), there was no evident clustering of meiotic
Figure 3.—Conversion tract endpoint distributions. The
percentages of endpoints expected in each interval (see Table endpoints in MMR-defective cells.
3 for the interval numbers) were subtracted from the observed Mitotic and meiotic conversion tract lengths in wild-percentages, and the residual values were plotted (solid cir- type andmsh2Dstrains:In the assay system used here, cles). Positive or negative deviations of observed from
ex-reorientation of the HIS3::intron segment between the pected percentages indicate an excess or deficit of endpoints,
recombination substrates is required in order for a re-respectively. Vertical bars correspond to standard deviations
(SDs), each of which was approximated by taking the square combinant to be His1(Figure 1). Reorientation involves root of the number of endpoints observed in a given interval. interactions between the flanking cbsegments and can The SDs thus obtained were converted to percentages, and occur either by intrachromatid crossover or by sister these percentages were added to and subtracted from the
chromatid conversion. As illustrated in Figure 4, an corresponding percentage deviations. The SD for interval 21
intrachromatid crossover requires pairing of two sub-in B is off the y-axis scale.
chro-TABLE 4
Conversion tract parameters
Wild typea msh2Db
Mean 95% CI Mean 95% CI P Value
Mitotic conversion tracts
Minimal length 258 194, 321 290 243, 338 0.43
Maximal length 303 243, 363 335 289, 380 0.42
Average length 280 218, 342 312 266, 359 0.42
Mismatches converted 15.1 11.3, 18.9 16.7 13.9, 19.5 0.50
Meiotic conversion tracts
Minimal length 204 152, 256 339 288, 390 0.0006
Maximal length 255 206, 305 382 334, 430 0.0006
Average length 230 179, 281 361 312, 410 0.0006
Mismatches converted 11.9 8.8, 15.0 19.3 16.0, 22.6 0.002
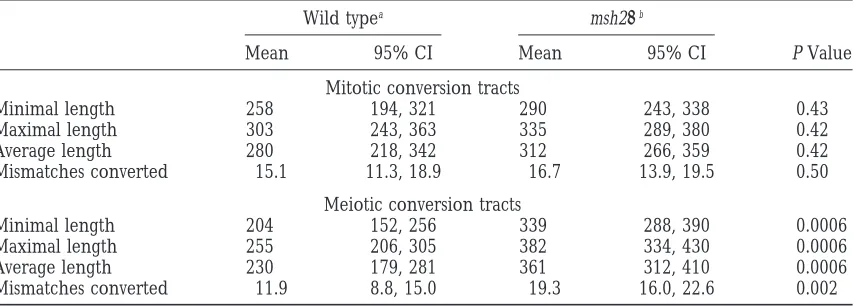
The mean value and the 95% confidence interval (CI) are presented for each parameter. A Student’s t-test was performed for each parameter to compare the mean value of the wild-type group to that of the msh2D group; the P value is reported. n denotes the number of conversion tracts included in each analysis. The minimal, maximal, and average conversion tract lengths, as well as the number of mismatches converted, were determined according to the sister chromatid conversion model. The minimal extent of a given conversion tract was calculated as the sum of conversion tracts on each side of the invertible HIS3::intron segment; these tracts were individually calculated by subtracting from 350 bp the position of the most-distal mismatch converted with respect to the invertible segment. The maximal length of the same conversion tract was determined by adding to the minimal length the lengths of the identity intervals that flanked the minimal tract on either side. The average length of a given conversion tract was calculated as the mean of minimal and maximal lengths. The number of mismatches converted was manually counted for each recombinant according to the sister chromatid conversion model.
an530 for mitotic and meiotic conversion tracts.
bn557 for mitotic conversion tracts; n530 for meiotic conversion tracts.
matid conversion involves pairing of two pairs of sub- Table 4 presents the mean values of the minimal, maximal, and average conversion tract lengths, as well strates, one on either side of the invertible segment.
Given the same conversion tract endpoints, the calcu- as the average number of mismatches converted. The mitotic gene conversion tracts in the wild-type diploid lation of conversion tract length is very different
de-pending on whether a recombination event occurs strain averaged 275 bp, which agrees very well with the 280-bp average length reported in haploid cells (Chen through the intrachromatid crossover pathway vs. the
sister chromatid conversion pathway (see Figure 4). Al- andJinks-Robertson1998). In msh2Ddiploid cells, the average mitotic tract length was 312 bp, which is slightly, though intrachromatid crossover and sister chromatid
conversion are genetically indistinguishable, we have but not significantly, longer than the tract length in wild-type diploid cells. This is in contrast to the statistically argued previously that most of the His1 recombinants
selected by our inverted repeat system arise via the sister significant lengthening of tracts (from 275 bp to 385 bp) observed previously by us in a msh2Dmsh3Dhaploid chromatid conversion pathway (Chen and
Jinks-Rob-ertson 1998). Using the experimentally determined strain (ChenandJinks-Robertson1998). One possible reason for the tract length difference in the msh2D dip-conversion tract endpoints for each mitotic or
mei-otic recombinant, the corresponding conversion tract loid cells vs. the msh2Dmsh3Dhaploid cells is that Msh3p might be involved specifically in regulating conversion length was calculated according to the sister chromatid
conversion model. As for the conversion tract endpoint tract length independently of Msh2p. We tested this possibility by analyzing conversion tracts in a msh2D analysis, only recombinants with continuous conversion
tracts or no conversion tracts were included in the calcu- haploid strain isogenic to the previously used msh2D
msh3Dhaploid (data not shown). The average conver-lation of conversion tract lengths. It should be noted
that a “no conversion” event corresponds to a sister sion tract length in the msh2Dhaploid was 349 bp, which is significantly different from the 275 bp length in wild-chromatid conversion in which the endpoints on either
side of the HIS3::intron invertible segment are in the type haploid cells (P,0.05 by Student’s t -test) but not significantly different from the 385-bp average length same interval (e.g., an event that initiates in interval
191–219 on one side of the invertible segment, proceeds in the msh2Dmsh3Dhaploid cells (P50.33 by Student’s
t -test). We thus are left with the speculation that the
through the invertible segment, and ends in interval
may reflect a haploid/diploid difference in recombina-tion or could reflect the fact that the haploid and diploid strains are not isogenic.
The average length of meiotic conversion tracts was 204 bp in the wild-type diploid strain vs. 339 bp in the
msh2D diploid strain. This 65% difference in meiotic tract lengths is statistically significant and suggests that the MMR machinery regulates the extent of hetero-duplex formation during meiosis. Although mitotic tracts were longer than meiotic tracts in wild-type cells (280 bp vs. 230 bp) and meiotic tracts were longer than mitotic tracts in msh2Dcells (361 bp vs. 312 bp), neither of these differences is statistically significant.
DISCUSSION
An intron-based IR assay system was used to examine mitotic and meiotic recombination rates between identi-cal and mismatched sequences in both MMR-competent
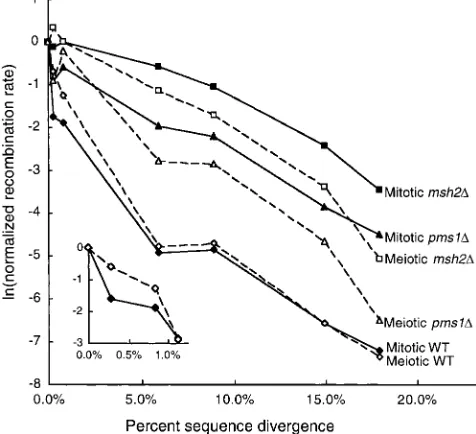
and MMR-defective yeast strains. Recombination rates Figure5.—Relationship between recombination rates and were measured in isogenic wild-type, msh2D, and pms1D sequence divergence. The natural logarithms of the normal-ized recombination rates in Table 2 are plotted as a function diploid strains, thus allowing a direct comparison of the
of the percentage of sequence divergence. The mitotic or impact of sequence divergence on mitotic vs. meiotic
meiotic normalized rates for each strain genotype were ob-recombination events. In addition, ob-recombination
prod-tained by dividing each rate by the rate obprod-tained with the ucts derived from 94%-identical substrates were se- 100% identical control substrates.
quenced to estimate the extent of meiotic vs. mitotic heteroduplex formation in wild-type and msh2Dstrains.
It should be noted that the substrates in all strains were tract length analysis indicates, however, that similar ex-tents of heteroduplex are formed in mitosis and meiosis. present on only one copy of chromosome V, which limits
detectable recombinants to intrachromosomal events With four or more mismatches, the normalized levels of mitotic and meiotic recombination rates for a given and precludes the production of recombinants via
re-combination between homologs. level of substrate identity were indistinguishable in a wild-type background. If one assumes that mismatches Recombination rates between mismatch-containing
substrates in wild-type cells:The rates of mitotic and have a cumulative negative effect on recombination, then the probability of escaping the antirecombination meiotic recombination were measured between cb
sub-strates varying in identity from 82% to 100% (see Figure activity of the MMR machinery will become essentially zero at some level of divergence, and the inclusion of 2 for substrate alignments). Recombination rates are
given in Table 2, and all recombination rates obtained additional mismatches will not further impact recombi-nation. We suggest that the probability that a given with a strain of a given genotype (wild-type, msh2D, or
pms1D) were normalized to the rate obtained with 100%- mismatch triggers the antirecombination activity of MMR proteins is less in meiosis than in mitosis, but that identical cb2a control substrates. These normalized data
are presented graphically in Figure 5 to more easily the cumulative effect of multiple mismatches in both cases is to eventually trigger antirecombination with the compare and contrast mitotic and meiotic
recombina-tion rates in the three strain backgrounds used. In a wild- same efficiency. The net result would be less inhibition of meiotic recombination than mitotic recombination type strain, the presence of one or three mismatches in
the recombination substrates reduced mitotic recombi- by one or a few mismatches, but similar levels of inhibi-tion by higher levels of sequence divergence.
nation more than meiotic recombination (see inset in
Figure 5). Although the mitotic vs. meiotic differences The differential effect of a very low level of sequence divergence on the overall efficiency of mitotic vs. mei-are subtle, they suggest that mismatches in meiotic
het-eroduplex intermediates are either recognized less effi- otic recombination in wild-type cells makes biological sense if one considers the relative roles of recombina-ciently than those in mitotic intermediates, or that once
recognized, meiotic mismatches have a less negative tion in mitosis vs. meiosis. Recombination is responsible for the repair of double-strand breaks (DSBs) generated impact on the overall recombination process.
Alterna-tively, one could hypothesize that meiotic heteroduplex by random DNA damage in mitosis and by nonrandom enzymatic cleavage in meiosis. Although mitotic ectopic is shorter than mitotic heteroduplex and, therefore, less
sequences on homologous chromosomes, intrachromo-somal interactions (both sister chromatid and intrachro-matid) are much more efficient than interchromosomal interactions in mitosis (Fabreet al. 1984;Lichtenand Haber1989; KadykandHartwell 1992; Jinks-Rob-ertsonet al. 1993). It has been argued that
recombina-tion between sister chromatids should be favored over interchromosomal interactions to ensure that mitotic DNA repair occurs with very high fidelity (sister chroma-tids are identical) and also to lower the occurrence of deleterious chromosome rearrangements. We suggest that the very stringent identity requirements imposed by the yeast MMR machinery in mitosis would discourage
Figure6.—MMR indices. The MMR index for a given level nonsister interactions and thereby further strengthen
of substrate identity in a MMR-defective strain (either msh2D the natural bias for sister chromatid interactions. In or pms1D) was calculated by dividing the normalized recombi-meiosis, the bias for recombination between homologs nation rate for the mutant strain by that obtained for the wild-type, MMR-competent strain. The normalized recombination
vs. intrachromosomal interactions is reversed (Haber
rates are the rates obtained in a given genetic background
et al. 1984;Gameet al. 1989;SchwachaandKleckner
divided by the rate for the 100% control substrates in the 1997). This reversal of the bias may be related to
forma-same genetic background. tion of the synaptonemal complex between homologs,
which could serve either to encourage allelic
interac-tions, or to discourage both intrachromosomal inter- combination in a mismatch-dependent manner. Al-though mismatches had a cumulative negative effect on actions and interactions between nonhomologous
chro-mosomes. Because meiotic recombination generally recombination in the presence of the MMR machinery, the increases in the MMR indices eventually plateau. As provides an essential physical link between homologous
chromosomes that ensures their proper disjunction, noted above, this behavior suggests that after a critical number of mismatches has been sensed by the MMR maintaining a high efficiency of meiotic recombination
in the presence of subtle sequence polymorphisms be- machinery, the probability of escaping the antirecombi-nation activity of the MMR proteins is zero and the tween homologs is crucial. We suggest that the relaxed
identity requirements observed here with very small presence of additional mismatches is inconsequential. Although the plateau is not evident with substrates hav-amounts of sequence divergence may aid in promoting
the requisite nonsister interactions in meiosis. Alterna- ing ,94% identity (21 mismatches), we have no sub-strates in the 4-to-21 mismatch range so the exact tively, the differential effect of low levels of sequence
divergence could reflect a switch from mismatch-trig- point(s) where the plateau occurs is not clear. It should be noted that these observations are very similar to those gered heteroduplex rejection in mitosis to
mismatch-triggered heteroduplex repair in meiosis. reported previously byDattaet al. (1997).
The mitotic MMR index is greater than the meiotic Recombination rates between mismatch-containing
substrates in MMR-defective cells: The effect of se- index for every pair of substrates examined in both the
msh2Dand the pms1Dstrains. This observation suggests quence divergence on mitotic vs. meiotic
recombina-tion was examined in two different types of MMR-defec- that the maximal antirecombination activity of the yeast MMR machinery is more efficient in mitosis than in tive diploid strains: msh2Dand pms1D. Whereas strains
deleted for MSH2 (the MutS homolog essential for all meiosis. It may be, for example, that, regardless of the number of mismatches present, 5% of all meiotic het-mismatch repair) should have no het-mismatch binding
activity, in vitro studies indicate that mismatch recogni- eroduplexes “escape” the antirecombination activity of the MMR machinery, whereas only 1–2% of all mitotic tion can occur in the absence of the MutL homologs
Pms1p and Mlh1p (Habrakenet al. 1997). To delineate heteroduplexes escape this activity. Alternatively, a larger percentage of meiotic recombinants may be pro-the antirecombination role of pro-the MMR machinery
(fac-tors other than the MMR machinery may affect recombi- duced through a mechanism that does not involve ex-tensive heteroduplex formation. Gap repair, for exam-nation in a mismatch-dependent manner), an “MMR
index” was calculated for each pair of substrates. The ple, does not involve extensive heteroduplex formation. Another example of such a mechanism has been pro-MMR index is defined here as the ratio of normalized
recombination rate measured in the msh2D or pms1D posed by Resnick and colleagues (Porter et al. 1996)
and involves the production of recombination interme-strain to that measured in the wild-type,
MMR-compe-tent strain. As shown in Figure 6, both the msh2Dand diates by replicative extension of an invading 39 end (thus generating true homoduplex) rather than by the pms1Dmitotic and meiotic MMR indices increased
initially with increasing sequence divergence, demon- continued assimilation of the (mismatched) invading strand.
re-We previously reported that msh2D strains exhibit while the more distal intervals exhibited a deficit of endpoints. A similar, but more pronounced, pattern of higher levels of mitotic recombination between
di-verged substrates than do isogenic pms1Dstrains (Datta endpoint distribution was observed previously using one of the wild-type haploid parents of the diploid used in
et al. 1996). The data summarized in Figures 5 and 6
confirm the mitotic observation and demonstrate that this study (Chenand Jinks-Robertson 1998). In the earlier study, we systematically addressed possible expla-meiotic recombination behaves similarly. The
normal-ized values of mitotic and meiotic recombination be- nations for the endpoint distribution by altering the substrates in defined ways. Most notably, reversal of the tween diverged substrates were uniformly higher in a
msh2Dbackground than in a pms1Dbackground (Figure orientations of both substrates with respect to the invert-ible HIS3::intron segment reversed the distribution of 5) and the MMR indices were consistently larger for the
msh2D strains than for the pms1D strains (Figure 6). endpoints so that intervals proximal (and formally dis-tal) to the invertible HIS3::intron segment still contained Thus, although the yeast MutL homolog Pms1p is
appar-ently indispensable for the repair of DNA replication an excess of endpoints. We concluded that the proxim-ity of an interval to the HIS3::intron segment was the errors (reviewed inCrouse 1998), it is not absolutely
required for the antirecombination activity of the MMR primary determinant of the proportion of endpoints likely to be located in that interval, regardless of the machinery in either mitosis or meiosis. This is not to
imply that the yeast MutL homologs have no antirecom- length or sequence of the interval. Because the same intron-based system was used in this study, we suggest bination role, but rather that some inhibition of
recom-bination occurs in their absence. We suggest that mis- that the distributions of mitotic and meiotic conversion tract endpoints in a wild-type strain (Figure 3, A and B, match binding by MutS homologs in the absence of
MutL homologs may be sufficient to impede recombina- respectively) similarly reflect the relative proximity of intervals to the invertible HIS3::intron segment. In con-tion, whereas such binding is apparently unable to
trig-ger repair of DNA replication errors. The specific re- trast to the results obtained with an MMR-competent strain, the distributions of mitotic and meiotic conver-quirement of the MutL homologs for the repair of
replication errors may be related to their interactions sion tracts in a msh2Dstrain lacked an obvious clustering of endpoints (compare Figure 3A to 3C, and 3B to with proliferating cell nuclear antigen (PCNA;Johnson
et al. 1996;Umaret al. 1996), which have been specu- 3D). A similar observation was made by us using both a haploid msh2 msh3 strain and a haploid pms1 strain lated to link MMR directly to the process of DNA
replica-tion. (ChenandJinks-Robertson 1998).
We argued previously (ChenandJinks-Robertson For both the msh2Dand pms1Dstrains, meiotic
recom-bination was more negatively impacted by sequence di- 1998) that a sister chromatid conversion model could more readily account for the observed conversion tract vergence than was mitotic recombination (Figure 5).
The slightly steeper slopes for the plots of the meiotic endpoint distributions than could an intrachromatid crossover model (Figure 4). According to the sister
chro-vs. mitotic data suggest that the MEPS for meiotic
re-combination may be longer than that for mitotic recom- matid conversion model, each recombination event that successfully reorients the invertible HIS3::intron seg-bination. That is, a greater length of perfect identity
may be required to successfully initiate meiotic recom- ment must initiate within substrates on one side of the invertible segment, extend through the invertible seg-bination than to initiate mitotic recomseg-bination. Once
initiation occurs, however, mismatches that become in- ment, and resolve within the substrates on the other side of the invertible segment. The endpoint clustering corporated into a heteroduplex intermediate would
be-come potential targets of the MMR-associated antire- evident in a wild-type strain thus reflects a bidirectional gene conversion gradient that extends in both direc-combination activity.
Gene conversion tracts:Recombination products de- tions from the selected site of conversion (the invertible segment). Using the assumption of sister chromatid con-rived using the 94%-identical substrates in both
wild-type and msh2D strains were sequenced to determine version, the lengths of mitotic and meiotic gene conver-sion tracts were calculated for events occurring in both the endpoints and estimate the lengths of mitotic and
meiotic conversion tracts (Figure 3 and Table 4, respec- wild-type and msh2Dstrains (Table 4). As predicted by the endpoint distributions, these analyses indicated that tively). It is assumed in analyses of this sort that
conver-sion tracts are accurate representations of the extent mitotic and meiotic tracts were longer in a msh2Dstrain than in a wild-type strain, although the length difference of heteroduplex formed in MMR-competent cells. We
acknowledge the possibility, however, that a conversion was only significant for meiotic tracts.
The conversion tract data strongly implicate the MMR tract border may not always correspond to the extent
of the underlying heteroduplex intermediate, but machinery in determining the distribution of conver-sion tract endpoints in recombination events involving rather may reflect the border of mismatch correction.
The most notable feature of conversion tracts in the diverged sequences. We suggest that these data are rele-vant to the antirecombination activity of MMR proteins wild-type strain is that intervals close to the invertible
tar-Borts, R. H.,andJ. E. Haber,1989 Length and distribution of
geted by the MMR machinery. The recombination
prod-meiotic gene conversion tracts and crossovers in Saccharomyces
ucts observed in a wild-type strain presumably are those cerevisiae. Genetics 123: 69–80.
that escaped the antirecombination activity of the MMR Borts, R. H., W.-Y. Leung, W. Kramer, B. Kramer, M. Williamson et al., 1990 Mismatch repair-induced meiotic recombination
re-machinery, but nevertheless may provide useful insight
quires PMS1 gene product. Genetics 124: 573–584.
into the mechanism of antirecombination. We suggest Chambers, S., N. Hunter, E. J. LouisandR. H. Borts,1996 The that the gradient of conversion tract endpoints observed mismatch repair system reduces meiotic homeologous recombi-nation and stimulates recombirecombi-nation-dependent chromosome
in wild-type cells reflects increasing obstruction of
re-loss. Mol. Cell. Biol. 16: 6110–6120.
combination by the MMR machinery as the hetero- Chen, W.,andS. Jinks-Robertson,1998 Mismatch repair proteins duplex formation progresses and more and more mis- regulate heteroduplex formation during mitotic recombination
in yeast. Mol. Cell. Biol. 18: 6525–6537.
matches are incorporated. One possibility is that
Claverys, J.-P.,andS. A. Lacks,1986 Heteroduplex
deoxyribonu-mismatches are recognized by the MMR machinery dur- cleic acid base mismatch repair in bacteria. Microbiol. Rev. 50: ing or immediately after the formation of heteroduplex 133–165.
Crouse, G. F.,1998 Mismatch repair systems in Saccharomyces
cerevis-DNA. Such recognition might block further extension
iae, pp. 411–448 in DNA Damage and Repair, Volume 1: DNA Repair of the heteroduplex intermediate and thereby trigger
in Prokaryotes and Lower Eukaryotes, edited byJ. A. Nickoloffand
helicase-driven unwinding of the intermediate. M. F. Hoekstra.Humana Press, Totowa, NJ.
Datta, A., A. Adjiri, L. New, G. F. CrouseandS. Jinks-Robertson,
Conclusions: In MMR-competent cells, mitotic
re-1996 Mitotic crossovers between diverged sequences are
regu-combination was impacted more than meiotic
recombi-lated by mismatch repair proteins in Saccharomyces cerevisiae. Mol.
nation by a low level of sequence divergence, whereas Cell. Biol. 16: 1085–1093.
Datta, A., M. Hendrix, M. LipsitchandS. Jinks-Robertson,1997
both types of recombination were similarly impacted by
Dual roles for DNA sequence identity and the mismatch repair
higher levels of divergence. The differential effects of
system in the regulation of mitotic crossing-over in yeast. Proc.
low levels of divergence on recombination were MMR- Natl. Acad. Sci. USA 94: 9757–9762.
Davidow, L. S., andB. Byers,1984 Enhanced gene conversion
dependent and might possibly serve to strengthen the
and postmeiotic segregation in pachytene-arrested Saccharomyces
biases for mitotic intrachromosomal interactions vs.
cerevisiae. Genetics 106: 165–183.
meiotic interchromosomal interactions. In MMR-defec- De Wind, N., M. Dekker, A. Berns, M. RadmanandH. Te Riele, tive cells, meiotic recombination was impacted more by 1995 Inactivation of the mouse Msh2 gene results in mismatch repair deficiency, methylation tolerance, hyperrecombination,
sequence divergence than was mitotic recombination,
and predisposition to cancer. Cell 82: 321–330.
suggesting that the MEPS may be slightly longer for Fabre, F., A. BouletandH. Roman,1984 Gene conversion at differ-meiosis than for mitosis. Recombination rates between ent points in the mitotic cycle of Saccharomyces cerevisiae. Mol.
Gen. Genet. 195: 139–143.
nonidentical sequences were consistently higher in
Game, J. C., K. C. Sitney, V. E. CookandR. K. Mortimer,1989
msh2Dstrains than in pms1Dstrains, indicating that the Use of a ring chromosome and pulsed-field gels to study interho-yeast MutS homologs can exert antirecombination activ- molog recombination, double-strand DNA breaks and
sister-chro-matid exchange in yeast. Genetics 123: 695–713.
ity in the absence of the MutL homolog Pms1p. For both
Haber, J. E., P. C. ThorburnandD. Rogers,1984 Meiotic and
mitotic and meiotic recombination events, low levels of mitotic behavior of dicentric chromosomes in Saccharomyces cere-sequence divergence impeded recombination predomi- visiae. Genetics 106: 185–205.
Habraken, Y., P. Sung, L. PrakashandS. Prakash,1997
Enhance-nantly via action of the MMR machinery whereas higher
ment of MSH2-MSH3-mediated mismatch recognition by the
levels of sequence divergence impeded recombination yeast MLH1-PMS1 complex. Curr. Biol. 7: 790–793.
via action of the MMR machinery plus an additional Harris, S., K. S. RudnickiandJ. E. Haber,1993 Gene conversions and crossing over during homologous and homeologous ectopic
MMR-independent process. This latter process may
re-recombination in Saccharomyces cerevisiae. Genetics 135: 5–16.
flect a requirement for a minimal length of perfect
Hoffman, C. S.,andF. Winston,1987 A ten-minute DNA
prepara-homology (the MEPS) to successfully initiate a recombi- tion from yeast efficiently releases autonomous plasmids for trans-formation of Escherichia coli. Gene 57: 267–272.
nation event.
Hunter, N., S. R. Chambers, E. J. LouisandR. H. Borts,1996
This work was supported by National Institutes of Health grant GM- The mismatch repair system contributes to meiotic sterility in an 38464 (S.J.-R.). W.C. was supported in part by the Graduate Division interspecific yeast hybrid. EMBO J. 15: 1726–1733.
of Biological and Biomedical Sciences and by a National Institutes of Jinks-Robertson, S., M. MichelitchandS. Ramcharan,1993 Sub-strate length requirements for efficient mitotic recombination in Health Medical Scientist Training grant (Emory University, Atlanta,
Saccharomyces cerevisiae. Mol. Cell. Biol. 13: 3937–3950.
GA).
Johnson, R. E., G. K. Kivvali, S. N. Guzder, N. S. Amin, C. Holm et al., 1996 Evidence for involvement of yeast proliferating cell nuclear antigen in DNA mismatch repair. J. Biol. Chem. 271: 27987–27990.
LITERATURE CITED Judd, S. R.,andT. D. Petes,1988 Physical lengths of meiotic and
mitotic gene conversion tracts in Saccharomyces cerevisiae. Genetics
Ahn, B.-Y.,andD. M. Livingston,1986 Mitotic gene conversion
118:401–410. lengths, coconversion patterns, and the incidence of reciprocal
Kadyk, L. C., and L. H. Hartwell,1992 Sister chromatids are
recombination in a Saccharomyces cerevisiae plasmid system. Mol.
preferred over homologs as substrates for recombinational repair Cell. Biol. 6: 3685–3693.
in Saccharomyces cerevisiae. Genetics 132: 387–402.
Alani, E., R. A. G. ReenanandR. D. Kolodner,1994 Interaction
Keeney, S., C. N. GirouxandN. Kleckner,1997 Meiosis-specific
between mismatch repair and genetic recombination in
Saccharo-DNA double-strand breaks are catalyzed by Spo11, a member of
myces cerevisiae. Genetics 137: 19–39.
a widely conserved protein family. Cell 88: 375–384.
Boeke, J. D., J. Trueheart, G. NatsoulisandG. R. Fink,1987
5-flu-Kolodner, R.,1996 Biochemistry and genetics of eukaryotic
mis-oroorotic acid as a selective agent in yeast molecular genetics.