COLLINS, GUY DAVID. Reducing Costs and Optimizing the Timing of Agronomic Inputs for Cotton (Gossypium hirsutum L.) in North Carolina. (Under the direction of Dr. Keith Edmisten).
Cotton (Gossypium hirsutum L.) grown in North Carolina requires intensive management for achieving optimal yields in an early season environment. Increasing production costs require cotton producers to adopt practices that allow yield potential to be reached while reducing input costs or optimizing the timing of agronomic inputs. Six experiments were conducted in North Carolina from 2006 to 2008 to investigate various production
practices that could potentially reduce production costs and to define the optimal timings of agronomic inputs. The first experiment investigated precision application of in-furrow insecticides for cotton planted in a hill-dropped configuration. The second experiment investigated application rates and timings of mepiquat chloride (MC) for cotton grown in conditions that promote excessive vegetative growth. The third experiment investigated the effects of MC applied at various rates and timings on the correlation (regression) between two techniques for measuring light interception and canopy coverage: the light quantum sensor method and the overhead digital imagery method. The fourth experiment investigated the effects of MC applied at physiological cutout, in terms of defoliation, regrowth, maturity, and yield. The fifth experiment investigated the effects of
by
Guy David Collins
A dissertation submitted to the Graduate Faculty of North Carolina State University
in partial fulfillment of the requirements for the Degree of
Doctor of Philosophy
Crop Science
Raleigh, North Carolina
2009
APPROVED BY:
_________________________ ________________________
Dr. Keith Edmisten Dr. Alan York
Chair of the Advisory Committee
___________________________ ________________________
DEDICATION
BIOGRAPHY
Guy David Collins was born on June 11th, 1981 to David and Joan Collins of Pendleton, NC. He grew up on a farm, owned and operated by his grandfather, Guy E. Fisher, where he developed his passion for agriculture and the outdoors. Guy spent the majority of his younger years outdoors, working on the farm whenever possible and enjoying his hobbies of turkey and waterfowl hunting, ATV-riding, and fishing. On the farm, he gained
considerable experience raising peanut, cotton, corn, wheat, and cattle, and was active in the local 4-H program throughout his childhood and adolescence raising sheep and cattle for exhibition. During his high-school years, Guy also worked with a local reputable crop consultant, where his interest in cotton began.
ACKNOWLEDGEMENTS
First and foremost, I would like to express my sincere gratitude to my wife, my family, and friends for their steadfast love and support throughout my graduate education. Without them, I would have never persisted. I would like to sincerely thank Dr. Keith Edmisten for his unselfish guidance, expertise, and friendship. He always took the time to teach me, to challenge me, and to help me develop my skills as a scientist and as a person. Dr. Edmisten afforded me with invaluable opportunities that most other graduate students do not have the pleasure of experiencing, and he taught me so much more than just agronomy. I sincerely appreciate his time and dedication, to which I attribute my success.
I would also like to thank my committee members, Dr. Jack Bacheler, Dr. Randy Wells, and Dr. Alan York, for their sound guidance and advice throughout this degree. I sincerely appreciate the opportunity to work with them, and for their time teaching me their professions, in addition to my own. I will never forget the value of humor and PEP time. My appreciation extends to Dr. Bob Patterson for his inspiration during my
undergraduate career.
abilities. I would never have completed the field work without his help. I would like to thank a former fellow graduate student, Andrew Gardner, as well, for his friendship and support throughout. His friendship undoubtedly helped me achieve this degree. My gratitude also extends to fellow graduate students Ranjit Riar, Gary Hamm, Andrew Hunt, Seth Holt, and Bill Foote for their friendship and assistance with the field work. I will always remember the boll wars that made those long hot days much shorter. Lastly, I would like to thank all the undergraduate assistants who helped with the field work throughout the years, including Neal Bullins, Dustin Simmons, Matt Schmidt, Luke O’Neal, and James Atkins.
Most importantly, I owe tremendous gratitude to my Lord and Savior, Jesus Christ, who gave me the strength and the guidance to work hard and to never compromise my morals. Lastly, I would like to thank Cotton Incorporated and the North Carolina Cotton
TABLE OF CONTENTS
LIST OF TABLES………..………x
LIST OF FIGURES………..………...…….xv
CHAPTER 1
REDUCING AT-PLANTING COSTS IN COTTON PRODUCTION
THROUGH PRECISION APPLICATION OF IN-FURROW
INSECTICIDES IN HILL-DROPPED PLANTING
CONFIGURATIONS...………..1
Abstract………..………2
Introduction………...……….3
Materials and Methods………...…………7
Results and Discussion .………...….……...…..……… 11
Literature Cited………...… 23
CHAPTER 2
DEFINING OPTIMAL APPLICATION RATE AND TIMING OF
MEPIQUAT CHLORIDE FOR COTTON GROWN IN CONDITIONS
THAT PROMOTE EXCESSIVE VEGETATIVE GROWTH…….…………47
Abstract………48
Introduction………..…49
Results and Discussion………55
Literature Cited………...………… 60
CHAPTER 3
THE EFFECTS OF MEPIQUAT CHLORIDE RATE AND
APPLICATION TIMING ON THE REGRESSION OF LIGHT
QUANTUM SENSOR MEASUREMENTS AND OVERHEAD
DIGITAL IMAGERY MEASUREMENTS OF CANOPY
CLOSURE…...65
Abstract………66
Introduction………..…67
Materials and Methods……….………70
Results and Discussion………73
Literature Cited………78
CHAPTER 4
THE EFFECTS OF MEPIQUAT CHLORIDE APPLIED TO COTTON
AT PHYSIOLOGICAL CUTOUT……….……...86
Abstract………87
Introduction………..…88
Materials and Methods……….………92
Results and Discussion………96
CHAPTER 5
THE EFFECTS OF PRECONDITIONING DEFOLIATION TO
COTTON WITH DENSE CANOPY FOLIAGE………...………...114
Abstract………..…………115
Introduction………116
Materials and Methods………...………119
Results and Discussion………..……121
Literature Cited………..126
CHAPTER 6
THE EFFECTS OF ETHEPHON RATE AND DEFOLIATION
TIMING ON HARVEST DATE, LINT YIELD, AND FIBER
QUALITY OF COTTON………..……….………...………....133
Abstract………..……134
Introduction………135
Materials and Methods………...……138
Results and Discussion………..……142
LIST OF TABLES
CHAPTER 1
Table 1.1 Aldicarb rate effect on the number of thrips per 5 plants at
3, 4, and 5 weeks after planting in 2007 and 2008………26
Table 1.2 Aldicarb rate effect on plant dry weight at 3, 4, and 5 weeks
after planting and number of nematodes per plot in 2007 and 2008….…27
Table 1.3 Aldicarb rate effect on growth parameters and lint yield in
2007 and 2008….………...28
Table 1.4 Aldicarb rate effect on boll distribution in 2007 and 2008………....29
Table 1.5 Aldicarb rate effect on fiber quality parameters in 2007 and 2008…...30
Table 1.6 Aldicarb band length effect on the number of thrips per 5
plants at 3, 4, and 5 weeks after planting in 2007 and 2008…………..…31
Table 1.7 Aldicarb band length effect on plant dry weight, and nematodes in 2007 and 2008………...………..32
Table 1.8 Aldicarb band length effect on growth parameters and
lint yield in 2007 and 2008………..…………..…33
Table 1.9 Aldicarb band length effect on boll distribution in 2007 and 2008……...34
Table 1.10 Aldicarb rate effect on fiber quality parameters in 2007 and 2008…...…35
Table 1.11 Aldicarb rate and band length interaction effect on growth
parameters in 2007 and 2008………..…...36
Table 1.12 Insecticide treatment effect on the number of thrips
per 5 plants at 3 weeks after planting in 2007 and 2008…...………….…37
Table 1.13 Insecticide treatment effect on the number of thrips
Table 1.14 Insecticide treatment effect on the number of thrips
per 5 plants at 5 weeks after planting in 2007 and 2008…...………….…39
Table 1.15 Insecticide treatment effect on plant dry weight at
3, 4, and 5 weeks after planting in 2007 and 2008…...……….…40
Table 1.16 Insecticide treatment effect on growth parameters and
lint yield in 2007 and 2008…...……….…41
Table 1.17 Insecticide treatment effect on nodes per plant in 2007 and 2008….……42
Table 1.18 Insecticide treatment effect on boll distribution in 2007 and 2008……...43
Table 1.19 Insecticide treatment effect on growth parameters and
nematodes in 2007 and 2008………..44
Table 1.20 Insecticide treatment effect on fiber quality parameters in
2007 and 2008………..………...…...45
Table 1.21 Costs and percent savings relative to most-expensive treatment assuming current prices of aldicarb = $6.61 per kg,
Avicta® = $28 per hectare for a hill-dropped system consisting
of 3 seeds per hill, with hills spaced 40.64 cm apart………...…………..46
CHAPTER 2
Table 2.1 Effects of mepiquat chloride (MC) application strategies and rates on plant height, total nodes, nodes above white flower,
and total bolls per plant in 2007 and 2008………...………..62
Table 2.2 Effects of mepiquat chloride (MC) application strategies and
rates on boll distribution in 2007 and 2008…..…..…….………...63
Table 2.3 Effects of mepiquat chloride (MC) application strategies and
CHAPTER 3
Table 3.1 Contrast analyses of the effects of mepiquat chloride (MC) application strategy and rate on the regression slope of photosynthetically active radiation interception versus canopy closure as measured digitally at an average of 42 days after planting. No MC was applied to any treatment
prior to this date………...…...80
Table 3.2 Second of five dates for contrast analyses of the effects
of mepiquat chloride (MC) application strategy and rate on the regression slope of photosynthetically active radiation interception versus canopy closure as measured digitally at an average of 52 days after planting. The first MC treatments were applied to the
modified early bloom treatments prior to this date.……….……...81
Table 3.3 Third of five dates for contrast analyses of the effects
of mepiquat chloride (MC) application strategy and rate on the regression slope of photosynthetically active radiation interception versus canopy closure as measured digitally at 72
days after planting. All MC treatments were applied to the modified early bloom and the early bloom treatments, prior to this
date.………...………...…………...…...82
Table 3.4 Fourth of five dates for contrast analyses of the effects
of mepiquat chloride (MC) application strategy and rate on the regression slope of photosynthetically active radiation interception versus canopy closure as measured digitally at an average of
83 days after planting………...….…….83
Table 3.5 Fifth of five dates for contrast analyses of the effects
of mepiquat chloride (MC) application strategy and rate on the regression slope of photosynthetically active radiation interception versus canopy closure as measured digitally at an average of
98 days after planting……….84
CHAPTER 4
Table 4.1 Effect of mepiquat chloride applied at early bloom on growth
Table 4.2 Effect of mepiquat chloride applied at early bloom on boll
distribution in 2007 and 2008……….….…104
Table 4.3 Effect of early bloom and cutout mepiquat chloride interaction on the number of bolls on nodes 17 through 19 in 2007 and
2008……….…….105
Table 4.4 Effect of mepiquat chloride applied at early bloom on percent open bolls, nodes above cracked boll, percent defoliation,
and percent dessication in 2007 and 2008………..….106
Table 4.5 Effect of mepiquat chloride applied at early bloom on terminal and basal regrowth, and basal regrowth-to-height ratio in
2007 and 2008………...………...107
Table 4.6 Effect of mepiquat chloride applied at early bloom on lint percentage, lint yield, and fiber quality parameters in 2007
and 2008………...……….…...108
Table 4.7 Effect of mepiquat chloride applied at cutout on growth
characteristics in 2007 and 2008………..……....……109
Table 4.8 Effect of mepiquat chloride applied at cutout on boll
distribution in 2007 and 2008………..……….…...110
Table 4.9 Effect of mepiquat chloride applied at cutout on percent open bolls, nodes above cracked boll, and percent defoliation
in 2007 and 2008………..……….………..…111
Table 4.10 Effect of mepiquat chloride applied at cutout on terminal
and basal regrowth in 2007 and 2008………....………..112
Table 4.11 Effect of mepiquat chloride applied at cutout on lint percentage,
lint yield, and fiber quality parameters in 2007 and 2008………...……113
CHAPTER 5
Table 5.1 Effects of preconditioning defoliation treatment on percent
Table 5.2 Effects of preconditioning defoliation treatment on percent defoliation and percent dessication at 7 days after the standard defoliation application or 14 days after preconditioning defoliation
treatment in 2007 and 2008………...………....……..…129
Table 5.3 Effects of preconditioning defoliation treatment on percent defoliation and percent dessication at 14 days after the standard defoliation application or 21 days after preconditioning defoliation
treatment, and percent regrowth in 2007 and 2008……...…....……..…130
Table 5.4 Effects of preconditioning defoliation treatment on fiber
uniformity in 2007 and 2008……...………..……..…131
Table 5.5 Effects of preconditioning defoliation treatment on percent dessication on the day of standard defoliation application, and at 7 days after the standard defoliation application, and percent defoliation at 14 days after the standard defoliation application in 2008 with two additional treatments of pyraflufen
ethyl……...………..……….………..…..132
CHAPTER 6
Table 6.1 Effects of mepiquat chloride by defoliation timing by ethephon
rate interaction on cotton lint yield in 2006, 2007, and 2008………..…152
Table 6.2 Effects of mepiquat chloride by harvest timing
interaction on lint percentage in 2006, 2007, and 2008………….…..…153
Table 6.3 Effects of defoliation timing by harvest timing interaction on lint
percentage in 2006, 2007, and 2008………..…...154
Table 6.4 Effects of defoliation timing by harvest timing interaction on
micronaire in 2006, 2007, and 2008………..…...155
Table 6.5 Effects of mepiquat chloride by harvest timing
interaction on micronaire in 2006, 2007, and 2008………….…..…...156
Table 6.6 Effects of defoliation timing by harvest timing interaction on
Table 6.7 Effects of mepiquat chloride by harvest timing by ethephon rate interaction on upper half mean fiber length and fiber strength
in 2006, 2007, and 2008………...158
Table 6.8 Effects of defoliation timing by harvest timing by ethephon rate
interaction on fiber strength in 2006, 2007, and 2008………..……...…159
Table 6.9 Effects of mepiquat chloride by defoliation timing
by ethephon rate interaction on uniformity index in 2006, 2007,
and 2008……….…...160
Table 6.10 Effects of defoliation timing by ethephon rate interaction on percent defoliation in 2006, 2007, and 2008……….…...161
Table 6.11 Effects of mepiquat chloride on growth characteristics
in 2006, 2007, and 2008………....…...162
Table 6.12 Effects of mepiquat chloride on boll production, retention,
and distribution in 2006, 2007, and 2008……….…..…...163
LIST OF FIGURES
CHAPTER 3
Figure 3.1. Regression of Light Quantum Sensor and Overhead Digital Imagery
Reducing At-Planting Costs in Cotton Production Through Precision
Application of In-Furrow Insecticides in Hill-Dropped Planting
Configurations
G.D. Collins, K.L. Edmisten, A.C. York, R. Wells, and J.S. Bacheler1
1Graduate Research Assistant, Professor, Professor Emeritus, and Professor of the
Department of Crop Science, and Professor of the Department of Entomology
Abstract
Collins, Guy D. Reducing At-Planting Costs in Cotton Production Through Precision
Application of In-Furrow Insecticides in Hill-Dropped Planting Configurations (Under
the direction of Dr. Keith Edmisten).
At-planting costs (seed and insecticides) currently represent a significant portion of the
total production costs for cotton producers. Two potential methods for reducing
at-planting costs include hill-dropped at-planting techniques and precision application of
insecticides directly to seed hills. Experiments were conducted during 2007 and 2008 to
investigate the effects of precision application of aldicarb insecticide applied in-furrow,
to determine the optimal band length for precision application, and to compare the thrips
control efficacy and costs of these systems to a modern seed treatment and a subsequent
foliar spray for thrips. Treatments were placed into a factorial arrangement of two
in-furrow granular aldicarb rates {3.7 and 7.4 kg a.i. ha-1} and three band lengths {solid, 7.62 and 15.24 cm} surrounding seed hills. Four additional treatments included Avicta
Complete Pac® seed treatment alone, Avicta Complete Pac® seed treatment followed by a
foliar application of Orthene 97® targeted at three weeks after planting, a foliar application of Orthene 97® targeted at three weeks after planting with no prior insect control, and a non-treated control. Aldicarb rate and band length had little effect on
application system for hill-dropped planting configurations can significantly reduce costs
while maintaining optimal plant growth and yield. The mean separation analysis of the
additional treatments revealed that Avicta® seed treatment followed by a foliar
application of Orthene® provides similar protection to that of aldicarb, as opposed to a seed treatment alone, but the costs associated with the precision application of aldicarb
via the greatly reduced rates may be significantly less than with seed treatments.
Introduction
The at-planting costs of cottonseed have drastically risen since the advent of Roundup
Ready® and Bollgard® technology and their subsequent wide-spread adoption. The
development of other modern herbicide- and insect-resistant technologies has driven
these costs up even further. Recent cotton cultivars are often marketed with multiple
transgenic technologies or ‘stacked’ gene packages. As a result, the costs of cottonseed
currently represent a significant portion of the total production costs for growers. Cotton
producers therefore attempt to reduce the at-planting costs of cotton through several
techniques. Siebert et al. (2006) suggested that costs could be reduced by decreasing
seeding rates, provided that plants stands are uniform and managed properly. Another
possible technique is planting seed in a hill-dropped formation as opposed to a drilled
formation. A hill-dropped planting formation involves planting multiple seed, or clusters
of seed, in a single location called a hill. Hills are then separated by a predetermined
dropped planting systems were first implemented to overcome soil crusting and improve
seedling emergence (Van Duyn et al., 2002), although preliminary data in North Carolina
has shown that hill-dropping can reduce seed costs while maintaining adequate yields
(Edmisten, 2005). The effects of various plant populations and hill-dropped planting
configurations have both been previously evaluated for cotton. Siebert et al. (2006)
reported that maximum yield was achieved in a hill-dropped system consisting of three
plants per hill with hills spaced 20 cm apart, although yield was only reduced when hills
were spaced 60 cm apart. Bridge et al. (1973) reported that hill-dropping had no effect
on yield when compared to drill planting whereas plant populations did affect yield.
They found that highest yields were achieved in two out of three years using a
hill-dropped system consisting of five seeds per hill with 38-cm hill spacings or a
conventional planting method with a plant spacing of 7.6 cm (Bridge et al., 1973).
Hawkins and Peacock (1971) reported that the number of plants per hill had no effect on
yield, however a hill spacing of 60 cm reduced yield compared to hill spacings of 20 and
40 cm. In another experiment investigating plant populations in both hill-dropped and
drilled systems, Kittock (1974) reported no difference in yield due to planting system
over a three-year period.
In addition to seed, at-planting insecticides may also contribute significantly to the total
planting costs. Therefore, techniques that reduce these costs would be desirable.
2007) or seed treatments (Lopez et al. 2008) are commonly used to control thrips on
seedling cotton. Thrips, particularly those belonging to the Frankliniella genus, are small
insects (Bauer and Roof, 2004; Mailhot et al., 2007) that migrate into cotton from wild
hosts (Greene et al., 2007) and often cause damage to cotton early in the season (Bauer
and Roof, 2004; Mailhot et al., 2007). Thrips typically cause spotty discoloration
(Mailhot et al., 2007), deformation (Johnson et al., 2001) or crinkling (Lopez et al. 2008)
of young leaves, stunted growth, and delayed fruit initiation (Stewart et al., 2007) which
can result in delayed maturity and potentially reduced yield (Greene et al., 2007; Stewart
et al., 2007). Various thrips control methods have been evaluated. Granular aldicarb
{2-methyl-2-(methylthio) propionaldehyde O-(methylcarbamoyl) oxime} (Temik® 15G,
Bayer Crop Science, Research Triangle Park N.C.) applied in-furrow has been reported to
reduce thrips injury (Hopkins et al., 2002) and increase lint yield (Bauer and Roof, 2004;
Johnson et al., 2001) compared to no-insect-control methods. The use of seed treatment
insecticides such as imidacloprid
{1-[(6-Chloro-3-pyridinyl)methyl]-N-nitro-2-imidazolidinimine} (Gaucho® Grande, Bayer Crop Science, Research Triangle Park
N.C.) and thiamethoxam (Cruiser® 5FS, Synenta Crop Protection, Greensboro N.C.) have
also been reported to be effective in managing thrips and maintaining yield (Furr et al.
1998; Lentz et al. 2003). Herbert et al. (2007) reported that performance of seed
treatments was equal to that of in-furrow insecticides in terms of thrips control and yield.
However, in some instances, aldicarb has been reported to outperform some of the seed
shorter period of thrips control and to promote spider mite infestations, although yields
were similar to that with aldicarb (Van Duyn et al., 1998). Aldicarb has also been proven
to be an effective nematicide (Zimet et al., 2002). Therefore, aldicarb may be preferred
for various reasons and its use is still warranted, while others enjoy the simplicity of
handling seed treatments.
Current planters are only equipped to deliver in-furrow granular insecticides in a solid
continuous band. This does not pose a problem for the use of seed treatment insecticides
in a hill-dropped system, however granular insecticide that is applied between the seed
hills may be essentially wasted or unnecessary. Therefore, development of accurate
planter technology, capable of precision placement of aldicarb directly to seed hills, may
allow growers to further reduce at-planting costs. Van Duyn et al. (2002) found that
precision placement of aldicarb in a hill-dropped system reduced the total amount of
insecticide applied per acre and was equally effective, or superior, to a solid continuous
band of aldicarb. These researchers also suggested that the insecticide and seed should
be within a 5.08-cm proximity of each other in order to maintain its effectiveness (Van
Duyn et al. 2002). Lohmeyer et al. (2001; 2002) also reported similar yields between
precision placement of aldicarb and a solid continuous band.
Bridge et al. (1973) suggested that competition may be greater between plants when
Therefore, aldicarb rate may be more important when planting in a hill-dropped
formation, as higher aldicarb rates may be necessary for hill-dropped planting systems in
order to achieve optimal thrips control. Also, due to the competitiveness between
seedlings within hills, it is also necessary to investigate the length of insecticide bands
surrounding seed hills so that uptake and efficacy is not compromised.
The objective of this experiment was to evaluate various aldicarb application rates and
band lengths surrounding seed hills when cottonseed was planted in a hill-dropped
formation and to compare these application strategies, on a cost and efficacy basis, to
modern seed treatments and foliar insecticides used for thrips control.
Materials and Methods
Experiments were conducted during 2007 and 2008 on a Norfolk fine sandy loam soil
(fine-loamy, kaolinitic, thermic, Typic Kandiudult) at an on-farm site in Duplin County
near Beulaville, NC, and during 2008 on a Norfolk loamy sand soil at Central Crops
Research Station (CCRS) near Clayton, NC. DP 455 BGRR®, an early to medium
maturing cultivar, was planted in a hill-dropped configuration consisting of three seed per
hill with hills spaced 41 cm apart on 3 May 2007 and 6 May 2008 at Duplin County and
14 May 2008 at CCRS using a two-row vacuum planter equipped with hill-dropping seed
plates. Plots contained four rows 12.2 m long and spaced 97 cm apart. Treatments
kg a.i. ha-1} and three band lengths {solid, 7.62 and 15.24 cm} surrounding seed hills to determine the optimal insecticide rate and band length for optimal thrips control for
cotton grown in a hill-dropped configuration. The amount of granular insecticide,
applied in the 7.62- and 15.24-cm bands, was adjusted to equal the equivalent rate per
unit furrow area of the amount applied in a solid band. Therefore, the total amount
applied per ha was reduced when applied in bands, although the rate applied per unit
furrow area remained the same. Four additional treatments included a seed treatment
insecticide alone, a seed treatment insecticide followed by a foliar insecticide application
targeted at three weeks after planting, a foliar insecticide application targeted at three
weeks after planting with no prior insect control, and a non-treated control. Sub-samples
of seed, weighing 2.27 kg, were removed from the same bag and sent to Syngenta Crop
Protection to be treated with abamectin plus thiamethoxam (Avicta Complete Pac®,
Syngenta Crop Protection, Greensboro N.C.) seed treatment to avoid confounding effects
of germination or vigor between different seed lots. Treatments were arranged in a
randomized complete block design replicated four times. All other production and pest
management practices were conducted according to the North Carolina Cooperative
Extension recommendations for that region (Bacheler, 2009; Crozier, 2009; Edmisten,
2009a; 2009b; Koenning, 2009; York and Culpepper, 2009).
Prior to planting, one soil sample per replicate was collected for nematode analysis. The
at-planting insecticide treatments were applied to avoid confounding effects of soil
moisture or furrow closure between treatments. The factorial treatments received
granular aldicarb insecticide at the respective rates and band lengths at planting. The
planter was calibrated and used to deliver both aldicarb rates applied in a solid band.
Small plastic spoons were semi-melted using flame heat and manually shaped to hold the
amount of aldicarb required to consistently deliver the appropriate rate of aldicarb to the
predetermined band length for one seed hill. Welding rods where cut to both 7.62 and
15.24 cm and used as guides for the manual application of aldicarb in bands. The
packing wheel of a small push-type planter was used to cover the seed furrows for all
treatments upon completion of all at-planting insecticide applications. At three weeks
after planting, treatments requiring foliar insecticide applications received acephate
{O,S-dimethyl acetylphosphoramidothioate} (Orthene 97®, Amvac Chemical Corporation, Los
Angeles CA) at 0.28 kg a.i. ha-1, using a CO
2-pressurized backpack sprayer equipped
with a single regular hollow-cone nozzle, and calibrated to deliver 74.8 L ha-1. At approximately three, four, and five weeks after planting, a razor blade was used to
remove five randomly selected plants per plot at the soil level. These plants were gently
and immediately placed into glass jars containing a solution of liquid soap and water to
reduce the surface tension of the water preventing the thrips from floating. On the same
day, the soap-water solution was washed through a 270-mesh sieve, containing 0.053 mm
openings, using a TeeJet® XR 80-02 flat-fan nozzle (TeeJet Technologies, Wheaton, IL)
containing 70% alcohol solution. The plants were allowed to air-dry for one week and
were then weighed using an electronic digital scale. Adult and immature thrips were later
counted by observing the alcohol solution under a Bausch and Lomb® stereo zoom
microscope (Bausch and Lomb®, Rochester NY) using small plastic Petri dishes
containing 6.35 mm square grids and a finger-operated mechanical counter.
Plant heights and nodes above white flower (NAWF) were recorded for six plants in the
center two rows of each plot in early August of each year. Prior to defoliation, percent
open boll measurements were recorded on a randomly chosen 1-m section of row within
each plot. Plant height, the number of total and sympodial nodes, the number of total and
sympodial bolls, retention of sympodial bolls, and mapping of fruit in all node zones
were collected for six plants per plot prior to harvest. Prior to defoliation, two soil
samples were collected from the soil directly under a seed hill in each plot using a regular
soil probe and sent to the North Carolina Department of Agriculture – Agronomic
Division for nematode analysis.
The center two rows of each plot were harvested with a two-row spindle picker on 12
October 2007 and 16 October 2008 at Duplin County, and 21 October 2008 at CCRS.
Seedcotton weights for each plot were recorded and sub-samples were collected for high
volume instrumentation analysis and lint percentage. Harvest data included lint yield,
Data were subjected to analysis of variance using the general linear model in SAS version
9.1.3 (SAS Institute, Cary NC). Means of significant main effects and interactions were
separated using Fisher’s Protected LSD at p<0.05. To preserve the factorial arrangement
of the insecticide rates and band lengths and to provide relevance to a “no insecticide”
treatment, all parameters were analyzed as percent of the non-treated control. In
instances when there was no insecticide rate by band length interaction, the remaining
treatments were compared using a mean separation procedure to the two granular
insecticide rates applied in a solid band.
Results and Discussion
Interactions between aldicarb rate and band length only occurred for three measured
parameters, therefore main effects are primarily discussed. Main effects of aldicarb rate
and band length were analyzed and are presented as percent of the nontreated control
(NTC). In the instances that there were no interactions between aldicarb rate and band
length, both aldicarb rates applied in a solid band were compared to the additional
treatments via a mean separation procedure. Interactions between main effects and years
were infrequent, but are discussed accordingly.
Table 1.1 illustrates the effects of aldicarb rate on thrips during the early season. Aldicarb
per 5 plants at both 3 and 4 weeks after planting (WAP), and no effect on the number of
adult and total thrips per 5 plants at 5 WAP. However, the number of immature thrips
per plant was reduced 22.9 % when the high aldicarb rate (7.4 kg ha-1) was used, indicating that thrips populations established and reproduced on cotton when the low
aldicarb rate was used. Table 1.2 illustrates the effects of aldicarb rate on early season
plant dry weight and nematodes. Plant dry weight at 3 WAP was unaffected by aldicarb
rate, although the numeric trend was different between Duplin County in both years and
Clayton in 2008, as well as plant dry weight at 4 WAP at all locations. Plant dry weight
at 5 WAP was unaffected by aldicarb rate in 2008, whereas dry weight was 18.5 % higher
when the high aldicarb rate was used in 2007, indicating some mild injury or stunting
resulting from thrips injury in this year. In the nematode analysis of soil samples, the
only species that was potentially harmful to cotton and present in significant numbers
was stubby root nematodes. The number of stubby root nematodes per plot sample was
unaffected by aldicarb rate, although the total number of all nematode species (stubby
root plus all non-harmful species) per plot sample was unexpectedly 13 % higher when
the high aldicarb rate was used. Table 1.3 illustrates the effects of aldicarb rate on
various growth parameters and yield. Aldicarb rate had no effect on NAWF, percent
open bolls (%OB), plant height, the number of mainstem nodes, the node of first
sympodia, and lint yield. These effects suggest that the low aldicarb rate suffices in
terms of thrips control, with regard to maturity, growth parameters and yield. Table 1.4
on the number of sympodial and total bolls per plant, and retention of sympodial bolls.
Boll distribution in node zones 4 through 7, 8 through 10, and 17 through 19 was
unaffected by aldicarb rate, although the numeric trend for bolls on nodes 4 through 7
was different between Duplin County in both years, and Clayton in 2008. These effects
suggest that the low aldicarb rate suffices in terms of thrips control, with regard to
maturity, growth parameters and yield. Micronaire was 0.5 % higher when the high
aldicarb rate was used, however no other fiber quality parameter was influenced by
aldicarb rate (Table 1.5).
Aldicarb band length had no effect on the number of adult, immature, or total thrips per 5
plants at both 3 and 5 WAP, and the number of adult and immature thrips per 5 plants at
4 WAP (Table 1.6). However, the total number of thrips per 5 plants at 4 WAP was 61 %
higher when the short (7.62-cm band) was used compared to the solid band, although the
number of thrips associated with the long (15.24-cm band) was not different from either
the solid or the short bands. Plant dry weight at 3 and 4 WAP was unaffected by aldicarb
band length, however dry weight at 5 WAP was 21.6 % less when the short band was
used compared to the solid band (Table 1.7). Although these effects were miniscule in
these environments, it could indicate that the short band may be insufficient in heavy
thrips pressure or cooler, drier environments. Plant dry weight at 5 WAP associated with
the long band was no different than that of both the solid and short bands. Stubby Root
(Table 1.7). Aldicarb band length had no effect on NAWF, %OB, plant height, the
number of mainstem nodes, the node of first sympodia, and lint yield (Table 1.8),
indicating that the short band suffices in providing sufficient thrips control, regardless of
the early-season effects. Table 1.9 illustrates the effects of band length on boll
distribution. Band length had no effect the number of sympodial and total bolls per plant
at all locations, and retention of sympodial bolls at Duplin County in both years. At
Clayton in 2008, the short band unexplainably resulted in 13.2 and 19.1 greater
sympodial retention when compared to the solid and the long band respectively. The
number of bolls on nodes 4 through 7 was unaffected by band length at any location,
although the numeric trend was different between Duplin County in both years and
Clayton in 2008. The number of bolls on node zones 8 through 10, and 17 through 19
were unaffected by band length at all locations and years. Band length also had no effect
on any fiber quality parameter at any location, although the numeric trend for fiber
strength was different between Duplin County in both years and Clayton in 2008 (Table
1.10).
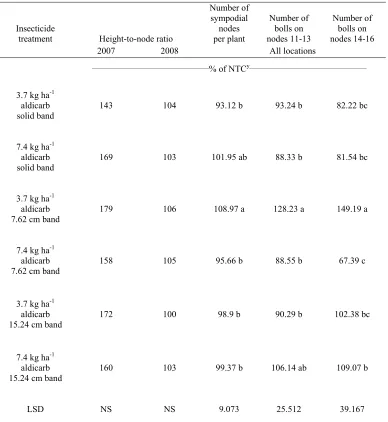
Interactions between aldicarb rate and band length were observed for height-to-node
ratio, the number of sympodial nodes, and the number of bolls on nodes 11 through 13
and 14 through 16 (Table 1.11). This interaction had no effect on height-to-node ratio in
either year, although the numeric trend was different between years. Data suggested that
of bolls on nodes 11 through 13 resulting from the low aldicarb rate applied in the short
band was significantly higher than all treatments except for the high aldicarb rate applied
in the long band. The number of bolls on nodes 14 through 16 resulting from the low
aldicarb rate applied in the short band was significantly higher than all other treatments.
The high aldicarb rate applied in the long band resulted in 38.2 percent more bolls in this
node zone when compared to the high aldicarb rate applied in the short band. The
number of sympodial nodes per plant associated with the low aldicarb rate (3.7 kg ha-1) applied in the short band was significantly higher than all other treatments except the
high aldicarb rate applied in the solid band. The number of sympodial nodes per plant
was not different among any of the remaining treatments. These results indicate that the
low aldicarb rate applied in the short band can result in greater thrips injury, thus a delay
in maturity, as supported by the increase in total nodes and the proportion of fruit set at
the two highest node zones. There were no other significant differences between
treatments for this parameter.
As previously mentioned, a mean separation procedure was used to compare actual
values of additional treatments with that of the two aldicarb rates applied in the solid
band. Table 1.12 illustrates the effects of insecticide treatment on thrips numbers at 3
WAP. At Duplin County (2007) and Clayton (2008), the number of adult thrips per 5
plants at 3 WAP was highest in the NTC and in acephate alone applied at 3 WAP,
Abamectin plus thiamethoxam (seed treatment) followed by (fb) acephate also resulted in
significantly greater adult thrips numbers when compared to both aldicarb rates. This can
be expected, because the acephate was applied soon after sampling on this day. At
Duplin County in 2008, the number of adult thrips per 5 plants at 3 WAP associated with
the seed treatment, with and without the subsequent acephate application, was
significantly greater than both aldicarb rates, but were no different than acephate alone or
the NTC. The number of immature thrips per 5 plants at 3 WAP associated with
acephate alone and the NTC was significantly greater than all other treatments in both
2007 and 2008, although the NTC resulted in numerically less thrips than the acephate
alone treatment in 2008. The acephate alone treatment and the NTC treatments also
resulted in significantly greater total number of thrips per 5 plants at 3 WAP compared to
all other treatments at all three site years, although numeric trends were different among
all site years. The acephate was applied immediately after sampling on that day, thus
these treatments were essentially the same at this time, as supported by the data. Table
1.13 illustrates the effects of insecticide treatment on thrips numbers at 4 WAP. The
number of adult thrips per 5 plants at 4 WAP was not affected by insecticide treatment at
all locations. At Duplin County in 2007, the NTC resulted in a significantly higher
number of immature thrips per 5 plants at 4 WAP than all other treatments. Of the
remaining treatments, the seed treatment alone resulted in a higher number of immature
thrips per 5 plants at 4 WAP compared to the high aldicarb rate. Therefore, it is evident
other treatments. At Duplin County in 2008, again the NTC resulted in a significantly
higher number of immature thrips per 5 plants at 4 WAP than all other treatments, and
the acephate alone treatment resulted in higher thrips numbers than the low aldicarb rate.
At Clayton in 2008, the NTC resulted in a higher number of immature thrips per 5 plants
at 4 WAP compared to all other treatments, with no differences between remaining
treatments. At this location, the seed treatment alone was as effective as other treatments
in terms of thrips control. At Dupin County in 2007, the total number of thrips per 5
plants at 4 WAP was significantly higher in the NTC compared to all other treatments,
with the seed treatment alone resulting in greater thrips numbers than both aldicarb rates,
similar to the effect observed at this location at 4 WAP. At Duplin County in 2008, again
the NTC resulted in greater thrips numbers compared to all other treatments, with
acephate alone resulting in higher total thrips numbers than the low aldicarb rate. At
Clayton in 2008, the NTC resulted greater thrips numbers compared to all other
treatments, with no differences among remaining treatments. Table 1.14 illustrates the
effects of insecticide treatment on thrips numbers at 5 WAP. At Duplin County in both
years, the number of adult thrips per 5 plants at 5 WAP was not affected by insecticide
treatment, while the NTC resulted in significantly higher numbers of adult thrips than all
other treatments at Clayton in 2008. At Duplin County in 2007, the number of immature
thrips per 5 plants at 5 WAP was greater in the NTC compared to all other treatments,
followed by the seed treatment alone, again indicating that the longevity of thrips control
differences among the remaining treatments. At Duplin County in 2008, the number of
immature thrips per 5 plants at 5 WAP was significantly the greatest in the seed treatment
alone, followed by the NTC. The acephate alone treatment also resulted in greater
immature thrips numbers than the seed treatment fb acephate treatment and the high
aldicarb rate. At Clayton in 2008, the seed treatment alone resulted in the highest number
of immature thrips, followed by the NTC, although only the NTC had significantly
greater immature thrips numbers when compared to both aldicarb rates. At Duplin
County in 2007, the total number of thrips per 5 plants at 5 WAP was greatest in the
NTC, followed by the seed treatment alone, likely a result of the number of immature
thrips at this time. In this site-year, the acephate alone treatment resulted in higher total
thrips numbers when compared to the high aldicarb rate. At Duplin County in 2008, the
seed treatment alone resulted in significantly greater total thrips numbers at 5 WAP than
all treatments except for the NTC, in contrast to the effects observed at other locations.
The acephate alone treatment in this site-year resulted in greater total thrips numbers at 5
WAP than the seed treatment fb acephate and the high aldicarb rate. At Clayton in 2008,
the seed treatment alone and the NTC resulted in greater total thrips numbers at 5 WAP
than all other treatments. In all site-years, plant dry weight at 3 and 4 WAP was least in
the NTC and the acephate alone treatments, compared to all other insecticide treatments.
All insecticide treatments resulted in greater plant dry weight at 5 WAP than the NTC in
all site-years. Acephate alone resulted in lower plant dry weight at 5 WAP compared to
treatments control thrips effectively, and that the injury observed by some treatments was
transient. The high aldicarb rate and the seed treatment fb acephate resulted in greater
plant dry weight at 5 WAP than the seed treatment alone, but was no different than that of
the low aldicarb rate. The low aldicarb rate also resulted in similar plant dry weight at 5
WAP to that of the seed treatment alone.
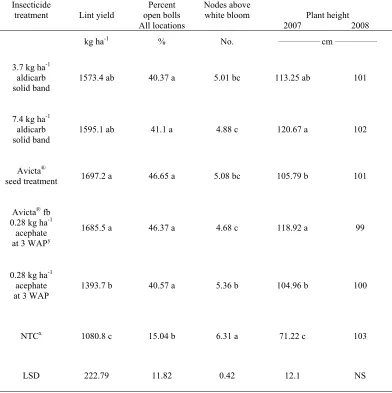
Table 1.16 illustrates the effects of insecticide treatment on various growth parameters
and yield. All insecticide treatments yielded higher than the NTC. Acephate alone
resulted in significantly less lint yield than the seed treatment alone or the seed treatment
fb acephate, but was no different from the yields resulting from both aldicarb rates. All
insecticide treatments resulted in higher open boll percentages than the NTC. Nodes
above white flower were highest in the NTC, followed by acephate alone, although there
was no difference between acephate alone and both the seed treatment alone and the low
aldicarb rate. These effects indicate that suboptimal thrips control may result in delayed
maturity. The high rate of aldicarb and the seed treatment fb acephate resulted in similar
NAWF as the seed treatment alone and the low aldicarb rate, but were significantly less
than that of acephate alone. All insecticide treatments resulted in significantly taller
plants than the NTC in 2007. The high aldicarb rate and the seed treatment fb acephate
resulted in taller plants than the seed treatment alone and acephate alone, but the low
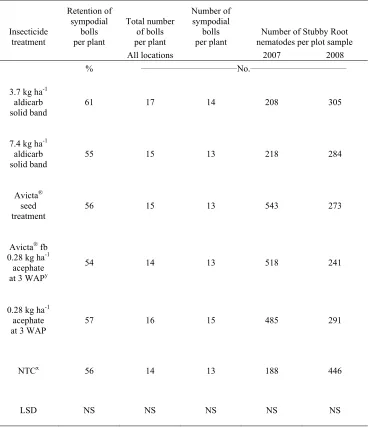
aldicarb rate resulted in similar plant height to all insecticide treatments. Insecticide
insecticide treatment on plant nodes. The total number of nodes per plant was not
affected by insecticide treatment at all site-years. The node of first sympodial branch was
also not affected by insecticide treatment in 2008, although the numeric behavior
between locations in this year was slightly different. At Duplin County in 2007,
however, highest values for node of first sympodia was observed in the NTC, followed
by acephate alone, and all remaining treatments resulted in significantly lower values
than both of these treatments. This also supports the notion that thrips injury can result in
delayed maturity. All insecticide treatments resulted in a greater number of bolls on
nodes 4 through 7 in 2007, an indicator that controlling thrips may promote earlier
maturity, but the number of bolls in this node zone was not affected by insecticide
treatment in 2008 (Table 1.18). Boll distribution in all higher node zones was not
affected by insecticide treatment in all site-years. Retention of sympodial bolls, the total
number of bolls, and the number of sympodial bolls in all site-years, and the number of
stubby root nematodes per plot sample in each year, were not affected by insecticide
treatment, although the numeric trend of the latter parameter was different between years
(Table 1.19). Insecticide treatment did not affect any fiber quality parameter in all
site-years (Table 1.20).
Although aldicarb rate did not influence thrips numbers, cotton yield, and most growth or
maturity parameters in this experiment, some datum suggests that early season growth
suboptimal growth or yield in other environments or under heavier thrips pressure than
was observed in this experiment (Tables 1.1, 1.2, 1.6, 1.7, 1.9). Aldicarb band length in
this experiment also had no impact on yield and most growth or maturity parameters,
however some data suggested that the short band (7.62 cm) could result in more thrips,
and thus injury, which could also result in suboptimal yield or delays in maturity in other
environments. In this experiment, early season thrips injury, associated with the low rate
of aldicarb and the short band, was transient. The lack of significant aldicarb rate by
band length interactions for the majority of the parameters measured, indicate that these
two factors are independent of each other, and that results observed from band lengths
behave similarly across aldicarb rates. These results were similar to that of Lohmeyer et
al. (2001; 2002) and Van Duyn et al. (2002), indicating that precision application of
aldicarb in a hill-dropped system can maintain optimal thrips control, maturity, and lint
yield.
Similar to the findings of Herbert et al. (2007), most data from this experiment suggested
that the seed treatment performs similarly to aldicarb in terms of thrips control and yield,
although some datum suggested that the seed treatment fb acephate allowed for better
thrips control than the seed treatment alone. This indicates that the window of thrips
control may be shorter for seed treatments alone when compared to aldicarb, similar to
Table 1.21 illustrates the costs of each treatment used in this experiment, as well as the
percent savings of each treatment relative to the most expensive treatment. A precision
application system may allow significant at-planting costs savings compared to
traditional planting methods. The more risky methods (low aldicarb rates and short
bands) allow for substantial savings (91 %) whereas the more conservative approaches
(high rates and long bands) allow for fewer savings however they are still significant (63
%). Regardless of the level of risk associated with these precision application systems,
all are less expensive than the seed treatment fb acephate treatment, which is usually
recommended when utilizing seed treatments. However, other considerations, including
equipment capabilities and a method of precision application of aldicarb must be devised
Literature Cited
Bacheler, J.S. 2009. Managing insects in cotton. p. 126-147. In K.L. Edmisten (ed.).
North Carolina Cotton Information. Publ. AG-417. North Carolina Cooperative Ext. Serv., Raleigh, NC.
Bauer, P.J., and M.E. Roof. 2004. Nitrogen, aldicarb, and cover crop effects on cotton yield and fiber properties. Agron. J. 96:369-376.
Bridge, R.R., W.R. Meredith Jr., and J.F. Chism. 1973. Influence of planting method and
plant population on cotton (Gossypium hirsutum L.). Agron. J. 65:104-109.
Crozier, C.R. 2009. Fertilization. p. 35-48. In K.L. Edmisten (ed.). North Carolina
Cotton Information. Publ. AG-417. North Carolina Cooperative Ext. Serv., Raleigh, NC.
Edmisten, K.L. 2009a. Cotton defoliation. p. 148-166. In K.L. Edmisten (ed.). North
Carolina Cotton Information. Publ. AG-417. North Carolina Cooperative Ext. Serv., Raleigh, NC.
Edmisten, K.L. 2009b. Suggestions for growth regulator use. p. 58-64. In K.L. Edmisten
(ed.). North Carolina Cotton Information. Publ. AG-417. North Carolina Cooperative Ext. Serv., Raleigh, NC.
Furr, R.E. Jr., F.A. Harris, and J.T. Robbins. 1998. Thrips control in the Mississippi delta,
1993-97. In Proc. Beltwide Cotton Conf. 2:1270-1275. Natl. Cotton Counc. Am.,
Memphis,TN.
Greene, J., J.D. Mueller, D. Robinson, and W.W. Bonnette. 2007. Comparisons of nematicide/insecticide seed treatment and in-furrow products. In Proc. Beltwide
Cotton Conf. New Orleans, LA. Jan 9-12. Natl. Cotton Counc. Am., Memphis,TN.
Grey, T.L., G.D. Buntin, P.M. Roberts, and D.C. Bridges. 2006. Potential interaction of pendimethalin and systemic insecticides for thrips control in cotton. Agron. J. 98:141-147.
Herbert, D.A., J. Bacheler, S. Malone, and D. Mott. 2007. Thrips control options in Virginia/North Carolina: Overviews, insights and updates. In Proc. Beltwide
Cotton Conf. New Orleans, LA. Jan 9-12. 1649-1653. Natl. Cotton Counc. Am., Memphis,TN.
Hopkins, J.D., J.D. Reaper III, D.R. Johnson, and G.M. Lorenz III. 2002. Thrips
management in Arkansas cotton. In Proc. Beltwide Cotton Conf. Altlanta, GA.
Jan 8-12. Natl. Cotton Counc. Am., Memphis,TN.
Johnson, D.R., J.D. Hopkins, G.M. Lorenz III, and J.D. Reaper III. 2001. Evaluation of
thrips management options in cotton. In Proc. Beltwide Cotton Conf. 2:1086-
1088. Natl. Cotton Counc. Am., Memphis,TN.
Kittock, D.L. 1974. Lint yield of hill-dropped and drill-planted pima cotton. Agron. J. 66:593-594.
Koenning, S. 2009. Disease management in cotton. p. 56-67. In K.L. Edmisten (ed.).
North Carolina Cotton Information. Publ. AG-417. North Carolina Cooperative Ext. Serv., Raleigh, NC.
Lentz, G.L., N. Van Tol, and D. Pekarchick. 2003. Performance of early-season
insecticides under adverse conditions in west Tennessee. In Proc. Beltwide Cotton
Conf. Nashville, TN. Jan 6-10. Natl. Cotton Counc. Am., Memphis,TN.
Lohmeyer, K.H., J.N. All, J.K. Lance, P.M. Roberts, and P.B. Bush. 2002. Reducing planting time aldicarb use in cotton utilizing precision placement and
conservation tillage. In Proc. Beltwide Cotton Conf. Altlanta, GA. Jan 8-12. Natl.
Cotton Counc. Am., Memphis,TN.
Lohmeyer, K., J. All, P. Bush, P. Roberts, and K. Lance. 2001. Hill-drop application of aldicarb to enhance efficiency of thrips management in cotton. In Proc. Beltwide
Cotton Conf. 2:1114-1116. Natl. Cotton Counc. Am., Memphis,TN.
Lopez, J.D. Jr., B.K. Fritz, M.A. Latheef. Y. Lan, D.E. Martin, and W.C. Hoffman. 2008. Evaluation of toxicity of selected insecticides against thrips on cotton in
laboratory bioassays. J. Cotton Sci. 12:188-194.
Siebert, J.D., A.M. Stewart, B.R. Leonard. 2006. Comparative growth and yield of cotton planted at various densities and configurations. Agron. J. 98:562-568.
Stewart, S.D., G.M. Lorenz, K.L. Willis, B.A. Hanks, S.J. Steckel, C.K. Colwell. 2007. Thrips control in seedling cotton. In Proc. Beltwide Cotton Conf. New Orleans,
LA. Jan 9-12. Natl. Cotton Counc. Am., Memphis,TN.
Van Duyn, J., J.R. Bradley Jr., R. Jackson, M. Ambrose, and R. Kurtz. 2002. Efficacy of hill-drop applied Temik 15G and potential cost savings when coupled with new technology seed. In Proc. Beltwide Cotton Conf. Altlanta, GA. Jan 8-12. Natl.
Cotton Counc. Am., Memphis,TN.
Van Duyn, J., J.R. Bradley Jr., A.L. Lambert, C.P.C. Suh, and J. Faircloth. 1998. Thrips
management with Gaucho® seed treatment in North Carolina cotton. In Proc.
Beltwide Cotton Conf. 2:1183-1187. Natl. Cotton Counc. Am., Memphis,TN.
York, A.C., and S. Culpepper. 2009. Cotton defoliation. p. 68-125. In K.L. Edmisten
(ed.). North Carolina Cotton Information. Publ. AG-417. North Carolina Cooperative Ext. Serv., Raleigh, NC.
Table 1.1. Aldicarb rate effect on the number of thrips per 5 plants at 3, 4, and 5 weeks after planting in 2007 and 2008.z Aldicarb Rate Number of adult thrips per 5 plants at
3 WAPy
Number of immature thrips per 5 plants at 3 WAP
Total number of
thrips per 5 plants at
3 WAP Number of adult thrips per 5 plants at 4 WAP Number of immature thrips per 5 plants at 4 WAP
Total number of
thrips per 5 plants at 4 WAP Number of adult thrips per 5 plants at 5 WAP Number of immature thrips per 5 plants at 5 WAP
Total number of
thrips per 5 plants at 5 WAP kg ha-1 __________________________________________________________________________% of NTCx_______________________________________________________________________
3.7 46 13 16 89 27 31 90 55.63 a 59
7.4 37 8 6 88 8 15 66 42.89 b 42
LSD NS NS NS NS NS NS NS 12.73 NS
zData are pooled over years and locations. Means within a column followed by dissimilar letters are significantly different based on Fisher’s Protected
LSD test at α = 0.05.
Table 1.2. Aldicarb rate effect on plant dry weight at 3, 4, and 5 weeks after planting and number of nematodes per plot in 2007 and 2008.z
Aldicarb
Rate Plant dry weight 3 WAPy
Plant dry weight
4 WAP Plant dry weight 5 WAP
Stubby Root nematodes per
plot sample at end of season
Total nematodes per plot sample at end of season Duplin Co.
2007-2008 Clayton 2008 All locations 2007 2008 All locations
kg ha-1 ___________________________________________________________% of NTCx______________________________________________________________
3.7 122 131 200 347.7 b 261 129 112.5 b
7.4 131 126 202 426.6 a 266 118 129.3 a
LSD NS NS NS 72.77 NS NS 13.7
zData are pooled over years and locations unless noted otherwise. Means within a column followed by dissimilar letters are significantly
different based on Fisher’s Protected LSD test at α = 0.05.
Table 1.3. Aldicarb rate effect on growth parameters and lint yield in 2007 and 2008.z
Aldicarb rate
Nodes above white bloom
Percent open
bolls Plant height
Number of mainstem
nodes
Node of first sympodial
branch Lint yield
kg ha-1 ________________________________________________% of NTCy_____________________________________________________
3.7 81 398 120 99 99 184
7.4 78 387 119 97 96 190
LSD NS NS NS NS NS NS
zData are pooled over years and locations. Means within a column followed by dissimilar letters are significantly
different based on Fisher’s Protected LSD test at α = 0.05.
Table 1.4. Aldicarb rate effect on boll distribution in 2007 and 2008.z
Aldicarb Rate
Total number of
bolls per plant
Number of sympodial bolls per
plant
Sympodial boll
retention Number of bolls on nodes 4-7
Number of bolls on
nodes 8-10
Number of bolls on
nodes 17-19
All locations Duplin Co. 2007-2008 Clayton 2008 All locations
kg ha-1 ________________________________________________________% of NTCy________________________________________________________
3.7 133 120 110 462 151 111 219
7.4 122 112 106 647 153 114 117
LSD NS NS NS NS NS NS NS
zData are pooled over years and locations. Means within a column followed by dissimilar letters are significantly different
based on Fisher’s Protected LSD test at α = 0.05.
Table 1.5. Aldicarb rate effect on fiber quality parameters in 2007 and 2008.z
Aldicarb rate Micronaire Upper half mean
Uniformity
index Fiber strength
kg ha-1 ______________________________________% of NTCy_____________________________________
3.7 100.04 b 98 99 98
7.4 100.51 a 99 100 98
LSD 0.404 NS NS NS
zData are pooled over years and locations. Means within a column followed by dissimilar
letters are significantly different based on Fisher’s Protected LSD test at α = 0.05.
Table 1.6. Aldicarb band length effect on the number of thrips per 5 plants at 3, 4, and 5 weeks after planting in 2007 and 2008.z Aldicarb Band length Number of adult thrips per 5 plants at 3 WAPy
Number of immature thrips per 5 plants at 3 WAP
Total number of
thrips per 5 plants at 3 WAP
Number of adult thrips per 5 plants at 4 WAP
Number of immature thrips per 5 plants at 4 WAP
Total number of thrips per 5
plants at 4 WAP
Number of adult thrips per 5
plants at 5 WAP
Number of immature thrips per 5 plants at 5 WAP
Total number of thrips per 5
plants at 5 WAP cm __________________________________________________________________________________% of NTCx______________________________________________________________________________
solid 20 1 2 92 4 13.32 b 78 30 41
7.62 64 21 18 98 29 34.17 a 84 62 57
15.24 40 9 13 76 18 22.68 ab 72 56 53
LSD NS NS NS NS NS 14.32 NS NS NS
zData are pooled over years and locations. Means within a column followed by dissimilar letters are significantly different based on Fisher’s Protected LSD test
at α = 0.05.
Table 1.7. Aldicarb band length effect on plant dry weight and nematodes in 2007 and 2008.z
Aldicarb Band length
Plant dry weight
3 WAPy Plant dry weight 4 WAP Plant dry weight 5 WAP
Stubby Root nematodes per plot sample
Total nematodes per plot sample cm _________________________________________% of NTCx_______________________________________________
solid 131 215 341.7 a 97 120
7.62 127 187 267.9 b 164 117
15.24 123 201 304.8 ab 109 126
LSD NS NS 41.5 NS NS
zData are pooled over years and locations. Means within a column followed by dissimilar letters are significantly
different based on Fisher’s Protected LSD test at α = 0.05.
Table 1.8. Aldicarb band length effect on growth parameters and lint yield in 2007 and 2008.z
Aldicarb rate
Nodes above white bloom
Percent open
bolls Plant height
Number of mainstem
nodes
Node of first sympodial
branch Lint yield cm ____________________________________________________% of NTCy__________________________________________________________
solid 78 401 117 98 100 189
7.62 80 397 122 98 97 189
15.24 80 380 119 98 95 184
LSD NS NS NS NS NS NS
zData are pooled over years and locations. Means within a column followed by dissimilar letters are significantly
different based on Fisher’s Protected LSD test at α = 0.05.
Table 1.9. Aldicarb band length effect on boll distribution in 2007 and 2008.z
Aldicarb Rate
Total number of
bolls per plant
Number of sympodial bolls per
plant Sympodial boll retention Number of bolls on nodes 4-7
Number of bolls on
nodes 8-10
Number of bolls on
nodes 17-19
All locations Duplin Co. 2007-2008 Clayton 2008 Duplin Co. 2007-2008 Clayton 2008 All locations cm ___________________________________________________________________% of NTCy_________________________________________________________________
solid 114 105 99 113.98 b 448 168 111 119
7.62 135 123 96 131.36 a 535 156 116 219
15.24 131 118 110 106.27 b 678 131 110 157
LSD NS NS NS 14.61 NS NS NS NS
zData are pooled over years and locations. Means within a column followed by dissimilar letters are significantly different
based on Fisher’s Protected LSD test at α = 0.05.
Table 1.10. Aldicarb rate effect on fiber quality parameters in 2007 and 2008.z
Aldicarb rate Micronaire Upper half mean
Uniformity
index Fiber strength
All locations Duplin Co. 2007-2008 Clayton 2008
cm ____________________________________________________% of NTCy____________________________________________________
solid 101 99 100 98 97
7.62 99 99 99 98 98
15.24 101 99 100 96 99
LSD NS NS NS NS NS
zData are pooled over years and locations. Means within a column followed by dissimilar
letters are significantly different based on Fisher’s Protected LSD test at α = 0.05.
Table 1.11. Aldicarb rate and band length interaction effect on growth parameters in 2007 and 2008.z
Insecticide
treatment Height-to-node ratio Number of sympodial nodes per plant Number of bolls on nodes 11-13 Number of bolls on nodes 14-16
2007 2008 All locations
_______________________________________% of NTCy_______________________________________
3.7 kg ha-1
aldicarb
solid band 143 104 93.12 b 93.24 b 82.22 bc 7.4 kg ha-1
aldicarb
solid band 169 103 101.95 ab 88.33 b 81.54 bc 3.7 kg ha-1
aldicarb 7.62 cm band
179 106 108.97 a 128.23 a 149.19 a 7.4 kg ha-1
aldicarb
7.62 cm band 158 105 95.66 b 88.55 b 67.39 c 3.7 kg ha-1
aldicarb 15.24 cm band
172 100 98.9 b 90.29 b 102.38 bc
7.4 kg ha-1
aldicarb 15.24 cm band
160 103 99.37 b 106.14 ab 109.07 b
LSD NS NS 9.073 25.512 39.167
zData are pooled over years and locations. Means within a column followed by dissimilar letters are significantly
different based on Fisher’s Protected LSD test at α = 0.05.
Table 1.12.Insecticide treatment effect on the number of thrips per 5 plants at 3 weeks after planting in 2007 and 2008.z
Insecticide
treatment Number of adult thrips per 5 plants at 3 WAPy Number of immature thrips per 5 plants at 3 WAP Total number of thrips per 5 plants at 3 WAP Duplin Co.
2007 & Clayton
2008 Duplin Co. 2008 2007 2008 Duplin Co. 2007 Duplin Co. 2008 Clayton 2008 _________________________________________________________________No.______________________________________________________________________ 3.7 kg ha-1
aldicarb
solid band 2 c 2 b 4.75 b 1.13 b 8 b 3.25 b 1.75 b 7.4 kg ha-1
aldicarb
solid band 1.75 c 2 b 1.25 b 0.38 b 4 b 2.75 b 0.75 b Avicta®
seed
treatment 6.125 bc 8.75 a 2.5 b 3.13 b 8.75 b 13.75 b 7.25 b Avicta® fb
0.28 kg ha-1 acephate at 3 WAPy
7.125 b 7.5 a 2 b 2 b 11.25 b 10 b 6.5 b
0.28 kg ha-1 acephate at 3 WAP
16.375 a 7 ab 100.5 a 239.13 a 119.25 a 216.75 a 282.5 a
NTCx 17.625 a 5.5 ab 129.75 a 205.88 a 151.75 a 199.75 a 230.75 a
LSD 4.958 5.053 29.62 56.895 37.076 82.345 88.524
zData are pooled over years and locations. Means within a column followed by dissimilar letters are significantly
different based on Fisher’s Protected LSD test at α = 0.05.
Table 1.13. Insecticide treatment effect on the number of thrips per 5 plants at 4 weeks after planting in 2007 and 2008.z
Insecticide treatment
Number of adult thrips per 5 plants
at 4 WAPy Number of immature thrips per 5 plants at 4 WAP Total number of thrips per 5 plants at 4 WAP All locations Duplin Co. 2007 Duplin Co. 2008 Clayton 2008 Duplin Co. 2007 Duplin Co. 2008 Clayton 2008 ___________________________________________________________No.___________________________________________________________ 3.7 kg ha-1
aldicarb solid band
6.6 13.25 bc 2.25 c 3 b 18 c 7.5 c 12.75 b
7.4 kg ha-1 aldicarb solid band
7.8 5.5 c 4.5 bc 0.5 b 11.75 c 12.75 bc 9.5 b
Avicta® seed treatment
8.6 40.75 b 12.75 bc 13.25 b 53 b 19.5 bc 20 b
Avicta® fb 0.28 kg ha-1 acephate at 3 WAPy
7.2 13.5 bc 5.25 bc 2.25 b 20.75 bc 11.25 bc 10.5 b
0.28 kg ha-1 acephate at 3 WAP
7.5 26.5 bc 26 b 4.25 b 29 bc 33.5 b 16.75 b
NTCx 8.8 312.75 a 76.75 a 66 a 322 a 84 a 75.75 a
LSD NS 31.949 22.1 37.143 33.744 24.274 39.197 zData are pooled over years and locations. Means within a column followed by dissimilar letters are significantly different based on Fisher’s Protected LSD test at α = 0.05.