R E S E A R C H A R T I C L E
Open Access
Cost and quality of life analysis of HIV
self-testing and facility-based HIV testing
and counselling in Blantyre, Malawi
Hendramoorthy Maheswaran
1,2*, Stavros Petrou
1, Peter MacPherson
3,4, Augustine T. Choko
2,
Felistas Kumwenda
2, David G. Lalloo
2,4, Aileen Clarke
1and Elizabeth L. Corbett
2,5Abstract
Background:HIV self-testing (HIVST) has been found to be highly effective, but no cost analysis has been undertaken to guide the design of affordable and scalable implementation strategies.
Methods:Consecutive HIV self-testers and facility-based testers were recruited from participants in a community cluster-randomised trial (ISRCTN02004005) investigating the impact of offering HIVST in addition to facility-based HIV testing and counselling (HTC). Primary costing studies were undertaken of the HIVST service and of health facilities providing HTC to the trial population. Costs were adjusted to 2014 US$ and INT$. Recruited participants were asked about direct non-medical and indirect costs associated with accessing either modality of HIV testing, and additionally their health-related quality of life was measured using the EuroQol EQ-5D.
Results:A total of 1,241 participants underwent either HIVST (n = 775) or facility-based HTC (n = 446). The mean societal cost per participant tested through HIVST (US$9.23; 95 % CI: US$9.14-US$9.32) was lower than through facility-based HTC (US$11.84; 95 % CI: US$10.81-12.86). Although the mean health provider cost per participant tested through HIVST (US$8.78) was comparable to facility-based HTC (range: US$7.53-US$10.57), the associated mean direct non-medical and indirect cost was lower (US$2.93; 95 % CI: US$1.90-US$3.96). The mean health provider cost per HIV positive participant identified through HIVST was higher (US$97.50) than for health facilities (range: US$25.18-US$76.14), as was the mean cost per HIV positive individual assessed for anti-retroviral treatment (ART) eligibility and the mean cost per HIV positive individual initiated onto ART. In comparison to the facility-testing group, the adjusted mean EQ-5D utility score was 0.046 (95 % CI: 0.022-0.070) higher in the HIVST group. Conclusions:HIVST reduces the economic burden on clients, but is a costlier strategy for the health provider aiming to identify HIV positive individuals for treatment. The provider cost of HIVST could be substantially lower under less restrictive distribution models, or if costs of oral fluid HIV test kits become comparable to finger-prick kits used in health facilities.
Keywords:HIV, HIV testing and counselling, HIV self-testing, Costs, Health-related quality of life, EQ-5D
Background
Awareness of HIV status is key to ensuring timely access to effective HIV treatment and prevention [1, 2]. Sub-Saharan Africa accounts for three quarters of all new infections and HIV-related deaths [3], and despite massive increases in funding for HIV testing services,
only one half of Africans know their HIV status [3, 4]. New targets, set by UNAIDS (“90-90-90”), and agreed to by most African countries including Malawi, are for 90 % of Africans living with HIV to know their status by 2020, with 90 % of these retained on antiretroviral ther-apy (ART), and 90 % of those on ART having undetect-able viral loads [5]. Uptake, however, remains low in hard-to-reach populations, including men and adoles-cents, and amongst those who do have regular contact with broader healthcare services, including pregnant women and those with tuberculosis (TB) disease [3]. * Correspondence:[email protected]
1
Division of Health Sciences, University of Warwick Medical School, Gibbet Hill Campus, Coventry CV4 7AL, UK
2Malawi-Liverpool-Wellcome Trust Clinical Research Programme, Blantyre, Malawi
Full list of author information is available at the end of the article
© 2016 Maheswaran et al.Open AccessThis article is distributed under the terms of the Creative Commons Attribution 4.0 International License (http://creativecommons.org/licenses/by/4.0/), which permits unrestricted use, distribution, and reproduction in any medium, provided you give appropriate credit to the original author(s) and the source, provide a link to the Creative Commons license, and indicate if changes were made. The Creative Commons Public Domain Dedication waiver (http://creativecommons.org/publicdomain/zero/1.0/) applies to the data made available in this article, unless otherwise stated. Maheswaranet al. BMC Medicine (2016) 14:34
HIV testing and counselling (HTC) continues to be undertaken predominantly in health facilities [4], despite strong evidence to suggest clients prefer to test in the community [6, 7]. Community-based HTC, including home-based and mobile services, reach HIV infected individuals earlier in their disease progression [8], poten-tially improving health outcomes and reducing health-care costs of health-care provision [9]. Community-based HTC may be essential to reach the 90-90-90 targets [10], but costs tend to be higher than for facility-based HTC services, with lower uptake of post-test HIV care services unless facilitated linkage interventions are provided alongside [11, 12].
HIV self-testing (HIVST) has been found to be highly acceptable, safe and effective at achieving high coverage rates in communities, including amongst hard-to-reach populations of men and adolescents [13–15]. However, no primary cost analyses have been undertaken of HIV self-testing services in sub-Saharan Africa to inform pol-icy, hindering efforts to design scalable implementation strategies. We undertook a costing study to investigate the costs to both healthcare providers and users acces-sing either HIVST or facility-based HTC. We addition-ally describe the health-related quality of life of users of these services. We collected individual-level economic data from users of both services, and undertook primary costing studies of the two approaches, within the context of a large cluster-randomised study investigating the impact of offering HIVST in addition to facility-based HTC in Blantyre, Malawi.
Methods
Study design and participants
The study recruited individuals who were participants in a cluster-randomised trial (ISRCTN02004005) investigating the impact of offering HIVST in addition to standard facility-based HTC [16]. We estimated the economic costs associated with HIVST and facility-based HTC, and add-itionally the health-related quality of life (HRQoL) of par-ticipants accessing either modality.
The study area included three high-density urban sub-urbs of Blantyre, Malawi [15] with an adult population of approximately 34,000 residents and adult HIV prevalence of 18 % [13]. Twenty-eight clusters of approximately 1,200 adults were randomised to either HIVST or standard-of-care (control). In all clusters, participants could access HTC at the health facilities by self-presenting or after re-ferral by medical personnel. In the 14 intervention HIVST clusters, resident volunteer counsellors promoted HIVST and provided pre- and post-test counselling, as well as directions on how to use the self-test kits. Participants could self-test in the privacy of their own homes.
Routine and confirmatory HIV testing and care ser-vices were available at Queen Elizabeth Central Hospital
(QECH), and two primary health clinics located in the study area (Ndirande Health Centre, Chilomoni Health Centre). HIVST was provided for a two-year period, with the service introduced from February to May 2012. From the onset of intervention in seven HIVST clusters, and from January 2013 in all HIVST clusters, partici-pants could also request home-based assessment and initiation of 14 days of HIV care, including ART if eligible [14]. Subsequent care was provided at the pri-mary care level.
The present study recruited participants from February 2013 to April 2014. Recruitment was restricted to adult residents of the 28 clusters who had just tested for HIV, either at home (HIVST clusters) or in a facility (all 28 clus-ters), but had not started ART. A previously validated satellite“Map Book”was used to determine cluster of resi-dence [17], and consequently trial arm. Participants who accessed HIVST were recruited consecutively from the Quality Assurance (QA) cohort of the main trial [15]. The QA component systematically sampled HIVST partici-pants, with a minimum 5 % randomly selected for home-visit by one of the trial’s study nurses. Recruitment of facility-based HTC participants was undertaken consecu-tively at each of the three local health facilities (Queen Elizabeth Central Hospital, Ndirande Health Centre and Chilomoni Health Centre).
Cost analysis
Economic costing of both the HIVST service and facility HTC services was undertaken to estimate direct health provider costs [18, 19]. Costs included: staff salaries; training of staff; consumables and equipment; monitor-ing and evaluation; and overhead costs, as detailed in Additional file 1.
HIVST community counsellors, programme managers and accounting staff were interviewed to estimate the costs of identified resources and other service delivery, excluding research costs. For facility HTC services, HTC counsellors and administrative staff at the Blantyre District Health Office and the Queen Elizabeth Central Hospital were interviewed. Trial testing registers and Ministry of Health programme output data were used to determine overall numbers of individuals tested and number of HIV positive individuals identified.
self-reported income [20]. In addition, we recorded the total time spent testing, including travel and waiting time.
We used data reported by the World Bank to adjust all costs to account for inflation and differences in purchas-ing power between countries [21]. All costs are reported in 2014 US Dollars and International Dollars [19].
Health-related quality of life
Participants were recruited after they had received their HIV test result, but before starting ART. HIV results and health-related quality of life (HRQoL) were captured at the same interview as economic costs. We used a self-assessed health (SAH) measure to ask individuals to rate their general health on a five-point Likert scale, with responses coded as: very good; good; fair; poor; or very poor. This SAH measure has been found to be a strong predictor of future health outcomes in high-income set-tings [22], and has also been used in resource-constrained settings [23].
A translated Chichewa version of the EuroQoL EQ-5D [24] tool was used to estimate the HRQoL of all study par-ticipants. Translation followed EuroQoL guidelines [25], and was approved before use. The EQ-5D measure con-sists of two principal measure components, a descriptive system and a visual analogue scale (VAS) [26]. The de-scriptive system defines HRQoL on the day of response in terms of five dimensions:‘mobility’,‘self care’,‘usual activ-ities’,‘pain/discomfort’and‘anxiety/depression’. Responses in each dimension have historically been divided into three ordinal levels, coded: (1) no problems; (2) some or moderate problems; and (3) severe or extreme problems. Responses to the three level version of the EQ-5D place respondents into one of 243 (35) health states. Resultant health states can be converted to an EQ-5D utility score using a “tariff set” derived from national surveys of the general population [26]. As no Malawian EQ-5D tariff exists, the Zimbabwean EQ-5D tariff set was used [27], assuming that Malawians will value health comparably [19]. The Zimbabwean tariff results in EQ-5D utility scores ranging from 1.0 (no problems in the five dimensions) to -0.29 (severe problems in all five dimension). The VAS, similar to a thermometer, ranges from 100 (best imaginable health state) to 0 (worst imaginable health state). Partici-pants are asked to indicate how good their health is on the day of response by drawing a line on the VAS.
Statistical analysis
Analysis used Stata version 13.0 (Stata Corporation, College Station, TX, USA). Comparisons of categorical variables used the chi-squared test, with the student’st-test used for EQ-5D utility and VAS scores. Principal component ana-lysis was used to generate wealth quintiles combining socioeconomic variables including nine household assets, and home environment variables [28].
Direct health provider cost per individual tested, and the cost per HIV positive individual identified were esti-mated from total annual provider cost of HTC services divided by number of individuals tested and number testing positive, respectively. For the HIVST, the propor-tion testing HIV positive was based on overall parent study data [15]. Direct health provider cost per individ-ual assessed for ART eligibility, and per ART initiation, was estimated directly for the facility HTC cohort. The HIVST cohort data did not capture participants who were assessed for/initiated on ART by the trial home ini-tiation option: home iniini-tiation events were, therefore, estimated from the parent trial data. National ART eligi-bility criteria were used (CD4 count < 350 cells/μl or WHO stage 3 or 4 or breastfeeding or pregnant).
We made comparisons between the mean direct non-medical and indirect costs for HIV self-testers and facil-ity testers, and for facilfacil-ity-testers who resided in control clusters and intervention clusters. As the cost data were skewed, we used non-parametric bootstrap methods, with 1000 bootstrap replications, to derive 95 % confi-dence intervals (CI) for mean cost differences for rele-vant cost categories [29].
We undertook multivariate analysis to investigate the independent effect of the mode of HIV testing and HIV test result on the total societal costs associated with HIV testing. Total societal cost summed direct health pro-vider costs, direct non-medical costs and indirect costs. For the HIV self-testers, we estimated the direct health provider cost per individual tested at the counsellor level. This was possible because the HIVST service re-cords the total number of individuals tested by each of the community counsellors. For facility-based HIV tes-ters, we used the estimated direct health provider cost per individual tested for the clinic attended for testing. As all participants incurred a cost, and the cost data were skewed, we used generalized linear models (GLM) for multivariate analyses of cost data [30]. We ran model diagnostics to determine the optimal choices for the distributional family and link function for these GLM models [31].
We compared the responses to the SAH and EQ-5D measures between HIVST participants and all facility testers, and between facility-based HIV testers residing in the intervention clusters to those residing in control clusters. For the descriptive component of the EQ-5D, binary responses (no problems or some/severe prob-lems) were used since severe or extreme problems were rarely reported. We undertook multivariate analysis to investigate the independent effect of the mode of HIV testing and HIV test result on the EQ-5D utility score. EQ-5D utility scores were non-normally distributed, negatively skewed and truncated at 1.0. We evaluated four commonly used estimators to analyse these data:
ordinary least squares (OLS) regression, Tobit regression, fractional logit regression and censored least absolute de-viations (CLAD) regression [32–34]. We compared the mean squared error (MSE) and mean absolute error (MAE) statistics between the observed EQ-5D utility score and the estimated scores for the whole sample and for sub-groups of the sample based on observed EQ-5D utility scores to determine the choice of estimator.
For all multivariate analyses we ran two alternative models: the first adjusted for modality of HIV testing, HIV test result, age and sex, and the second additionally adjusted for marital status, educational attainment, in-come and socio-economic position [35]. We accounted for clustering in all multivariate models using the cluster of residence for the participants to produce robust vari-ance estimators.
Sensitivity analysis was carried out using the UK York A1 tariff for the EQ-5D [36], which translates health states with‘severe’ problems in one or more of the five dimensions into lower EQ-5D utility scores than the Zimbabwean tariff [27]. For the multivariate analysis of total societal costs, we performed additional sensitivity analyses that (i) used the median wage of the sample, and (ii) the total HIV testing time, to value income losses (Additional file 1).
Ethical considerations
Ethical approval was obtained from the College of Medi-cine Ethics Review Committee, University of Malawi, and the University of Warwick Biomedical Research Ethics Committee. All participants provided written (or witnessed thumbprint if illiterate) informed consent.
Results
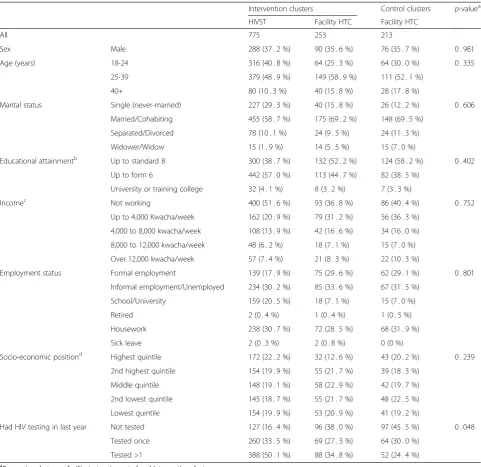
The study recruited 1,241 participants who had either self-tested and were being assessed as part of the QA study (n = 775) or who undertook facility-based HTC (n = 466) during the study period (Fig. 1). Table 1 shows the characteristics of the participants, by resi-dence status within the main trial and modality of HIV testing received. There were no significant differences in sex, age, marital status, educational attainment, em-ployment or socioeconomic status between residents of intervention clusters or control clusters who accessed facility-based HTC. Figure 2 shows the estimates of linkage for those who tested HIV positive after facility-based HTC and HIVST. For facility-facility-based HTC, 75.0 % to 82.7 % of those identified as HIV positive attended the HIV clinic for assessment for ART eligibility. For HIVST, 30.7 % of those identified as HIV positive attended the HIV clinic for assessment for ART eligibil-ity, in addition to the estimated 28.3 % opting for home assessment of HIV care.
The direct health provider costs of facility-HTC and HIVST are shown in Table 2. The mean provider costs per individual tested at the three health facilities were US$7.53 (INT$20.25), US$10.57 (INT$25.18), and US$8.90 (INT$20.44) at Ndirande, Chilomoni and QECH, respectively, whilst the mean cost of providing HIVST was US$8.78 (INT$17.25). The mean provider costs per HIV positive individual identified were, however, lower at the three health facilities (range US$28.30-US$76.14) than for HIVST (US$97.50), reflecting the lower HIV prevalence among HIVST participants (9.0 %) than facility HTC participants (range 11.2 %-31.5 %). Simi-larly, the mean provider costs per HIV positive individual assessed for ART eligibility (facility range US$37.73 to US$92.38) and initiated on ART (facility range US$85.75 to US$132.42) were also lower at the three health facilities than for HIVST (range US$165.14-US$233.90 for eligibil-ity assessment and US$319.67 for ART initiation).
At the three health facilities, staff salaries accounted for between 11.1 % and 17.9 % of the total International Dollar provider costs; the values for staff training varied between 0.5 % and 1.1 %, monitoring and evaluation between 4.2 % and 11.9 %, and consumables and equipment between 65.5 % and 70.5 %. In comparison, for the HIVST service staff salaries accounted for 30.3 %, staff training for 13.0 %, monitoring and evaluation for 20.8 %, and consumables and equipment for 35.9 % of the total International Dollar provider cost.
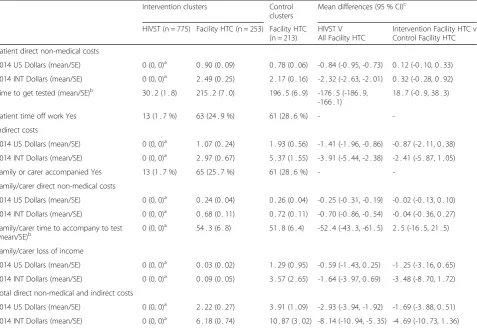
Table 3 shows the time inputs, and direct non-medical and indirect costs, associated with accessing either modality of HTC. Most individuals who self-tested did not incur any costs, need a family member or carer to accompany them, or take time off work. Approximately 26.6 % (124/466) of all facility testers reported taking time off work to get tested, and 27 % (126/466) needed a
family member or carer to accompany them to the testing facility. In comparison to HIVST, facility-HTC partici-pants incurred a mean additional direct non-medical cost of US$0.84 (bootstrap 95 % CI: US$0.73-US$0.95), whilst indirect costs were elevated by an average of $1.41 (boot-strap 95 % CI: US$0.84-US$1.98) with the testing process taking an additional 177.5 minutes (95 % CI: 165.8-187.2). The mean combined direct non-medical and indirect cost of facility-HTC was US$2.93 (bootstrap 95 % CI: US$1.90-US$3.96) higher than for HIVST.
The mean societal cost per participant tested for facility-HTC was US$11.84 (95 % CI: US$10.81-12.86) compared to US$9.23 (95 % CI: US$9.14-US$9.32) for HIVST. In the multivariate analysis (Table 4), after adjusting for individ-ual characteristics and HIV test result, the mean societal cost of HTC was US$2.38 (95 % CI: US$0.87-US$3.89) lower for HIVST than for facility-HTC.
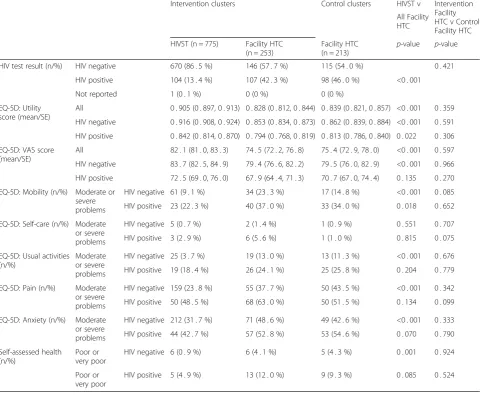
The HIV test result and HRQoL outcomes are sum-marized in Table 5. There was no significant difference between facility testers who resided in the intervention
Table 1Characteristics of HIV testers
Intervention clusters Control clusters p-valuea HIVST Facility HTC Facility HTC
All 775 253 213
Sex Male 288 (37 . 2 %) 90 (35 . 6 %) 76 (35 . 7 %) 0 . 981
Age (years) 18-24 316 (40 . 8 %) 64 (25 . 3 %) 64 (30 . 0 %) 0 . 335
25-39 379 (48 . 9 %) 149 (58 . 9 %) 111 (52 . 1 %)
40+ 80 (10 . 3 %) 40 (15 . 8 %) 28 (17 . 8 %)
Marital status Single (never-married) 227 (29 . 3 %) 40 (15 . 8 %) 26 (12 . 2 %) 0 . 606 Married/Cohabiting 455 (58 . 7 %) 175 (69 . 2 %) 148 (69 . 5 %)
Separated/Divorced 78 (10 . 1 %) 24 (9 . 5 %) 24 (11 . 3 %)
Widower/Widow 15 (1 . 9 %) 14 (5 . 5 %) 15 (7 . 0 %)
Educational attainmentb Up to standard 8 300 (38 . 7 %) 132 (52 . 2 %) 124 (58 . 2 %) 0 . 402
Up to form 6 442 (57 . 0 %) 113 (44 . 7 %) 82 (38 . 5 %)
University or training college 32 (4 . 1 %) 8 (3 . 2 %) 7 (3 . 3 %)
Incomec Not working 400 (51 . 6 %) 93 (36 . 8 %) 86 (40 . 4 %) 0 . 752
Up to 4,000 Kwacha/week 162 (20 . 9 %) 79 (31 . 2 %) 56 (36 . 3 %) 4,000 to 8,000 kwacha/week 108 (13 . 9 %) 42 (16 . 6 %) 34 (16 . 0 %) 8,000 to 12,000 kwacha/week 48 (6 . 2 %) 18 (7 . 1 %) 15 (7 . 0 %) Over 12,000 kwacha/week 57 (7 . 4 %) 21 (8 . 3 %) 22 (10 . 3 %)
Employment status Formal employment 139 (17 . 9 %) 75 (29 . 6 %) 62 (29 . 1 %) 0 . 801
Informal employment/Unemployed 234 (30 . 2 %) 85 (33 . 6 %) 67 (31 . 5 %) School/University 159 (20 . 5 %) 18 (7 . 1 %) 15 (7 . 0 %)
Retired 2 (0 . 4 %) 1 (0 . 4 %) 1 (0 . 5 %)
Housework 238 (30 . 7 %) 72 (28 . 5 %) 68 (31 . 9 %)
Sick leave 2 (0 . 3 %) 2 (0 . 8 %) 0 (0 %)
Socio-economic positiond Highest quintile 172 (22 . 2 %) 32 (12 . 6 %) 43 (20 . 2 %) 0 . 239 2nd highest quintile 154 (19 . 9 %) 55 (21 . 7 %) 39 (18 . 3 %)
Middle quintile 148 (19 . 1 %) 58 (22 . 9 %) 42 (19 . 7 %) 2nd lowest quintile 145 (18 . 7 %) 55 (21 . 7 %) 48 (22 . 5 %) Lowest quintile 154 (19 . 9 %) 53 (20 . 9 %) 41 (19 . 2 %)
Had HIV testing in last year Not tested 127 (16 . 4 %) 96 (38 . 0 %) 97 (45 . 5 %) 0 . 048
Tested once 260 (33 . 5 %) 69 (27 . 3 %) 64 (30 . 0 %)
Tested >1 388 (50 . 1 %) 88 (34 . 8 %) 52 (24 . 4 %)
a
Comparison between facility testers in control and Intervention clusters
b
Up to Standard 8 equivalent to completing Primary school; Up to form 6 equivalent to completing Secondary/High school
c
426 Malawian Kwacha = US$1 in 2014
d
Socio-economic position estimated though undertaking principal component analysis of responses to asset ownership and housing environment Missing data for Educational attainment: 1; missing data for socio-economic position: 2
and control clusters with regards to the mean EQ-5D utility score, the mean VAS score, the descriptive com-ponents of the EQ-5D measure or their responses to the SAH measure. A significantly smaller proportion of HIVST participants who tested HIV negative reported problems in four of the five EQ-5D dimensions than compared to facility testers who tested HIV negative (p < 0.001 for all dimensions excluding“usual activities”).
The mean EQ-5D utility score was higher amongst HIVST participants (0.905, 95 % CI: 0.897-0.913) than among facility testers residing in the intervention (0.828, 95 % CI: 0.812-0.844) or control (0.839, 95 % CI: 0.821-0.857) clusters. The mean VAS score for HIVST partici-pants was also higher (82.1, 95 % CI: 81.0-83.3) than for facility-HTC participants residing in the intervention (74.5, 95 % CI: 72.2-76.8) or control (75.4, 95 % CI: 72.9-78.0) clusters.
In the multivariate analysis, the model diagnostics showed that the OLS estimator performed as well or better than the other estimators (Table 6). In the fully adjusted OLS model, the mean EQ-5D utility score was 0.046 (95 % CI: 0.022-0.070) higher in individuals who accessed HIVST than those who accessed facility-HTC. In those who tested HIV positive the adjusted mean EQ-5D utility score was 0.048 (95 % CI: 0.024-0.072) lower than in those who tested HIV negative. There were no significant differences in the adjusted mean EQ-5D util-ity scores between facilutil-ity testers who resided in the control or intervention clusters.
In the sensitivity analyses, when the UK tariff was used to derive 5D utility scores, the adjusted mean EQ-5D utility score was 0.059 (95 % CI: 0.026-0.093) higher amongst HIVST participants than among facility testers (Table 6). In addition, those reporting a positive HIV test
result had an even lower mean adjusted utility score compared to those who reported a negative HIV test result (mean decrement 0.068; 95 % CI: 0.031-0.105). Additional file 1 shows that the total societal cost of HIVST remained lower than for facility-HTC when alter-native approaches to valuing loss of income were utilised.
Discussion
In this study we found that, compared to facility-based HIV testing, HIVST reached a population who reported better health-related quality of life, with users incurring lower direct non-medical costs and work absences, whilst the direct health provider costs of offering HIVST were comparable to facility-based HTC. Consequently, from the societal perspective, the cost of providing HIVST was found to be significantly lower than facility-based HTC services. However, HIVST was costlier than facility-based HTC for identifying HIV positive individ-uals for treatment, as is typical for community-based services where HIV prevalence tends to be lower than in facilities [11, 12].
In the parent trial, uptake of HIVST was >70 % of all adult residents each year for two years [15], significantly greater than current use of facility-based HTC services in Africa [4]. However, the HIV prevalence amongst those accessing HIVST was lower, and fewer of those di-agnosed HIV positive through HIVST linked into HIV treatment services than through facility-based HTC. Despite these limitations, well targeted community-based HTC services are considered essential to reaching UNAIDS 90-90-90 targets, due to low uptake of facility-based testing by men, adolescents, remote communities and key populations [4, 12]. In this context, our data support HIVST as a potentially affordable approach to
Table 2Annual direct health provider costs of HIV testing and counselling
Ndirande clinic Chilomoni clinic QECH HTC clinica HIVST service
Cost category US Dollars
(2014)
INT Dollars (2014)
% of
Totalb US Dollars(2014) INT Dollars(2014) % ofTotalb US Dollars(2014) INT Dollars(2014) % ofTotalb US Dollars(2014) INT Dollars(2014) % ofTotalb
Staff salaries 6,738 24,545 17 . 9 % 6,433 15,019 11 . 1 % 8,710 24,195 12 . 5 % 23,066 79,431 30 . 3 %
Staff training 353 982 0 . 7 % 530 1,472 1 . 1 % 353 982 0 . 5 % 12,268 34,077 13 . 0 %
Monitoring and evaluation 2,098 5,828 4 . 3 % 5,785 16,069 11 . 9 % 2,920 8,111 4 . 2 % 15,833 54,521 20 . 8 %
Consumables and equipment 38,453 96,475 70 . 5 % 40,910 94,070 69 . 6 % 60,324 126,995 65 . 5 % 82,133 94,051 35 . 9 %
Capital/Overheads 3,257 9,047 6 . 6 % 3,102 8,618 6 . 4 % 12,129 33,691 17 . 4 % 0 0 0
Total annual health provider cost
50,899 136,876 56,760 135,248 84,436 193,973 133,300 262,080
Individuals tested 6759 5372 9488 15190
Direct cost per individual tested 7 . 53 20 . 25 10 . 57 25 . 18 8 . 90 20 . 44 8 . 78 17 . 25
HIV positive identified 756 743 2984 1367c
Direct cost per HIV positive identified
67 . 33 181 . 05 76 . 39 182 . 03 28 . 30 65 . 00 97 . 50 191 . 70
Direct cost per HIV positive individuals assessed for ART eligibility
83 . 48 224 . 51 92 . 38 220 . 13 37 . 73 86 . 67 165.14 324.67
(173.05)d (340.23)d
(233.90)e (459.86)e
Direct cost per HIV positive initiated onto ART
109 . 85 295 . 40 132 . 42 315 . 52 85 . 75 196 . 98 319.67 628.50
a
Outpatient HIV Testing and counselling clinic at Queen Elizabeth Central Hospital b
Percentages based on costs estimated in International Dollars c
Estimated from HIV prevalence reported in main trial d
High linkage rate (56.3 %) from main trial used to estimate cost per individual assessed for ART eligibility [15] e
Low linkage rate (41.7 %) from main trial used to estimate cost per individual assessed for ART eligibility [15]
Mahesw
aran
et
al.
BMC
Medicine
(2016) 14:34
Page
7
of
providing community services, with high uptake [15] and provider costs (US$8.78 per HIVST episode in 2014 prices) similar to or lower than mobile or home-based HTC (US$7.77 to US$33.54 in 2012 prices) [11]. The higher health provider cost per HIV positive individual initiated onto ART through HIVST highlights the need
to consider complementary low-cost interventions that increase linkage into HIV services after HIVST.
The relatively high current cost of the oral fluid RDT kits (USD$4, or US$4.80 including shipping and insur-ance), compared to US$0.69 for standard finger-prick RDT kits used in health facilities, explains much of the
Table 3Direct non-medical and indirect costs and time inputs
Intervention clusters Control clusters
Mean differences (95 % CI)c
HIVST (n = 775) Facility HTC (n = 253) Facility HTC (n = 213)
HIVST V All Facility HTC
Intervention Facility HTC v Control Facility HTC Patient direct non-medical costs
2014 US Dollars (mean/SE) 0 (0, 0)a 0 . 90 (0 . 09) 0 . 78 (0 . 06) -0 . 84 (-0 . 95, -0 . 73) 0 . 12 (-0 . 10, 0 . 33) 2014 INT Dollars (mean/SE) 0 (0, 0)a 2 . 49 (0 . 25) 2 . 17 (0 . 16) -2 . 32 (-2 . 63, -2 . 01) 0 . 32 (-0 . 28, 0 . 92) Time to get tested (mean/SE)b 30 . 2 (1 . 8) 215 . 2 (7 . 0) 196 . 5 (6 . 9) -176 . 5 (-186 . 9,
-166 . 1)
18 . 7 (-0 . 9, 38 . 3)
Patient time off work Yes 13 (1 . 7 %) 63 (24 . 9 %) 61 (28 . 6 %) -
-Indirect costs
2014 US Dollars (mean/SE) 0 (0, 0)a 1 . 07 (0 . 24) 1 . 93 (0 . 56) -1 . 41 (-1 . 96, -0 . 86) -0 . 87 (-2 . 11, 0 . 38) 2014 INT Dollars (mean/SE) 0 (0, 0)a 2 . 97 (0 . 67) 5 . 37 (1 . 55) -3 . 91 (-5 . 44, -2 . 38) -2 . 41 (-5 . 87, 1 . 05) Family or carer accompanied Yes 13 (1 . 7 %) 65 (25 . 7 %) 61 (28 . 6 %) -
-Family/carer direct non-medical costs
2014 US Dollars (mean/SE) 0 (0, 0)a 0 . 24 (0 . 04) 0 . 26 (0 . 04) -0 . 25 (-0 . 31, -0 . 19) -0 . 02 (-0 . 13, 0 . 10) 2014 INT Dollars (mean/SE) 0 (0, 0)a 0 . 68 (0 . 11) 0 . 72 (0 . 11) -0 . 70 (-0 . 86, -0 . 54) -0 . 04 (-0 . 36, 0 . 27) Family/carer time to accompany to test
(mean/SE)b 0 (0, 0)
a
54 . 3 (6 . 8) 51 . 8 (6 . 4) -52 . 4 (-43 . 3, -61 . 5) 2 . 5 (-16 . 5, 21 . 5)
Family/carer loss of income
2014 US Dollars (mean/SE) 0 (0, 0)a 0 . 03 (0 . 02) 1 . 29 (0 . 95) -0 . 59 (-1 . 43, 0 . 25) -1 . 25 (-3 . 16, 0 . 65) 2014 INT Dollars (mean/SE) 0 (0, 0)a 0 . 09 (0 . 05) 3 . 57 (2 . 65) -1 . 64 (-3 . 97, 0 . 69) -3 . 48 (-8 . 70, 1 . 72) Total direct non-medical and indirect costs
2014 US Dollars (mean/SE) 0 (0, 0)a 2 . 22 (0 . 27) 3 . 91 (1 . 09) -2 . 93 (-3 . 94, -1 . 92) -1 . 69 (-3 . 88, 0 . 51) 2014 INT Dollars (mean/SE) 0 (0, 0)a 6 . 18 (0 . 74) 10 . 87 (3 . 02) -8 . 14 (-10 . 94, -5 . 35) -4 . 69 (-10 . 73, 1 . 36) SEstandard error
a
Median and IQR reported because of low numbers incurring costs/taking time off work
b
Time measured in minutes and includes travel to and from testing site, waiting time and counselling and testing time
c
Bootstrapped estimates of mean differences and 95 % CI
Table 4Multivariate Analysis exploring relationship between modality of HIV testing and total societal cost of testinga
Total societal cost
Model 1 (n = 1240) Model 2 (n = 1237)
2014 US Dollars 2014 INT Dollars 2014 US Dollars 2014 INT Dollars Coef (95 % CI) Coef (95 % CI) Coef (95 % CI) Coef (95 % CI)
Exposure Control clusters: Facility HTC Ref Ref Ref Ref
Intervention clusters: Facility HTC -1 · 45 (-3 · 62, 0 · 73) -4 · 24 (-9 · 99, 1 · 52) -0 · 98 (-2 · 59, 0 · 63) -2 · 97 (-7 · 07, 1 · 13) Intervention clusters: HIVST -3 · 01 (-5 · 14, -0 · 88) -12 · 52 (-18 · 23, -6 · 82) -2 · 38 (-3 · 89, -0 · 87) -10 · 82 (-14 · 79, -6 · 87)
HIV Test Result HIV negative Ref Ref Ref Ref
HIV positive 1 · 19 (-0 · 04, 2 · 41) 2 · 76 (-0 · 29, 5 · 81) 1 · 11 (0 · 24, 1 · 99) 2 · 57 (0 · 41, 4 · 72)
Model 1: adjusted for exposure, HIV test result, age and sex
Model 2: additionally adjusted for marital status, educational attainment, income and wealth quintile
Missing data for HIV test result: 1; missing data for educational attainment: 1; missing data for socio-economic position: 2
a
Table 5Health-related quality of life of HIV testers
Intervention clusters Control clusters HIVST v Intervention Facility HTC v Control Facility HTC All Facility
HTC HIVST (n = 775) Facility HTC
(n = 253)
Facility HTC (n = 213)
p-value p-value
HIV test result (n/%) HIV negative 670 (86 . 5 %) 146 (57 . 7 %) 115 (54 . 0 %) 0 . 421 HIV positive 104 (13 . 4 %) 107 (42 . 3 %) 98 (46 . 0 %) <0 . 001
Not reported 1 (0 . 1 %) 0 (0 %) 0 (0 %)
EQ-5D: Utility score (mean/SE)
All 0 . 905 (0 . 897, 0 . 913) 0 . 828 (0 . 812, 0 . 844) 0 . 839 (0 . 821, 0 . 857) <0 . 001 0 . 359 HIV negative 0 . 916 (0 . 908, 0 . 924) 0 . 853 (0 . 834, 0 . 873) 0 . 862 (0 . 839, 0 . 884) <0 . 001 0 . 591 HIV positive 0 . 842 (0 . 814, 0 . 870) 0 . 794 (0 . 768, 0 . 819) 0 . 813 (0 . 786, 0 . 840) 0 . 022 0 . 306 EQ-5D: VAS score
(mean/SE)
All 82 . 1 (81 . 0, 83 . 3) 74 . 5 (72 . 2, 76 . 8) 75 . 4 (72 . 9, 78 . 0) <0 . 001 0 . 597 HIV negative 83 . 7 (82 . 5, 84 . 9) 79 . 4 (76 . 6, 82 . 2) 79 . 5 (76 . 0, 82 . 9) <0 . 001 0 . 966 HIV positive 72 . 5 (69 . 0, 76 . 0) 67 . 9 (64 . 4, 71 . 3) 70 . 7 (67 . 0, 74 . 4) 0 . 135 0 . 270 EQ-5D: Mobility (n/%) Moderate or
severe problems
HIV negative 61 (9 . 1 %) 34 (23 . 3 %) 17 (14 . 8 %) <0 . 001 0 . 085 HIV positive 23 (22 . 3 %) 40 (37 . 0 %) 33 (34 . 0 %) 0 . 018 0 . 652 EQ-5D: Self-care (n/%) Moderate
or severe problems
HIV negative 5 (0 . 7 %) 2 (1 . 4 %) 1 (0 . 9 %) 0 . 551 0 . 707 HIV positive 3 (2 . 9 %) 6 (5 . 6 %) 1 (1 . 0 %) 0 . 815 0 . 075 EQ-5D: Usual activities
(n/%)
Moderate or severe problems
HIV negative 25 (3 . 7 %) 19 (13 . 0 %) 13 (11 . 3 %) <0 . 001 0 . 676 HIV positive 19 (18 . 4 %) 26 (24 . 1 %) 25 (25 . 8 %) 0 . 204 0 . 779 EQ-5D: Pain (n/%) Moderate
or severe problems
HIV negative 159 (23 . 8 %) 55 (37 . 7 %) 50 (43 . 5 %) <0 . 001 0 . 342 HIV positive 50 (48 . 5 %) 68 (63 . 0 %) 50 (51 . 5 %) 0 . 134 0 . 099 EQ-5D: Anxiety (n/%) Moderate
or severe problems
HIV negative 212 (31 . 7 %) 71 (48 . 6 %) 49 (42 . 6 %) <0 . 001 0 . 333 HIV positive 44 (42 . 7 %) 57 (52 . 8 %) 53 (54 . 6 %) 0 . 070 0 . 790 Self-assessed health
(n/%)
Poor or very poor
HIV negative 6 (0 . 9 %) 6 (4 . 1 %) 5 (4 . 3 %) 0 . 001 0 . 924
Poor or very poor
HIV positive 5 (4 . 9 %) 13 (12 . 0 %) 9 (9 . 3 %) 0 . 085 0 . 524
Table 6Multivariate analysis exploring relationship between modality of HIV testing and EQ-5D utility scoresa
EQ-5D Utility Score (Zimbabwean Tariff) EQ-5D Utility Score (UK Tariff)b
Model 1 (n = 1240) Model 2 (n = 1237) Model 1 (n = 1240) Model 2 (n = 1237) Coef (95 % CI) Coef (95 % CI) Coef (95 % CI) Coef (95 % CI) Mode of HIV
testing
Control clusters: Facility HTC
Ref Ref Ref Ref
Intervention clusters: Facility HTC
-0 · 012 (-0 · 038, 0 · 014) -0 · 011 (-0 · 037, 0 · 015) -0 · 145 (-0 · 055, 0 · 026) -0 · 012 (-0 · 053, 0 · 029)
Intervention clusters: HIVST 0 · 043 (0 · 018, 0 · 068) 0 · 046 (0 · 022, 0 · 070) 0 · 059 (0 · 026, 0 · 092) 0 · 065 (0 · 031, 0 · 099)
HIV test result HIV negative Ref Ref Ref Ref
HIV positive -0 · 054 (-0 · 077, -0 · 031) -0 · 048 (-0 · 073, -0 · 024) -0 · 076 (-0 · 112, -0 · 040) -0 · 068 (-0 · 105, -0 · 031)
Model 1: adjusted for exposure, HIV test result, age and sex
Model 2: additionally adjusted for marital status, educational attainment, income and wealth quintile
Missing data for HIV test result: 1; missing data for educational attainment: 1; missing data for socio-economic position: 2
a
Findings from OLS estimator
b
Findings from sensitivity analysis
variation. In our analysis the cost of oral fluid RDT kits accounted for half of the total cost per individual tested through HIVST, whilst finger-prick RDT kits accounted for only one tenth of the cost of facility-based HIV testing. In 2010 alone, nearly 100 million HIV testing episodes were undertaken in Africa [37]. Given the steady increase in uptake of HTC since then [3], and projected needs to meet global targets [5], manufacturers need to be aware of the massive potential market for low cost, easily useable and disposal HIVST kits. In the meantime, scaling-up HIVST will require donor-provision of self-test kits, ideally with negotiation of lower prices through bulk pro-curement for low- and middle-income countries.
We compared both health provider and societal costs of HIVST and facility-based HTC. Health care costing studies and economic evaluations predominantly adopt a health provider perspective as the findings are used to inform how best to allocate finite health care resources. Taking into account the costs at the societal level in-forms us on the wider impact of healthcare interventions on the economy as a whole, and may explain reasons for sub-optimal uptake by the population served. Previous re-search highlights that high direct non-medical and indir-ect costs act as a deterrent to accessing facility-based HTC services [6, 38, 39]. In comparison to HIVST, we found facility testing was associated with a mean add-itional direct non-medical and indirect cost of US$2.93. In Malawi approximately three-quarters of the population live on less than $2 a day [40]. It is clear that the high cli-ent costs of accessing facility-based HTC are likely to act as a deterrent, and this may partly explain the high levels of uptake of HIVST seen in the main trial [15].
HIV testing and counselling has been provided at health facilities in Africa for over a decade. HIV counsellors at health facilities are experienced in providing HTC, and monitoring and evaluation systems have evolved. In con-trast, HIVST is still in its infancy, with concerns remaining (albeit not supported by current evidence) around potential social harms [41]. Consequently, in the main trial, HIVST was provided through a semi-supervised semi-restricted community distribution model that incurred considerable training and supervision costs: salaries, staff training, and monitoring and evaluation accounted for approximately two-thirds of the cost of delivering HIVST, in comparison to less than one quarter for facility-based HTC. Less costly HIVST distribution models will almost certainly develop as experience accrues (e.g. counselling provided by telephone hotlines), even without the anticipated reduction in the unit cost of kits.
We used the average yield from the HIVST service over the two years in operation to estimate the health provider cost per HIV positive individual identified through HIVST, assuming individuals were offered an-nual HIVST. In the main trial, there was a ‘prevalence
round’ effect, with HIV prevalence amongst self-testers found to be higher in the first year than in the second [15]. It is likely that the costs per HIV positive individual identified will continue to rise over the years of oper-ation as the number of undiagnosed HIV infected indi-viduals in the community falls.
The EQ-5D measure provides two assessments of HRQoL, the EQ-5D utility score and the VAS score. The VAS score reflects individuals’ self-assessment of their health status, whilst the EQ-5D utility score reflects a general population preference for the overall health state delineated across five dimensions with the added benefit that utility scores can inform cost-utility analyses. In our study we found HIV self-testers reported higher VAS scores than those who tested in facility services. HIV self-testers do not have their test result communicated to them by a HIV counsellor, and the higher VAS scores suggests this does not negatively impact on an individ-ual’s HRQoL. Those who self-tested reported higher EQ-5D utility scores than those who accessed facility testing services, even after accounting for differences in HIV test result and socio-demographic characteristics. Previ-ous work from the main trial found the median CD4 count amongst HIV self-testers who initiated ART to be higher than facility-based testers who initiated ART [15]. Moving HIV testing into the community potentially reaches a population whose HIV infection has not ad-vanced sufficiently to result in their attendance at a health facility.
Also notable is that, despite the high uptake of HIVST in the main trial [15], intervention cluster residents con-tinued to access facility-based HTC services, highlighting the complementary nature of the two models of provision. Facility HTC provides services that cannot be replaced in community, such as diagnostic HIV testing for manage-ment of illness (e.g. TB patients) and provider initiated testing for prevention of mother-to-child transmission [42]. In contrast, community-based services are intended to provide healthy individuals with the means of knowing their status on a regular basis, and providing early linkage into HIV treatment and prevention services [14, 15].
health outcomes of HIV positive individuals identified through the two modalities, among other considerations.
Conclusions
HIV testing services in Africa are in urgent need of sub-stantial scale-up. HIVST offers a potential option, and offering it reduces the economic burden on clients. However, enhanced HIVST strategies may be needed to target higher risk individuals or to increase linkage into HIV treatment services amongst those found to be HIV positive. The affordability of HIVST would substantially improve if the costs of HIV self-test kits were lower, or if HIVST could be provided safely and effectively through less restricted and supervised models. Further work is needed to explore the cost-effectiveness of HIVST.
Additional file
Additional file 1:Appendix A.Direct health provider costing methods. Appendix B.Sensitivity Analysis for multivariate regression of total societal cost (Model 2). (DOCX 48 kb)
Competing interests
The authors declare that they have no competing interests.
Authors’contributions
HM conceived and designed the study, conducted cost and statistical analysis and drafted manuscript. SP, AC and ELC supported design of study and data collection tools. SP and AC guided costing and statistical analysis. All authors interpreted the data and prepared the report. All authors read and approved the final manuscript.
Acknowledgements
We thank the community members who participated in the study and the patients and staff at Ndirande Health Centre, Chilomoni Health Centre and Queen Elizabeth Central Hospital in Blantyre. Blantyre District Health Office and the HIV Department of the Ministry of Health of Malawi provided invaluable technical support.
Funding
HM was supported by the Wellcome Trust (grant number: WT097973). PM was supported by the Wellcome Trust (grant number: WT089673). ELC was funded by a Wellcome Trust Senior Research Fellowship in Clinical Science (grant number: WT091769).
Author details
1Division of Health Sciences, University of Warwick Medical School, Gibbet Hill Campus, Coventry CV4 7AL, UK.2Malawi-Liverpool-Wellcome Trust Clinical Research Programme, Blantyre, Malawi.3Department of Public Health and Policy, University of Liverpool, Liverpool, Merseyside L69 3BX, UK. 4Department of Clinical Sciences, Liverpool School of Tropical Medicine, Pembroke Pl, Liverpool L3 5QA, UK.5London School of Hygiene and Tropical Medicine, London, UK.
Received: 15 January 2016 Accepted: 4 February 2016
References
1. Cohen MS, Chen YQ, McCauley M, Gamble T, Hosseinipour MC, Kumarasamy N, et al. Prevention of HIV-1 infection with early antiretroviral therapy. N Engl J Med. 2011;365(6):493–505.
2. Gray RH, Kigozi G, Serwadda D, Makumbi F, Watya S, Nalugoda F, et al. Male circumcision for HIV prevention in men in Rakai, Uganda: a randomised trial. Lancet. 2007;369(9562):657–66.
3. UNAIDS. The Gap Report. 2014. Available at: http://www.unaids.org/en/ resources/campaigns/2014gapreport. (Accessed May 2015).
4. Staveteig S, Wang S, Head S, Bradley S, Nybro E. Demographic patterns of HIV testing uptake in sub-Saharan Africa. DHS Comparative Reports No. 30, In., vol. 15. Calverton: ICF International; 2013.
5. UNAIDS. DIAGNOSTICS ACCESS INITIATIVE to achieve the 90-90-90 treatment target. 2014. http://www.unaids.org/sites/default/files/media_asset/ 20150422_diagnostics_access_initiative.pdf. (Accessed May 2015). 6. Morin SF, Khumalo-Sakutukwa G, Charlebois ED, Routh J, Fritz K, Lane T, et
al. Removing barriers to knowing HIV status: same-day mobile HIV testing in Zimbabwe. J Acquir Immune Defic Syndr. 2006;41(2):218–24.
7. MacPherson P, Corbett EL, Makombe SD, van Oosterhout JJ, Manda E, Choko AT, et al. Determinants and consequences of failure of linkage to antiretroviral therapy at primary care level in Blantyre, Malawi: a prospective cohort study. PLoS One. 2012;7(9):e44794.
8. Wachira J, Kimaiyo S, Ndege S, Mamlin J, Braitstein P. What is the impact of home-based HIV counseling and testing on the clinical status of newly enrolled adults in a large HIV care program in western Kenya? Clinical infectious diseases : an official publication of the Infectious Diseases Society of America. 2012; 54(2):275–281.
9. Leisegang R, Cleary S, Hislop M, Davidse A, Regensberg L, Little F, et al. Early and late direct costs in a Southern African antiretroviral treatment programme: a retrospective cohort analysis. PLoS Med. 2009;6(12):e1000189.
10. Beyrer C, Birx DL, Bekker LG, Barre-Sinoussi F, Cahn P, Dybul MR, et al. The Vancouver Consensus: antiretroviral medicines, medical evidence, and political will. Lancet. 2015;386(9993):505–7.
11. Suthar AB, Ford N, Bachanas PJ, Wong VJ, Rajan JS, Saltzman AK, et al. Towards universal voluntary HIV testing and counselling: a systematic review and meta-analysis of community-based approaches. PLoS Med. 2013;10(8):e1001496. 12. Sharma M, Ying R, Tarr G, Barnabas R. Systematic review and meta-analysis
of community and facility-based HIV testing to address linkage to care gaps in sub-Saharan Africa. Nature. 2015;528(7580):S77–85.
13. Choko AT, Desmond N, Webb EL, Chavula K, Napierala-Mavedzenge S, Gaydos CA, et al. The uptake and accuracy of oral kits for HIV self-testing in high HIV prevalence setting: a cross-sectional feasibility study in Blantyre, Malawi. PLoS Med. 2011;8(10):e1001102.
14. MacPherson P, Lalloo DG, Webb EL, Maheswaran H, Choko AT, Makombe SD, et al. Effect of optional home initiation of HIV care following HIV self-testing on antiretroviral therapy initiation among adults in Malawi: a randomized clinical trial. JAMA. 2014;312(4):372–9.
15. Choko AT, MacPherson P, Webb EL, Willey BA, Feasy H, Sambakunsi R, et al. Uptake, accuracy, safety, and linkage into care over two years of promoting annual self-testing for HIV in Blantyre, Malawi: a community-based prospective study. PLoS Med. 2015;12(9):e1001873.
16. Corbett EL. Intensified HIV/TB prevention linking home-based HIV testing, including the option of self-testing, with HIV care: a cluster-randomised trial in Blantyre, Malawi. http://www.controlled-trials.com/ISRCTN02004005/ ISRCTN02004005.
17. MacPherson P, Choko AT, Webb EL, Thindwa D, Squire SB, Sambakunsi R, et al. Development and validation of a global positioning system–based“Map Book”system for categorizing cluster residency status of community members living in high-density urban slums in Blantyre, Malawi. Am J Epidemiol. 2013;177(10):1143–7.
18. UNAIDS. Manual for costing HIV facilities and services. 2011. Available at: http://www.unaids.org/sites/default/files/en/media/unaids/contentassets/ documents/document/2011/20110523_manual_costing_HIV_facilities_en. pdf. (Accessed May 2014).
19. Drummond MF, Sculpher MJ, Torrance GW. Methods for the economic evaluation of health care programmes. New York, USA: Oxford University Press; 2005.
20. Pritchard C, Sculpher M. Productivity costs: principles and practice in economic evaluation: Office of Health Economics, London; 2000. Available at:https://www.ohe.org/publications/productivity-costs-principles-and-practice-economic-evaluation. (Accessed May 2015).
21. Evans DB, Edejer TT, Adam T, Lim SS. Methods to assess the costs and health effects of interventions for improving health in developing countries. BMJ. 2005;331(7525):1137–40.
22. Idler EL, Benyamini Y. Self-rated health and mortality: a review of twenty-seven community studies. J Health Soc Behav. 1997;38(1):21–37.
23. Macpherson P, Lalloo DG, Thindwa D, Webb EL, Squire SB, Chipungu GA, et al. A novel community health worker tool outperforms WHO clinical staging
for assessment of antiretroviral therapy eligibility in a resource-limited setting. J Acquir Immune Defic Syndr. 2014;65(2):e74–8.
24. Dolan P. Modeling valuations for EuroQol health states. Med Care. 1997;35(11): 1095–108.
25. EuroQol. EQ-5D-3L User guide. http://www.euroqol.org/fileadmin/user_ upload/Documenten/PDF/Folders_Flyers/EQ-5D-3L_UserGuide_2015.pdf. (Accessed September 2013).
26. EuroQol G. EuroQol–a new facility for the measurement of health-related quality of life. Health Policy. 1990;16(3):199–208.
27. Jelsma J, Hansen K, De Weerdt W, De Cock P, Kind P. How do Zimbabweans value health states? Popul Health Metr. 2003;1(1):11.
28. Filmer D, Pritchett LH. Estimating wealth effects without expenditure data– or tears: an application to educational enrollments in states of India. Demography. 2001;38(1):115–32.
29. Thompson SG, Barber JA. How should cost data in pragmatic randomised trials be analysed? BMJ. 2000;320(7243):1197–200.
30. Barber J, Thompson S. Multiple regression of cost data: use of generalised linear models. J Health Serv Res Policy. 2004;9(4):197–204.
31. Manning WG, Mullahy J. Estimating log models: to transform or not to transform? J Health Econ. 2001;20(4):461–94.
32. Powell JL. Least absolute deviations estimation for the censored regression model. J Econ. 1984;25(3):303–25.
33. Austin PC, Escobar M, Kopec JA. The use of the Tobit model for analyzing measures of health status. Qual Life Res. 2000;9(8):901–10.
34. Papke LE, Wooldridge JM. Econometric methods for fractional response variables with an application to 401 (K) plan participation rates. J Appl Econ. 1996;11(6):619–32.
35. Stangl AL, Wamai N, Mermin J, Awor AC, Bunnell RE. Trends and predictors of quality of life among HIV-infected adults taking highly active antiretroviral therapy in rural Uganda. AIDS Care. 2007;19(5):626–36. 36. Dolan P, Gudex C, Kind P, Williams A. The time trade-off method: results
from a general population study. Health Econ. 1996;5(2):141–54. 37. WHO. Global HIV/AIDS response: epidemic update and health sector progress
towards universal access: progress report 2011. http://whqlibdoc.who.int/ publications/2011/9789241502986_eng.pdf?ua=1. (Accessed May 2014). 38. Wolff B, Nyanzi B, Katongole G, Ssesanga D, Ruberantwari A, Whitworth J.
Evaluation of a home-based voluntary counselling and testing intervention in rural Uganda. Health Policy Plan. 2005;20(2):109–16.
39. Wringe A, Roura M, Urassa M, Busza J, Athanas V, Zaba B. Doubts, denial and divine intervention: understanding delayed attendance and poor retention rates at a HIV treatment programme in rural Tanzania. AIDS Care. 2009;21(5):632–7.
40. World Bank. Poverty. http://povertydata.worldbank.org/poverty/country/ MWI. (Accessed March 2015).
41. Scott PA. Unsupervised self-testing as part public health screening for HIV in resource-poor environments: some ethical considerations. AIDS Behav. 2014;18 Suppl 4:S438–44.
42. Hensen B, Baggaley R, Wong VJ, Grabbe KL, Shaffer N, Lo YR, et al. Universal voluntary HIV testing in antenatal care settings: a review of the contribution of provider-initiated testing & counselling. Trop Med Int Health. 2012;17(1):59–70.
• We accept pre-submission inquiries
• Our selector tool helps you to find the most relevant journal
• We provide round the clock customer support
• Convenient online submission
• Thorough peer review
• Inclusion in PubMed and all major indexing services
• Maximum visibility for your research
Submit your manuscript at www.biomedcentral.com/submit