Caenorhabditis elegans
Egg-Laying Detection
and Behavior Study Using Image Analysis
Wei Geng
Department of Electrical and Computer Engineering, University of California at San Diego, La Jolla, CA 92093-0407, USA
Email:wei [email protected]
Pamela Cosman
Department of Electrical and Computer Engineering, University of California at San Diego, La Jolla, CA 92093-0407, USA
Email:[email protected]
Megan Palm
Division of Biological Sciences, University of California at San Diego, La Jolla, CA 92093-0349, USA Email:[email protected]
William R. Schafer
Division of Biological Sciences, University of California at San Diego, La Jolla, CA 92093-0349, USA Email:[email protected]
Received 15 January 2004; Revised 26 July 2004
Egg laying is an important phase of the life cycle of the nematodeCaenorhabditis elegans (C. elegans). Previous studies examined egg-laying events manually. This paper presents a method for automatic detection of egg-laying onset using deformable template matching and other morphological image analysis techniques. Some behavioral changes surrounding egg-laying events are also studied. The results demonstrate that the computer vision tools and the algorithm developed here can be effectively used to study C. elegansegg-laying behaviors. The algorithm developed is an essential part of a machine-vision system forC. eleganstracking and behavioral analysis.
Keywords and phrases:egg-laying,C. elegans, behaviors, image analysis, deformable template matching, computer vision.
1. INTRODUCTION
The nematodeCaenorhabditis elegans (C. elegans)is widely used for genetic studies of development, cell biology, and gene regulation. In particular, because of its facile genet-ics, well-described nervous system, and complete genome se-quence, it is particularly well suited to analysis of the molec-ular and cellmolec-ular basis of nervous system function and devel-opment. The ability to functionally map the influence of par-ticular genes to specific behavioral phenotypes makes it pos-sible to use genetic analysis to functionally dissect the molec-ular mechanisms underlying poorly understood aspects of nervous system function such as addiction, learning, and
This is an open access article distributed under the Creative Commons Attribution License, which permits unrestricted use, distribution, and reproduction in any medium, provided the original work is properly cited.
sensory perception. However, many genes with critical roles in neuronal function have effects on behavior that are diffi-cult to describe precisely, or occur over time scales too long to be compatible with real-time scoring by a human observer. Therefore, to fully realize the potential ofC. elegansfor the genetic analysis of the nervous system function, it is neces-sary to develop sophisticated methods for the rapid and con-sistent quantitation of mutant phenotypes, especially those related to behavior.
which eggs are retained. This egg-laying pattern can be accu-rately modeled as a three-parameter probabilistic process in which animals fluctuate between discrete inactive, active, and egg-laying states [2]. Egg laying has also been shown to be coordinated with locomotion: specifically, animals undergo a transient increase in global speed immediately before each egg-laying event [3]. Many neurotransmitters and neuronal signal transduction pathways have been shown to have spe-cific effects on egg-laying behavior; thus it has become an important behavioral assay for the analysis of many neuro-biological problems inC. elegans.
Computer vision tools [4,5,6] have been used success-fully in recording, tracking, defining, and classifyingC. el-egans morphology and locomotion behaviors. Because egg laying is infrequent, it is well suited for analysis by au-tomated imaging methods. In previous egg-laying studies [2,3,7, 8], individual worm movements were videotaped and the centroid location and time information were saved at 1-second intervals during recording. The entire videos were later played back and each video frame was examined by ex-pert observers to look for egg and egg onset frames. In this paper, we present an algorithm that can identify eggs and egg onsets automatically. In addition, by combining this infor-mation with the features (locomotion, morphology, behav-ior, shape) extracted using our previously developed com-puter vision methods, we are able to uncover relationships between egg-laying events and other characteristics.
2. IMAGE ACQUISITION AND SEGMENTATION
2.1. Acquisition of the video images
Routine culturing ofC. eleganswas performed as described in [9]. All worms analyzed in these experiments were young adults; fourth-stage larvae were picked the evening before the experiment and tracked the following morning after cultiva-tion at 22◦. All animals used in this study were from the wild-type Bristol (N2) strain.
C. eleganslocomotion was tracked with a stereomicro-scope mounted with a CCD video camera [4, 5, 6]. The video camera used only a single eyepiece, and so did not have stereo data; the system is equivalent to a conventional bright-field microscope. A computer-controlled tracker was used to maintain the worms in the center of the optical field of the microscope during observation. To record the locomotion of an animal, an image frame of the animal was snapped every 0.5 second for at least five minutes (20 minutes or more in the longer recordings). Among those image pixels with val-ues less than or equal to the average value minus three times the standard deviation, the largest connected component was found. The image was then trimmed to the smallest axis-aligned rectangle that contained this component, and saved as eight-bit grayscale data. The dimensions of each image and the coordinates of the upper-left corner of the bounding box surrounding the image were also saved simultaneously as the references for the location of an animal in the tracker field at the corresponding time point when the images are snapped. The microscope was fixed to its largest magnification (50 X)
during operation. Depending on the type and the posture of a worm, the number of pixels per trimmed image frame varied. The number of pixels per millimeter was fixed at 312.5 pixel/mm for all worms.
2.2. Segmentation and tracking of the worm body
The segmentation process is presented in [6]. Briefly, an adaptive local thresholding algorithm with a 5×5 moving window was used followed by a morphological closing oper-ator (binary dilations followed by erosions). A correspond-ing reference binary image was also generated by fillcorrespond-ing the holes inside a worm body based on image content informa-tion. The difference between these two binary images pro-vided a good indication of which image areas are worm body and which are background.
Following binarization, a morphological skeleton was obtained by applying a skeletonizing algorithm. Redundant pixels on the skeleton were eliminated by thinning. To avoid branches on the ends of skeletons, the skeleton was first shrunk from all its end points simultaneously until only two end points were left. These two end points represent the longest end-to-end path on the skeleton. A clean skeleton can then be obtained by growing out these two remaining end points along the unpruned skeleton by repeating a dilation operation.
The tracking algorithm is presented in [6], and included automatic recognition of the head and tail for the worm in-side each frame.
3. MODEL-BASED ATTACHED EGG DETECTION
3.1. Image analysis
Input video frame
Segmentation
Skeletonizing
Is width abnormal?
Isolate the body area containing the abnormal width
Extract two sides of worm body
Egg side?
RegionΩgrowing from the peak location(s)
Deformable template matching resultU
IsU >threshold?
Record egg and center
locations No egg in this frame Yes
Yes
No No
Left Both Right
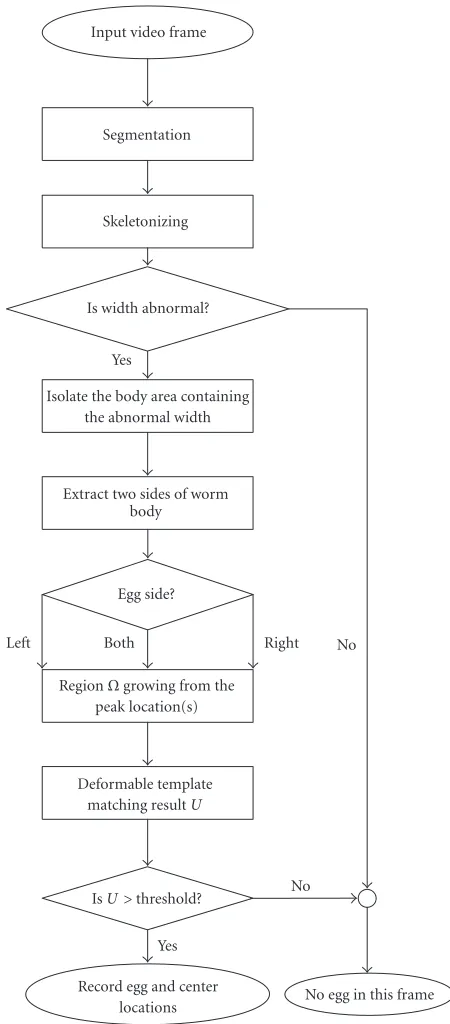
Figure1: Flowchart of the egg detection process.
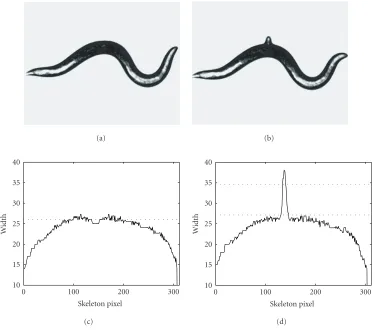
potential egg event.Figure 2ashows the frame immediately prior to an egg-laying event.Figure 2bshows the egg-laying frame. The corresponding width profiles are shown in Fig-ures2cand2d, respectively. The solid curves show the width measured along the worm skeletons. The horizontal dotted lines in Figures 2c and2dshow the median width for the middle part of the worm body. A second horizontal line in Figure 2dshows the threshold (7.5 pixels above the median width value) that defines abnormal width. The width-profile
curves are normalized to 300 pixels for comparison. Since egg laying is a rare event, over 90% of the frames are quickly passed through and not subject to further analysis.
Since the abnormal width measure cannot tell us on which side the egg is (which end point the egg encloses), we extract the boundary from both sides of the worm body and consider the side that has higher k-curvature values to be the egg side. This way, the search area is constrained to only one side of the worm body and half of the search area is effectively eliminated. The process starts with isolating the body area containing the abnormal width by cutting offthe worm body area, that is, 25 pixels/80µm before and after us-ing the minimal-distance straight lines passus-ing through the skeleton pixels. This cutoffarea is 51 pixels/160µm in me-dial axis and has four boundaries. Two of the boundaries are the straight cutofflines, and the other two are the two sides of the worm body (Figure 3b). A boundary-following algo-rithm similar to the one in [10] is then used to extract the two boundaries along the sides of the worm body (Figure 3c). The k-curvature (k = [3, 7]) [11] of these two boundaries is calculated, and the boundary that has higher (for all 5 k-curvature measurements) values is designated as the egg side. If neither boundary has all the 5 measurements higher, both sides are checked for eggs. Thek-curvature is defined as R= {(1/(n−1))in=−11θi}, where
θi=arctanxyi+2−yi+1 i+2−xi+1 −
arctan yi+1−yi xi+1−xi
, (1)
and (xi,yi), (xi+1,yi+1),. . .are the locations of consecutive points that are kpixels apart along the worm side bound-aries.
Once the location of the maximal peak is decided, the search regionΩcan be obtained by the region growing out of the egg-side end point to enclose the egg center. A direc-tional dilation algorithm such as the one in [12] can be used for this purpose. Here we once again take advantage of the worm skeleton. The directional dilation is achieved by ap-plying two constraints in the dilation process: (1) dilation starts from the end point and should remain inside the bi-nary worm body; (2) dilation remains outside skeleton area (dilated 4 times from skeleton) (Figure 3d). The dilation pro-cess stops when more than 200 pixels are inside the region. The directional dilation forces the search area to be inside the worm body close to the side boundaries rather than close to the skeleton. The final search regionΩ (Figure 3e) typi-cally contains between 200 and 250 pixels for each frame. In the case that both sides are checked, a total of 400 pixels is checked.Figure 3illustrates the process.
3.2. Deformable template matching
(a) (b)
300 200
100 0
Skeleton pixel 10
15 20 25 30 35 40
W
idth
(c)
300 200
100 0
Skeleton pixel 10
15 20 25 30 35 40
W
idth
(d)
Figure2: Width profile change on egg onset. (a) Gray image right before egg onset. (b) Gray image right after egg onset. (c) Width profile of (a). The dotted line is the median value of the middle part of the width profile. (d) Width profile of (b). The lower dotted line is the median value of the middle part of the width profile. The upper dotted line is 7.5 pixels above the lower dotted line.
They tend to have oval shapes, and are generally brighter in the middle and darker around the boundary. The eggs are more or less similar in size. These characteristics make them ideal for the elliptic deformable templates.
In an ideal case, the shape of the attached eggs can be modeled by an elliptic model such as the one shown in Figure 4with 7 parameters v = (x,y,a,b,θ,ρ1,ρ2), where (x,y) are the coordinates of the center,aandbare the semi-axes, andθis the rotation angle. Together, these 5 parameters control the geometric shape and location of the inner ellipse that captures the bright center part of the egg.ρ1 equals the ratio between the area of the middle band and the inner el-lipse,ρ2 equals the ratio between the area of the outer band and the middle ellipse. The middle band encloses the dark exterior part of the egg. The outer band covers part of the worm body and part of the background. By studying the ho-mogeneity of the pixels enclosed, the outer band can be used to suppress noise and find the best location for the egg. For example, if (x,y) is mistakenly inside the worm body, then the outer band will have similar brightness to the worm body (dark). If (x,y) is in the background area, the outer band has similar brightness to the background (light). Half worm body and half background inside the outer band indicate
a perfect attached egg location. To reduce model complexity, we opt to use a simplified model (Figure 5) that does not have the outer band, and use image analysis to restrain the search area. The outer band inFigure 4is only used for deletion pur-poses when multiple eggs/peaks are detected. In these cases, the pixels inside the entire outer ellipse are deleted and the process is repeated to detect additional eggs. The outer band is also shown in Figures3,7, and8to mark the location of the best-fit ellipse. There are 6 parameters characterizing the shape of the simplified elliptic modelv=(x,y,a,b,θ,ρ).
From a Bayesian framework, we have p(v|E) = p(v)p(E|v)/p(E), whereE is the event that the image con-tains an egg, andp(v|E) is the probability density function of parameter configuration given that an egg is present. There are many ways to define the likelihood function. We propose the following model:
p(E|v)= 1zexp−αµin(v) +βµout(v), (2)
(a) (b)
(c) (d)
(e) (f)
Figure3: Illustration of egg-detection image analysis. (a) Grayscale image. (b) The cutoffportion containing egg. (c) Two boundaries. (d) The highlighted area (gray) shows the dilation of the skeleton four times. This area is not searched for eggs. (e) The highlighted area (white) shows final search region. (f) Best-fit ellipse.
ρ2
ρ1
a b
θ
[x, y]
Figure4: Ellipse egg model.
a proper weight for inside and outside areas. For calculating the mean values, the pixel intensities are linearly rescaled to go from −1 to +1.z is a normalization constant to ensure thatp(E|v) is a proper probability density of unit area.
The egg-finding problem can then be modeled as finding the most likely parameter configurationvoptgiven that there is an egg in the image. Using a maximum a posteriori (MAP) estimator,
vopt=argvmaxp(v|E)=argvmaxp(v)p(E|v)
p(E) . (3)
Since the egg can occur in any orientation and location in
ρ
a b
θ
[x, y]
Figure5: Simplified ellipse egg model.
the search space, it is reasonable to assume a uniform prior. For simplicity, we also assume that aand b are uniformly distributed in a narrow range. So (3) is identical to
vopt=argvmaxp(E|v)
=argvmax1
zexp
−αµin(v) +βµout(v). (4)
Furthermore, becausezis a constant, and we can absorb the minus sign into the parametersαandβ, (4) is identical to
0.06 0.05 0.04 0.03 0.02 0.01 0
False positive rate 0.6
0.65 0.7 0.75 0.8 0.85 0.9 0.95 1
Tr
u
e
p
o
si
ti
ve
ra
te
Figure6: A plot of the receiver operating characteristic (ROC) curve with thresholdtvarying from−1.5 to 1.5.
The optimal parameter configuration is the parametervthat maximizes the function
U(v)=αµin(v) +βµout(v). (6)
We choseα=0.5,β= −1, andρ=8 by feeding a small set of training samples of egg and nonegg values ofµin,µoutinto the classification and regression tree (CART) algorithm [18]. The final model for locating eggs is as follows.
For a specified search spaceΩin the image, find
vopt=xopt,yopt,aopt,bopt,θopt=argvmaxU(v), (7)
whereU=0.5µin(v)−µout(v). NoticeU∈[−1.5, 1.5]. For every pixel (xc,yc) inside the search region Ω,Uis calculated for each configuration with a range (a=[3.4, 3.6], b=[1.9, 2.1],θ=[0, 180]). IfUoptis greater than a threshold valuet, the location (xopt,yopt) is marked as the egg location and an egg is declared found.
3.3. Experimental results
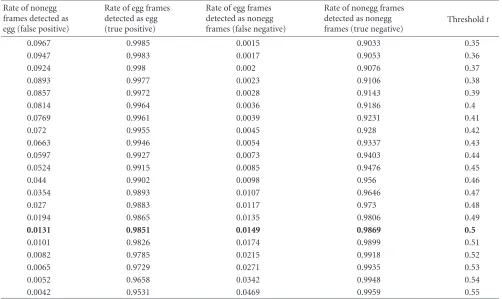
The egg detection algorithm was tested on 1 600 5-minute video sequences from 16 different mutant types (100 videos for each type) and five 20-minute video sequences of wild-type animals treated with serotonin, which causes an increase in egg laying. The data were collected over a 3-year period by different individuals. A laborious manual check found 9 000 frames containing 200 different eggs. These eggs cover a wide variety of recording conditions, mutant types, sizes, and shapes. 100 000 nonegg frames were randomly selected from the rest of the 800 000 frames as nonegg cases. By apply-ing the above algorithm with the decision thresholdtvarying from−1.5 to 1.5, the performance result is shown as an ROC curve [19] inFigure 6andTable 1. The true positive fraction is over 98% when the false positive fraction is 1%.Figure 7 shows some examples of the locations and best-fit ellipses identified by the algorithm. Some failure examples are shown inFigure 8.
4. EGG ONSET DETECTION AND BEHAVIOR STUDY
4.1. Egg onset detection
Egg detection algorithms can be readily incorporated into a broader scheme for egg onset event detection (identifying the frames in which the egg first appears). Figure 9shows one algorithm to accomplish it. The main functions of the egg onset detection routine are to use the single-frame egg detec-tion result for a sequence. First, we decide whether the cur-rent egg is a newly laid or a previously laid egg (worms some-times crawl back to previous eggs). This is accomplished by maintaining a list of all existing locations of eggs. When the new location is not on the list, an egg onset event is detected. Secondly, there are occasions when multiple eggs are laid at the same time. Also, there are cases when multiple width ab-normalities are detected for a single frame due to multiple newly laid and previous laid eggs that remain near the worm body. The egg onset detection routine runs the single-frame egg detection routine repeatedly in the search regions after the detected egg area (outer ellipse in the template model) is removed from the image in each run. This way, clusters of eggs can be detected. The egg onset detection routine also runs the abnormal width detection routine repeatedly to find out new search regions to detect all the eggs attached to the worm body.
Table1: The false positive, true positive, false negative, and true negative values for part of the ROC curve. The boldface row is the final threshold used in the egg onset detection.
Rate of nonegg frames detected as egg (false positive)
Rate of egg frames detected as egg (true positive)
Rate of egg frames detected as nonegg frames (false negative)
Rate of nonegg frames detected as nonegg frames (true negative)
Thresholdt
0.0967 0.9985 0.0015 0.9033 0.35
0.0947 0.9983 0.0017 0.9053 0.36
0.0924 0.998 0.002 0.9076 0.37
0.0893 0.9977 0.0023 0.9106 0.38
0.0857 0.9972 0.0028 0.9143 0.39
0.0814 0.9964 0.0036 0.9186 0.4
0.0769 0.9961 0.0039 0.9231 0.41
0.072 0.9955 0.0045 0.928 0.42
0.0663 0.9946 0.0054 0.9337 0.43
0.0597 0.9927 0.0073 0.9403 0.44
0.0524 0.9915 0.0085 0.9476 0.45
0.044 0.9902 0.0098 0.956 0.46
0.0354 0.9893 0.0107 0.9646 0.47
0.027 0.9883 0.0117 0.973 0.48
0.0194 0.9865 0.0135 0.9806 0.49
0.0131 0.9851 0.0149 0.9869 0.5
0.0101 0.9826 0.0174 0.9899 0.51
0.0082 0.9785 0.0215 0.9918 0.52
0.0065 0.9729 0.0271 0.9935 0.53
0.0052 0.9658 0.0342 0.9948 0.54
0.0042 0.9531 0.0469 0.9959 0.55
4.2. Behavior study
Previous study [3] indicated significantly increasing loco-motion activity prior to egg onset. We studied the behav-ior changes before and after 55 wild-type egg onsets (a fresh 10-hour recording) detected by our onset detection algo-rithm. The behavioral characteristics can be summarized by extracting features proposed by the feature extraction sys-tem [4,5,6]. For each feature, we looked for a significant difference in that feature before and after the onset frame by using the nonparametric rank sum test on paired data. For each of the 55 eggs, we paired the data obtained from the 40 seconds before the onset frame with data after the onset frame. The 253 features examined include 131 mor-phological features (thickness, fatness, MER, angle change rate, etc.), 75 speed features (min, max, average speed over 1, 5, 10, 20, 30, 40 seconds, etc.), 35 texture features (head, tail, center brightness, etc.), and 12 other behavioral features (rate of reversals, omega shape, looping, etc.). Out of these 253 features, 14 were found to be significant at the 0. 01 sig-nificance level as shown inTable 2. We also considered the possibility that some features may be significantly different both before and after egg laying compared to the values for a worm that is not near an egg-laying time. So we also looked at the paired data where the values obtained from the 40 sec-onds before an egg-laying onset were paired with the values from an equal number of frames starting from a randomly
selected nonegg frame, and similarly where the values after an egg-laying onset were paired with the values from an equal number of frames starting from a randomly selected nonegg frame. There were 32 (Table 3) comparisons that were sig-nificant at the 0. 01 significance level before egg onset and 32 after, respectively. We note that, by random chance alone, out of 253 comparisons, we would expect to see 2.5 features showing a significant difference at the 0. 01 significance level. Most of the features found to be significantly different were related to speed, confirming earlier results that were de-termined manually. In particular, we found that the global centroid movement as well as the local movement of the tail and head were all significantly larger before the onset com-pared to after (seeFigure 10). Previous results only consid-ered global movement. Local head movement is often re-lated to foraging behavior. We also found some differences in brightness parameters. Due to the multiplicity of compar-isons being made, these remain to be verified when further data are collected.
5. CONCLUSION
(a) (b)
(c) (d)
(e) (f)
Figure7: Some best-fit results of deformable template matching. Some figures are rotated for plotting. (a) A fully laid egg in perfect condi-tion. (b) A half laid egg. (c), (d) Stacked eggs, identified by repeating the search. (e), (f) Two eggs laid together with close distance.
(a) (b)
(c) (d)
Figure8: Some nonegg frames that are identified as eggs.
the effectiveness of our proposed algorithm. The behavior study of egg onsets confirms the result from previous studies and shows promise for new findings.
Frame 1 Frame 2 Framen
Single-frame egg detection
E
gg/nonegg indicat
or
Eg
g
lo
ca
ti
o
n
E
gg/nonegg indicat
or
Eg
g
lo
ca
ti
o
n
E
gg/nonegg indicat
or
Eg
g
lo
ca
ti
o
n
Egg onset detection
Egg onset 1 Egg onsetk
Figure9: Flowchart of egg onset event detection.
Table2: The features which changed significantly 40 seconds before and after egg onsets.
Features Description
TLMV10MIN Minimal tail movement in 5 s
TLMV10AVG Average tail movement in 5 s
HDMV10AVG Average head movement in 5 s
TLMVHFMIN Minimal tail movement in 0.5 s
HDMV10MAX Maximal head movement in 5 s
REVSALTIM Total percentage of time the worm stays in reversal position
HTBRDMIN Minimal head and tail area brightness difference
HTBRRMIN Minimal head/tail brightness
BANGCRMIN Minimal whole-body-area angle change rate
LNWDRMAX Maximal length-to-width ratio of the bounding box
BANGCRAVG Average whole-body-area angle change rate
TLAMPMAX Maximal amplitude in the tail area
AMPMAX Maximal amplitude of worm skeleton wave
HDTLANMIN Minimal head-to-tail angle
knowledge of certain egg size and shape for a particular mu-tant is present, or the purpose is to obtain a rough idea of whether an egg is present. Secondly, the same applies to the decision criteriontaccording to the expectation of the false positive and the false negative rate. Third, the current algo-rithm was applied on videos with frame rate of 2 Hz. The same algorithms can be applied to videos that have different frame rates. With increased frame rates, we anticipate an im-proved detection result.
With more accurate and complex computer vision sys-tems [4,5,6] being developed, we anticipate that many more behavior features will be discovered. Therefore, we will be able to combine the automatic egg onset detection and be-havior studies together and explore the temporal correlation between egg laying and other behavioral characteristics more effectively. Moreover, the ability to automatically detect egg-laying events will make it possible to use these correlations between other behaviors and egg laying, which previously
could only be assayed through time-consuming human anal-ysis of videotapes [3] as automatically-evaluated features for use in phenotype classification and clustering studies [5].
Table3: The features which changed significantly between 40 seconds before an egg onset and 40 seconds starting from a randomly selected nonegg frame.
Features Description Features Description
HDMVHFMIN Min. head movt. in 1/2 s WHRATMIN Min. width-to-height ratio of MER HDMVHFMAX Max. head movt. in 1/2 s MAJORMIN Min. length of major axis
HDMVHFAVG Avg. head movt. in 1/2 s AMPRMIN Min. amplitude ratio
HDMV10MAX Max. head movt. in 5 s AMPRMAX Max. amplitude ratio
HDMV10AVG Avg. head movt. in 5 s ANCHRMAX Max. angle change rate
HDMV20MAX Max. head movt. in 10 s ANCHSMAX Max. angle change standard deviation HDMV20AVG Avg. head movt. in 10 s CANGCRMIN Min. angle change rate in middle sect. TLMV10MAX Min. tail movt. in 5 s CANGCRMAX Max. angle change rate in middle sect. TLMV10AVG Avg. tail movt. in 5 s CANGCRAVG Avg. angle change rate in middle sect. TLMV20AVG Avg. tail movt. in 10 s BANGCRMAX Max. body angle change rate
RV20MAX Max. reversals in 10 s HDAMPMIN Min. amplitude in head
RV20AVG Avg. reversals in 10 s TLAMPMAX Max. amplitude in tail TOTRV Total reversals in 5 min CNTAMPMIN Min. amplitude in center
REVSALTIM Total percentage of time theworm stays in reversal position AVGAMPMIN Avg. amplitude
TAILBRMIN Min. tail brightness HDTLANMAX Max. head-to-tail angle TAILBRAVG Avg. tail brightness TLANGMAX Max. head-angle change rate
100 50
0 50
100
Time (s) 20
25 30 35 40
Ve
lo
ci
ty
(
µ
m/s)
(a)
100 50
0 50
100
Time (s) 10
15 20
Ve
lo
ci
ty
(
µ
m/s)
(b)
100 50
0 50
100
Time (s) 10
15 20
Ve
lo
ci
ty
(
µ
m/s)
(c)
Figure10: Velocity change 125 seconds before and after egg onset. The velocity is a moving average of 10-second interval. (a) Centroid velocity. (b) Head velocity. (c) Tail velocity.
ACKNOWLEDGMENTS
We thank the Caenorhabditis Genetics Center for strains, Zhaoyang Feng for development and maintenance of the
REFERENCES
[1] J. White, E. Southgate, N. Thomson, and S. Brenner, “The structure of the Caenorhabditis elegans nervous system,” Philosophical Transactions of the Royal Society of London. Se-ries B, Biological Sciences, vol. 314, pp. 1–340, 1986.
[2] L. E. Waggoner, G. T. Zhou, R. W. Schafer, and W. R. Schafer, “Control of alternative behavioral states by serotonin in Caenorhabditis elegans,”Neuron, vol. 21, no. 1, pp. 203– 214, 1998.
[3] L. A. Hardaker, E. Singer, R. Kerr, G. T. Zhou, and W. R. Schafer, “Serotonin modulates locomotory behavior and co-ordinates egg-laying and movement in Caenorhabditis ele-gans,”Journal of Neurobiology, vol. 49, no. 4, pp. 303–313, 2001.
[4] J.-H. Baek, P. Cosman, Z. Feng, J. Silver, and W. R. Schafer, “Using machine vision to analyze and classify Caenorhabditis elegans behavioral phenotypes quantitatively,”Journal of Neu-roscience Methods, vol. 118, no. 1, pp. 9–21, 2002.
[5] W. Geng, P. Cosman, J.-H. Baek, C. C. Berry, and W. R. Schafer, “Quantitative classification and natural clustering of Caenorhabditis elegans behavioral phenotypes,”Genetics, vol. 165, no. 3, pp. 1117–1126, 2003.
[6] W. Geng, P. Cosman, C. C. Berry, Z. Feng, and W. R. Schafer, “Automatic tracking, feature extraction and classification of C. elegans phenotypes,”IEEE Trans. Biomed. Eng., vol. 51, no. 10, pp. 1811–1820, 2004.
[7] L. E. Waggoner, L. A. Hardaker, S. Golik, and W. R. Schafer, “Effect of a neuropeptide gene on behavioral states in Caenorhabditis elegans egg-laying,”Genetics, vol. 154, no. 3, pp. 1181–1192, 2000.
[8] G. T. Zhou, W. R. Schafer, and R. W. Schafer, “A three-state biological point process model and its parameter estimation,” IEEE Trans. Signal Processing, vol. 46, no. 10, pp. 2698–2707, 1998.
[9] S. Brenner, “The genetics of Caenorhabditis elegans,” Genet-ics, vol. 77, no. 1, pp. 71–94, 1974.
[10] M. Sonka, V. Hlavac, and R. Boyle,Image Processing, Anal-ysis, and Machine Vision, Brooks/Cole Publishing Company, Pacific Grove, Calif, USA , Second edition, 1999.
[11] R. Jain, K. Rangachar, and B. Schunck, Machine Vision, McGraw-Hill, New York, NY, USA, 1995.
[12] G. Borgefors, “Distance transformations in digital images,” Computer Vision, Graphics, and Image Processing, vol. 34, no. 3, pp. 344–371, 1986.
[13] T. McInerney and D. Terzopoulos, “Deformable models in medical image analysis: a survey,” Medical Image Analysis, vol. 1, no. 2, pp. 91–108, 1996.
[14] A. K. Jain, Y. Zhong, and M.-P. Dubuisson-Jolly, “Deformable template models: A review,”Signal Processing, vol. 71, no. 2, pp. 109–129, 1998.
[15] A. K. Jain, Y. Zhong, and S. Lakshmanan, “Object matching using deformable templates,”IEEE Trans. Pattern Anal. Ma-chine Intell., vol. 18, no. 3, pp. 267–278, 1996.
[16] F. Escolano, M. Cazorla, D. Gallardo, and R. Rizo, “De-formable templates for tracking and analysis of intravascular ultrasound sequences,” inProc. Energy Minimization Methods in Computer Vision and Pattern Recognition (EMMCVPR ’97), vol. 1223, Venice, Italy, May 1997.
[17] R. Fisker, J. M. Carstensen, M. F. Hansen, F. Bodeker, and S. Morup, “Estimation of nanoparticle size distributions by im-age analysis,”Journal of Nanoparticle Research, vol. 2, no. 3, pp. 267–277, 2000.
[18] L. Breiman, J. Friedman, R. Olshen, and C. Stone, Classifi-cation and Regression Trees, Wadsworth International Group, Belmont, Calif, USA, 1984.
[19] C. E. Metz, “Basic principles of ROC analysis,”Seminars in Nuclear Medicine, vol. 8, no. 4, pp. 283–298, 1978.
[20] C. A. Bastiani, S. Gharib, M. I. Simon, and P. W. Stern-berg, “Caenorhabditis elegans Gq regulates egg-laying behav-ior via a PLCβ-independent and serotonin-dependent signal-ing pathway and likely functions both in the nervous sys-tem and in muscle,”Genetics, vol. 165, no. 4, pp. 1805–1822, 2003.
[21] C. Trent, N. Tsung, and H. R. Horvitz, “Egg-laying defective mutants of the nematode Caenorhabditis elegans,”Genetics, vol. 104, no. 4, pp. 619–647, 1983.
[22] D. Weinshenker, G. Garriga, and J. H. Thomas, “Genetic and pharmacological analysis of neurotransmitters control-ling egg-laying in C. elegans,”Journal of Neuroscience, vol. 15, no. 10, pp. 6975–6985, 1995.
Wei Gengreceived the B.S. degree in com-puter science from Beihang University, Bei-jing, China, in 1993, the M.S. degree from Northeastern University, Boston, Mass, in 1997, and the Ph.D. degree from the Uni-versity of California, San Diego, Calif, in 2004, both in electrical engineering. From 1993 till 1995, he was a Research Assistant at the National Laboratory on Machine Per-ception, Peking University, Beijing, China.
From 1997 till 2001, he was an Embedded Software Engineer at Hewlett-Packard Company, San Diego, Calif. He was a Se-nior Analytical Engineer at ID Analytics Inc., San Diego, Calif, in 2004. He is currently a Director of software engineering at Agile systems Inc., San Diego, Calif. His research interests are in the areas of image analysis and embedded software engineer-ing.
Pamela Cosman obtained her B.S. degree with honors in electrical engineering from the California Institute of Technology in 1987, and her M.S. and Ph.D. degrees in electrical engineering from Stanford Uni-versity in 1989 and 1993, respectively. She was an NSF Postdoctoral Fellow at Stan-ford University and a Visiting Professor at the University of Minnesota during 1993– 1995. In 1995, she joined the faculty of the
Megan Palmis an M.S. student in William Schafer’s laboratory at the University of Cal-ifornia, San Diego, where she received her B.S. degree. She is currently studying the ef-fects of nicotine onC. elegans.
William R. Schafer received the A.B. de-gree in biology (summa cum laude) from Harvard University, Cambridge, Mass, in 1986, and the Ph.D. degree in biochemistry from the University of California, Berke-ley, in 1991. From 1992 till 1995, he was a Life Sciences Research Foundation Postdoc-toral Fellow in the Department of Biochem-istry and Biophysics, University of Califor-nia, San Francisco. Since 1995, he has been