Volume 2007, Article ID 56918,18pages doi:10.1155/2007/56918
Research Article
Classification of Single and Multiple Disturbances in
Electric Signals
Mois ´es Vidal Ribeiro and Jos ´e Luiz Rezende Pereira
Department of Electrical Energy, Federal University of Juiz de Fora, 36 036 330 Juiz de fora, MG, Brazil
Received 19 April 2006; Revised 28 January 2007; Accepted 16 May 2007
Recommended by Pradipta Kishore Dash
This paper discusses and presents a different perspective for classifying single and multiple disturbances in electric signals, such as voltage and current ones. Basically, theprinciple of divide to conqueris applied to decompose the electric signals into what we callprimitive signals or componentsfrom which primitive patterns can be independently recognized. A technique based on such concept is introduced to demonstrate the effectiveness of such idea. This technique decomposes the electric signals into three main primitive components. In each primitive component, fewhigh-order-statistics-(HOS-) based features are extracted. Then, Bayes’ theory-based techniques are applied to verify the ocurrence or not of single or multiple disturbances in the electric signals. The performance analysis carried out on a large number of data indicates that the proposed technique outperforms the performance attained by the technique introduced by He and Starzyk. Additionally, the numerical results verify that the proposed technique is capable of offering interesting results when it is applied to classify several sets of disturbances if one cycle of the main frequency is considered, at least.
Copyright © 2007 M. V. Ribeiro and J. L. R. Pereira. This is an open access article distributed under the Creative Commons Attribution License, which permits unrestricted use, distribution, and reproduction in any medium, provided the original work is properly cited.
1. INTRODUCTION
Recently, a great deal of attention has been drawn to the effi -cient and appropriate use of signal processing and computa-tional intelligence techniques for the development of power-ful tools to characterize, analyze, and evaluate the quality of power systems as well as the behavior of their loads. From a signal processing standpoint, thepower quality(PQ) analysis could be listed in the following foremost topics: (i) distur-bance detection, (ii) disturdistur-bance classification, (iii) source of disturbance identification, (iv) source of disturbance local-ization, (v) signal compression, (vi) parameters estimation, (vii) signal representation or decomposition, and (viii) sig-nal and system behavior predictions.
The classification or recognition topic is an important is-sue for the development of the next generation of PQ mon-itoring equipment. Basically, it refers to the use of signal processing-based technique to extract as few as possible and, at the same time, representative features from the powerline signals, which are supposed to be voltage and current ones, followed by the use of a powerful and a simple technique to classify the detected disturbances.
The purposes of this contribution are (i) the discussion of a formulation that facilitates the classification of single and multiple disturbances in voltage and current signals; we argue that this formulation allows the development of pow-erful and efficient pattern recognition techniques to classify a large number of sets of disturbances; basically, the
princi-ple of divide to conquer, which inspired the detection
tech-nique introduced in [29], is applied to decompose the electric signals into what we callprimitive signalsor primitive com-ponents from which primitive patterns can be recognized easily; and (ii) the discussion of a new disturbance classifi-cation technique that makes use of the proposed formula-tion to classify single and multiple disturbances in electric signals. This technique decomposes the electric signals into three main primitive components. In each primitive compo-nent, fewhigh-order-statistics-(HOS-)based features are ex-tracted. Then, effortless Bayesian classifier, which makes use of normal density function and draws on the HOS-based fea-tures, can be designed to come to light single as well as mul-tiple disturbances. The rationale behind is that each prim-itive component is associated to a reduced and disjoint set of disturbances. Numerical results indicate that the proposed technique not only outperforms previous techniques, such as [2,3], but also provides very interesting results in case of the frame length corresponds to at least one-cycle of the main frequency. This contribution was initially reported in [1] and partially presented in [30,31].
The paper is organized as follows. Section 2 formu-lates the problem of single and multiple disturbances clas-sification. Section 3 discusses the proposed technique, de-rived from the formulation presented inSection 2.Section 4 presents computational results indicating the improved clas-sification performance offered by the proposed technique. Finally, concluding remarks are stated inSection 5.
2. PROBLEM FORMULATION:
SINGLE AND MULTIPLE DISTURBANCES
The discrete version of monitored powerline signals can be divided into nonoverlapped frames ofNsamples. The dis-crete sequence in a frame can be expressed as an additive contribution of several types of phenomena:
x(n)=x(t)|t=nTs:= f(n)+h(n)+i(n)+t(n)+v(n), (1)
wheren=0,. . .,N−1,Ts=1/ fsis the sampling period, the sequences{f(n)},{h(n)},{i(n)},{t(n)}, and{v(n)}denote the power supply signal (or fundamental component), har-monics, interharhar-monics, transient, and background noise, respectively. Each of these signals is defined as follows:
f(n) :=A0(n) cos
2πf0(n) fs n
+θ0(n)
, (2)
h(n) := M
m=1
hm(n), (3)
i(n) := J
j=1
ij(n), (4)
t(n) :=timp(n) +tnot(n) +tcas(n) +tdae(n), (5)
andv(n) is independently and identically distributed (i.i.d.) noise as normal N(0,σ2
v) and independent of {f(n)}, {h(n)},{i(n)}, and{t(n)}.
In (2),A0(n), f0(n), andθ0(n) refer to the magnitude, fundamental frequency, and phase of the power supply sig-nal, respectively. In (3) and (4),hm(n) andij(n) are themth harmonic and thejth inter-harmonic, respectively, which are defined as
hm(n) :=Am(n) cos
2πmf0(n) fs n
+θm(n)
, (6)
ij(n) :=AI,j(n) cos
2πfI,j(n) fs n
+θI,j(n)
. (7)
In (6),Am(n) is the magnitude andθm(n) is the phase of themth harmonic. In (7),AI,j(n), fI,j(n), andθI,j(n) are the magnitude, frequency, and phase of the jth interharmonic, respectively. In (5),timp(n),tnot(n), andtcas(n) represent im-pulsive transients named spikes, notches, decaying oscilla-tions. tdae(n) refers to oscillatory transient named damped exponentials. These transients are expressed by
timp(n) :=
Nimp
i=1
timp,i(n), (8)
tnot(n) :=
Nnot
i=1
tnot,i(n), (9)
tdec(n) :=
Ndec
i=1
Adec,i(n) cos
ωdec,i(n)n+θdec,i(n)
×exp−αdec,i
n−ndec,i
,
(10)
tdam(n) :=
Ndam
i=1
Adam,i(n) exp
−αdam,i
n−ndam,i
, (11)
respectively, wheretimp,i(n) andtimp,i(n) are thenth samples of theith transient named impulsive transient or notch. Note that (10) refers to the capacitor switchings as well as signals resulted from faulted waveforms. Equation (11) defines the decaying exponential as well asdirect current(DC) compo-nents (αdam = 0) generated by geomagnetic disturbances, and so forth.
0 0.02 0.04 0.06 0.08 0.1 Time (s)
−1 0 1
(a)
0 0.02 0.04 0.06 0.08 0.1 Time (s)
−1 0 1
(b)
0 0.02 0.04 0.06 0.08 0.1 Time (s)
−0.5 0 0.5
(c)
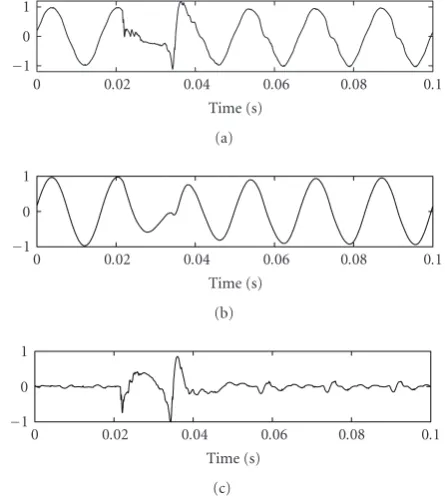
Figure 1: (a) Monitored voltage signal, {x(n)}, (b) fundamen-tal component,{f(n)}, (c) harmonic and transient components, {h(n)}+{u(n)}.
v = [v(n)· · ·v(n−N+ 1)]T is constituted by samples of the additive noise.
It is worth mentioning that low- , medium- , and high-voltage electrical networks present different sets of single and multiple disturbances. As a result, the design of classification technique for each voltage level has to take into account the information and characteristics of these networks to attain a high classification performance. For instance, the sets of dis-turbances in the high-voltage transmission and low-voltage distribution systems differ considerably.
The majority of classification techniques developed so far are for single disturbances. For these techniques, the feature extraction, as well as classification techniques, has been investigated and researchers in this field have achieved a great level of development [3–28]. As a result, the cur-rent classification techniques are capable of classifying sin-gle disturbances achieving classification ratio from 90% to 100%. A recent technique introduced in [32] attains classi-fication ratio very close to 100% if single disturbances are considered. The main advantage offered by this technique is the use of simple feature extraction technique along with
support vector machine(SVM) technique. Nevertheless, one
can note that the incidence of multiple disturbances, at the same time interval, in electric signals, is an ordinary situa-tion owing to the presence of several sources of disturbances in the power systems. Figures1and2expose this problem very well. One can note that Figure1(a) shows the signal {x(n)} = {f(n)}+{h(n)}+{u(n)}+{v(n)}while Figures1(b) and1(c)depict the sequences{f(n)}and{x(n)} − {f(n)}, respectively. This voltage measurement was obtained from
0 0.02 0.04 0.06 0.08 0.1 Time (s)
−1 0 1
(a)
0 0.02 0.04 0.06 0.08 0.1 Time (s)
−1 0 1
(b)
0 0.02 0.04 0.06 0.08 0.1 Time (s)
−1 0 1
(c)
Figure 2: (a) Monitored voltage signal, {x(n)}, (b) fundamen-tal component,{f(n)}, (c) harmonic and transient components, {h(n)}+{u(n)}.
x Feature
extraction Classifier
px r
Figure 3: Standard paradigm for the classification of single and multiple disturbances.
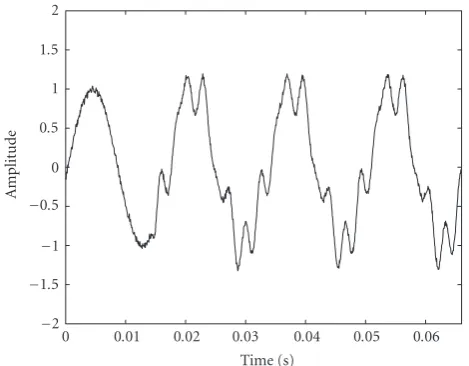
IEEE working group P1159.3 website. In Figure1(c), the sig-nal{z(n)} = {h(n)}+{t(n)}+{v(n)}is composed of 3rd harmonic, transient signal that can be a priori assumed to be a decaying oscillation, and, maybe, other disturbances very difficult to be a priori categorized. Another illustrative ex-ample of multiple disturbances in voltage signals is shown in Figure 2. One can note the incidence of short-duration volt-age variation named sag, seeFigure 2(b), harmonic compo-nents and, short-transient intervals associated with the volt-age sag as is pictured inFigure 2(c).
Presupposing that electric signals are represented by (1), the recognition of disturbance patterns composed of multi-ple disturbances cannot be an easy task to be accomplished as in the case of single disturbance ocurrence. In fact, the incidence of more than one disturbance in the electric sig-nals can lead to techniques attaining reduced classification performance due to the complexity of classification region if the standard paradigm, which is depicted inFigure 3, is con-sidered. It refers to the fact that in the standard paradigm, the feature vector px is extracted directly from the vector
x Signal processing
f Feature extraction
pf
Classifier
h Feature extraction
ph
Classifier
i Feature extraction
pi
Classifier
timp
Feature extraction
pimp
Classifier
tnot Feature extraction
pnot
Classifier
tdec Feature extraction
pdec
Classifier Feature
extraction
tdam pdam
Classifier
r
Figure4: Novel paradigm for the classification of single and multi-ple disturbances.
associated with disjoint disturbances sets. As a result, the de-sign of pattern recognition technique for classifying multiple disturbances is a very difficult task to be accomplished [5,7]. One can state that this is true because the electric signals are in the majority of cases composed of complex patterns, which is constituted by multiple primitive patterns. There-fore, the surfaces among the classification regions that are associated with different types of single and multiple distur-bances in the feature vector space, which is defined by the set of feature vectorspx, can be very complex and difficult to attain, even though powerful feature extraction and classifi-cation techniques are applied. As a result, the design of pat-tern recognition techniques offer low performance if (1) is composed of multiple disturbances; see [2,3] and reference therein. References [2,3] are the first contributions propos-ing pattern recognition techniques to classify one or two si-multaneous disturbances in voltage signals. The attained re-sults with synthetic data is lower than 95%, see [2]. These results illustrate that a lot of efforts have to be put in for the development of powerful pattern recognition techniques ca-pable of achieving high performance.
To overcome the weakness and reduced performance of the standard paradigm, in the following a paradigm based on
the principle of divide to conqueris presented, which has been
widely and succeessfully applied to many engineering appli-cations, to design powerful and efficient disturbance classifi-cation techniques for PQ appliclassifi-cations. In this paradigm, the vectorxis decomposed into what we call primitive compo-nents from which individual disturbances or, as defined here, primitive patterns can be easily classified. Here, primitive components are defined as those components from which only single disturbances can be straightforwardly classified. The primitive components are the vectors separately consti-tuted by samples of signals expressed by (2), (3), (4), (8), (9), (10), and (11).Figure 4illustrates the whole new paradigm.
As it can be seen, the main idea is to divide the powerline signals into several primitive components in which simple pattern recognition techniques can be designed easily and applied. The motivations for decomposing the vectorxinto vectorsf,h,i,timp,fnot,tdec, andtdamare as follows.
(i) From vectorf, several disjoint disturbances that are mainly related to the fundamental component can classify easily. For the vector f, the primitive patterns are named sag, swell, interruption, sustained interruption, undervolt-age, and overvoltage. As a result, the classification of distur-bances in the fundamental component can be formulated as the decision between four hypotheses [33–35]:
Hf,1:f=fnorm+vf, Hf,2:f=funder+vf, Hf,3:f=fover+vf, Hf,4:f=finter+vf,
(12)
wherevf is the noise vector associated with the fundamental component. The vectorsfnorm,funder,fover, andfinter denote a normal condition of fundamental component, an under-voltage or sag, a disturbance called overunder-voltage or swell, and a disturbance named sustained interruption or interruption, respectively. One has to note that the hypothesis expressed by (12) can be split into four simple hypotheses which are expressed by
Hf,i,0:f=vf, Hf,i,1:f=fdist+vf,
(13)
where dist denotes norm, under, over, and inter if i = 1,. . ., 4, respectively.
(ii) From vectorh, one can recognize the occurrence of distortions generated by the harmonic sources which mainly are nonlinear loads connected to power systems. Here the primitive pattern is calledharmonic distortion. By extracting the vectorhfrom the vectorx, the problem related to classi-fying the disturbances as harmonic distortion in voltage and current signals can be formulated as follows [33,34]:
Hh,1,0:hh=vh, Hh,1,1:hh=h+vh,
(14)
current signals can then be formulated as a decision between two simple hypotheses [33,34]:
Hi,1,0:ii=vi, Hi,1,1:ii=i+vi,
(15)
whereviis the noise vector associated with the inter-hamonic components.
(iv) The use oftimp vector provides us with the means to detect the occurrence of impulsive transients in the pow-erline signals. Then, the classification of primitive pattern as impulsive transient in voltage and current signals can be formulated as a decision between two simple hypotheses [33,34]:
Htimp,1,0:ttimp =vimp, Htimp,1,1:ttimp=timp+vimp,
(16)
wherevimpis the noise vector associated with the disturbance named impulsive transient.
(v) The use of tnot vector allows the identification of primitive pattern called notch in the powerline signals and, consequently, the presence of power electronic devices. Re-garding the use of vectortnot, this classification problem can be formulated as a decision between two simple hypotheses [33,34]:
Htnot,1,0:ttnot=vnot, Htnot,1,1:ttnot =tnot+vnot,
(17)
wherevimpis the noise vector associated with the disturbance called notch.
(vi) The use oftdecvector offers a means to recognize the so-called oscillatory transient (primitive pattern) that is de-fined as sudden, nonpower frequency changes in the steady-state condition of voltage and/or current that include both positive and negative polarity values. By extracting the vector
tdecfrom the vectorx, the problem related to classifying the disturbances as decaying oscillations in voltage and current signals can be formulated as a decision between two simple hypotheses [33,34]:
Htdec,1,0:ttdec=vdec, Htdec,1,1:ttdec =tdec+vdec,
(18)
wherevdecis the noise vector associated with the disturbance called decaying oscillation.
(viii) The use oftdam vector offers us the means to ver-ify the incidence of the primitive pattern characterized as a sudden, nonpower frequency change in the steady-state con-dition of voltage, current, or both, that is unidirectional in polarity (primarily either positive or negative). The use of
tdamallows one to recognize damped exponentials from a de-cision between two simple hypotheses [33,34]:
Htdam,1,0:ttdam=vdam, Htdam,1,1:ttdam=tdam+vdam,
(19)
wherevdamis the noise vector associated with the disturbance called damped decaying.
From all reasons and motivations stated before, it is clear that improved performance can be attained for the classifi-cation of single and multiple disturbances in electric signals, if the electric signals can be decomposed into several primi-tive components. By using such a very simple and powerful idea, which is named theprinciple of divide to conquer, the design of a very complex classification technique is broken in several simple ones that can be developed easily. The re-sult derived from this paradigm is very interesting because the incidence of several sets of classes of disturbances can be identified easily. In fact, each of the vectorsf,h,i,timp,
tnot,tdec, andtdamare related to disjointed classes of distur-bances and their recognition in parallel can be performed easily.
From a PQ perspective, the advantages and opportunities offered by this paradigm is very appealing and promising to completely characterize the behavior of electric signals not only for classification purpose, but also for other very de-manding issues listed at the beginning ofSection 1. To make this strategy successful, one has to develop signal processing techniques capable of decomposing the vectorxinto the vec-torsf,h,i,timp,fnot,tdec, andtdamto allow the further extrac-tion of simple and powerful feature extracextrac-tion and the use of simple classifiers.
This is a very hard and difficult problem to be solved so that it should be deeply investigated by signal processing re-searchers interested in this field. In fact, the decomposition of vectorxinto the vectorsf,h,i,timp,tnot,tdec, andtdamis not a simple task to be accomplished with simple signal pro-cessing techniques. However, if one assumes that the vectorx
is given by
x=f+vf +h+vh+u+vu, (20)
wherev=vf +vh+vuand
u=i+timp+tnot+tdec+tdam, (21)
then some signal processing techniques can be applied to de-composexinto the vectorsf,h, andu. And, as a result, high-performance pattern recognition technique for a limited and very representative set of disturbances in electric signals can be designed. In fact, the decomposition of the vectorxinto the vectorsf,h, anduallows one to design classification tech-niques for disjoint sets of disturbances associated with the primitive components named fundamental, harmonic, and transient, respectively.Section 3introduces a pattern recog-nition technique for single and multiple disturbances that makes use of (20)-(21) and attains an interesting improve-ment.
3. PROPOSED TECHNIQUE
x Signal processing f Feature extraction pf Classifier h Feature extraction ph Classifier u Feature extraction pu Classifier r
Figure 5: Standard paradigm for the classification of single and multiple disturbances.
x(n) NF0
x0(n) NF1
x1(n)
· · · NFM
−
xM(n) +
− hM−1(n)
+
− +
f(n)
h2(n)
Figure6: Scheme of the signal processing block.
This signal processing block is illustrated in Figure 6, where the blocksNFi,i=0,. . .,M−1, implement second-order notch filter with notch frequency ωm = 2mπ(f0/ fs). These filters are responsible for the estimations of{f(n)}, {h(n)}, and {u(n)}. The z-transform of the second-order notch filter is expressed by
Hm(z)= 1 +amz −1+z−2
1 +ρmamz−1+ρm2z−2
, (22)
where
am= −2 cosmω0, (23)
and 0 ρm < 1 is the notch factor. One should note that the notch filter has some drawbacks regarding the choice of the parameterρm, and also its output is, by definition, a con-tribution of information of its own internal state and the in-put. As a result, the notch filter can produce transient signals that reflect the changes at the input and in its states. This could be a problem if the aim is to estimate the parameters of the primitive components. For this problem, the use of high-order notch filter, such as 4th order or higher ones, can be used to reduce the transient at the output of the notch filter [37]. Although, these transients can contribute to dis-tort the primitive components, we point out that such be-havior does not minimize the classification performance. In fact, the transients at the output of the notch filter shows a typical parttern for each disturbance, then a neglible loss of performance has been verified for disturbance detection, see [1,38]. An advantage regarding the use of notch filter is that its implementation with finite word length in theδ-operator domain is very robust against the effects of finite precision, then it can be implemented in a cheapdigital signal processor
(DSP)-based equipment running with finite-precision. The notch filter inδ-operator domain is given by [39,40]
Hm(δ)=Hm(z)|z=1+Δδ=1 +αm,1δ −1+α
m,2δ−2 1 +βm,1δ−1+βm,2δ−2
, (24)
where
αm,1= 2
Δ
1−cosmω0
,
αm,2= 2
Δ2
1−cosmω0
,
βm,1= 2
Δ
1−ρmcosmω0
,
βm,2= 1 +ρ2
m−2ρmcosω0
Δ2 ,
(25)
where 0 < Δ 1 is carefully chosen to minimizeroundoff error effects. Although the implementation of a filter in theδ operator domain demands more computational complexity, it is very robust to the quantization effects when the sampling rate is at least 10 times higher than the frequency band of interest.
The vectorsf,h, anduprovided at the processing block output are expressed by
f=f,
h= M
m=2
hm,
u=xM,
(26)
respectively, where f = [f(n)· · ·f(n−N+ 1)]T, h m = [hm(n)· · ·hm(n−N+ 1)]T, andxM =[xM(n)· · ·xM(n− N+ 1)]T. If we assumeρ
m,m=0, 1,. . .,M, are very close to a unity, then
xi(n)∼=
⎧ ⎪ ⎪ ⎪ ⎪ ⎪ ⎪ ⎪ ⎪ ⎪ ⎪ ⎨ ⎪ ⎪ ⎪ ⎪ ⎪ ⎪ ⎪ ⎪ ⎪ ⎪ ⎩
xn+d0
−H0
ejω0(n)A 0(n)
×cosnω0(n) +θ0(n) +Δθ0(n)
ifi=0, xi−1
n+di−1
−i m=0Hm
ejmω0(n)A m(n) ×cosnmω0(n) +θm(n) +Δθm(n)
otherwise, (27)
where
Δθm(n)=
i
k=0 ∠Hk
mω0(n)
,
σm2(n)=σv2
1− i
k=0
Hk
mω0(n)2
.
(28)
The technique implemented in the feature extraction blocks is responsible for extracting reduced and represen-tative vectors of featurespi,i = f,h,u, from the vectorsf,
pj
Class 1
Class 2 . . . ClassCj
Decision
rj
Figure7: Scheme of the classification block.
classifier, which implement the algorithms that decide by the incidence or not of disturbances in the vectorsf,h, andu, are evaluated.
From the vectorf, four disjoint patterns of disturbances, which are named sag, swell, normal, and interruption, are primitive patterns. So, the hypothesis test formulated in (13) is applied. If one considers the vectorh, then one primitive pattern called harmonic is defined and the hypothesis test formulated in (14) is considered. Finally, for the vectoru, it is well known that at least five disturbances or primitive pat-terns (interharmonics, spikes, notches, decaying oscillations, and damped exponentials) can occur simultaneously in the vectoru. As a result, 25 =32 classes of disturbances can be associated with the vectoruand a very complex hypotheses test should be formulated.
As the primitive patterns are being considered in this work,Figure 7portrays the scheme of the classification tech-niques applied in the classifier blocks. Note that each class block makes use of a simple classification technique i = 1,. . .,Cj,j = f,h,u, that is responsible for classifying each disturbance in the vectorsf,h, andu. SinceFigure 7refers to the classifier block applied to the feature vectorpf, then Cf = 4.Ch = 1 if the feature vector p
h is being analyzed. Finally,Cu =32 when one tries to classify the disturbances in the feature vector pu. Regardingu, one has to note that usually three, two, or one disturbances can occur and, conse-quently, the number of disturbances classes are different for each situation.
While the design of pattern classifiers to work with the feature vectors extracted from vectorsfandhare quite sim-ple, the design of those techniques for disturbances classifi-cation in the vectorucould be a very hard task to be accom-plished. However, it is worth stating that the difficulties asso-ciated with the proposed scheme are lower than the ones as-sociated with standard techniques such as the ones proposed in [2,3]; see results inSection 4. In fact, the proposed tech-nique provides higher performance than the recently devel-oped techniques for single and multiple disturbances.
3.1. Feature extraction based on high-order-statistics (HOS)
As stated in [41]:Feature extraction methods determine an
ap-propriate subspace of dimensionalitym(either in a linear or a
nonlinear way) in the original feature space of
dimensional-ityd. Linear transforms, such as principal component
analy-sis, factor analyanaly-sis, linear discriminant analyanaly-sis, and projection pursuit have been widely used in pattern recognition for feature
extraction and dimensionality reduction.
Despite the good performance achieved by these men-tioned feature extraction techniques, it has been recently recognized that higher-order-statistics- (HOS-)based tech-niques are promising approaches for features extraction if the patterns are modeled as non-Gaussian processes. Ana-lyzing vectorsf,h, andu, one should note that these random vectors are usually modeled as an i.i.d. random processes in which the elements present a non-Gaussianprobability mass
function(p.m.f.).
The cumulants of higher-order statistics provide much more relevant information from the random processes. Be-sides that, the cumulants are blind to any kind of Gaus-sian process, whereas 2nd-order information is not. Then, cumulant-based signal processing methods can handle col-ored Gaussian noise automatically, whereas 2nd-order meth-ods may not. Therefore, cumulant-based methmeth-ods boost signal-to-noise ratio when signals are corrupted by Gaussian measurement noise and can capture more information from the random vectors [42].
Remarkable results regarding detection, classification, and system identification with cumulant-based methods have been reported in [42–45]. Also, a recent investigation of HOS for detection of disturbances in voltage signals re-ported that the HOS-based features extracted from voltage signals can achieve high detection ratio in a frame as short as 1/16 of one-cycle fundamental component immersed in a noisy environment [38].
By setting the lagτi=τ,i=1, 2, 3,. . ., the expressions of the diagonal slice of second- , third- , and fourthorder cumu-lant elements of a zero mean and stationary random vectorz, which is assumed to be one of the vectorsf−E{f},h−E{h}, andu−E{u}, are expressed by [42]
c2,z(i)=E
z(n)z(n+i), (29)
c3,z(i)=E
z(n)z2(n+i), (30) c4,z(i)=E
z(n)z3(n+i)−3c
2,z(i)c2,z(0), (31)
respectively, whereiis theith lag. Assuming thatzis anN -length vector, the standard approximation of (29)–(31) is ex-pressed by
c2(i) := 2 N
N/2−1
n=0
z(n)z(n+i), (32)
c3(i) := 2 N
N/2−1
n=0
z(n)z2(n+i), (33)
c4(i) := 2 N
N/2−1
n=0
z(n)z3(n+i)
− 12 N2
N/2−1
n=0
z(n)z(n+i) N/2−1
n=0 z2(n),
(34)
Recently, other authors proposed the use of (29)–(31) wheni = 0, whose evaluation is carried out by using the standard approximation provided by (32)–(34), for the clas-sification of two disturbances and the attained results were reported between 98% and 100%, see [46]. In this technique, a 20th-order (very long and complex) elliptic filter to emulate a notch filter responsible for the extraction of the fundamen-tal component and to allow the disturbance classification on the resulting transient signal is applied. One has to note that 4th- or 6th-order notch filter could provide very good perfor-mance without such a huge complexity and delay to remove the fundamental component, see [37].
Additionally, we have verified that the technique intro-duced in [46] leads to a low classification performance due to the following reasons. (i) If the disturbances are related to the fundamental component, then the transient signal could not be representative to allow the classification of distur-bances. Note that the disturbances related to the fundamental component are sags, swells, interruptions, and unbalances. It seems to be one reason for the results to be between 98% and 100% and not very close to 100%, as reported inSection 4. (ii) The authors made use of HOS parameters wheni = 0 without the knowledge of the advantages offered by (29)– (31). In fact, from (29)–(31), one can note that there is a large number of HOS features to be extracted for further selection. As a result, the classification for two disturbances in voltage signal proposed in [46] is very limited in the sense that many and more representative features could be extracted. (iii) If the electric signals are composed of multiple disturbances, then the feature vector extracted from the transient signals does not allow well-defined classification regions as the ones provided in [46] for only two disturbances. It fatally con-tributes to decrease the performance of classification tech-nique applied to other disturbances. (iv) The standard ap-proximation to extract HOS-based features is not appropri-ate if the frame length is short. As a result, a high sampling rate or a long frame length has to be applied to extract rep-resentative HOS-based features. One has to note that these concerns, by no means, disregard the use of the technique proposed in [46] for its intentional application. In fact, we are just pointing out the inadequacy of this technique to an-alyze the incidence of wide-ranging set of single and multiple disturbances in electric signals.
Due to the limitation of (32)–(34) to estimate the HOS-based features and HOS-based on the fact that the electric signals can be seen as cyclic or/and quasicyclic ones, we propose in this contribution the use of this information to define other approximation of HOS parameters. By using this informa-tion into (29)–(31), the new approximation for the HOS-based feature extractions can be expressed as follows:
c2,z(i) := 1 N
N−1
n=0
z(n)zmod(n+i,N), (35)
c3,z(i) := 1 N
N−1
n=0
z(n)z2mod(n+i,N), (36)
c4,z(i) := 1 N
N−1
n=0
z(n)z3mod(n+i,N)
− 3 N2
N−1
n=0
z(n)zmod(n+i,N) N−1
n=0 z2(n),
(37)
where i = 0, 1, 2,. . .,N −1 and mod(a,b) is the modu-lus operator, which is defined as the remainder obtained from dividingabyb. The approximations presented in (35)– (37) lead to a very interesting result where one has a short-ened finite-length vector from which HOS-based parame-ters have to be extracted. The use of mod(·) operator means that we are assuming that the vectorzis anN-length cyclic vector. The reason for this refers to the fact that by using such very simple assumption we can evaluate the approxima-tion of HOS-based parameters with all availableNsamples. Therefore, a reduced sampling rate and/or a shortened frame length could be valuable for HOS parameters estimation. That is one of the reasons for the improved performance achieved by the proposed technique inSection 4. The use of (35)–(37) for improved disturbance detection was presented in [38].
Now, suppose that the elements of the vector z = [z(0),z(1),. . .,z(N −1)]T are organized from the smallest to the largest values and the vector composed of these values are expressed byzor=[zor(0),zor(1),. . .,zor(N−1)]T, where zor(0)≤zor(1)≤,. . .,≤zor(N−1). If one replaces the vector
zby the vector zor in (32)–(37), then the extracted cumu-lants are namedorderedHOS-based features [47]. By doing so, the set of HOS-based features is composed of several el-ements. The HOS-based feature vector, whose elements are candidates for use in the proposed classification technique, extracted from the vectorszandzor, is given by
pi=
cTzcTzorT, i=1, 2, (38)
wherezdenotesf,h, andu,i=1 refers to a normal condition of voltage signals,i = 2 denotes the incidence of single or multiple disturbances in the vectorz,
cz=
cT zcTz
T =cT
2,zcT3,zcT4,zcT2,zcT4,zcT4,z
T
, (39)
czor=
cTzorcTzorT=cT2,zorcT3,zorc4,TzorcT2,zorc3,TzorcT4,zorT, (40)
where
cj,z=
cj,z(0)cj,z(1)· · ·cj,z
N 2 −1
T
,
cj,z=
cj,z(0)cj,z(1)· · ·cj,z(N−1)
T ,
cj,zor=
cj,zor(0)cj,zor(1)· · ·cj,zor
N 2 −1
T
,
cj,zor=
cj,zor(0)cj,zor(1)· · ·cj,zor(N−1)
T ,
(41)
200 400 600 800 1000 1200 1400 Feature vector
0 2 4
FDR valu
es
(a)
200 400 600 800 1000 1200 1400 Feature vector
0 2 4
FDR valu
es
(b)
500 1000 1500 2000 2500 3000 Feature vector
0 2 4
FDR valu
es
(c)
500 1000 1500 2000 2500 3000 Feature vector
0 2 4
FDR valu
es
(d)
Figure8: FDR values related to (a)cf, (b)cfor, (c)cf, and (d)cfor
feature vectors when the disturbance is sag.
3.2. Feature selection technique
As commented in [41] “The problem of feature selection is
de-fined as follows: given a set ofdfeatures, select a subset of sizem
that leads to the smallest classification error.The feature
selec-tion is typically done in an off-line manner and the execution
time of a particular algorithm is not as critical as the optimality
of the feature subset it generates.”
The need for the use of feature selection technique in the set of features extracted from voltage and current signals is due to the fact that the feature set is very large. Aiming at the choice of a representative, finite, and reduced set of fea-tures from powerline signals that provides a good separabil-ity among distinct classification regions associated with all primitive patterns, the use of theFisher’s discriminant ratio (FDR) is applied [48].
The reason for using the FDR and not other feature se-lection technique such assequential forward floating search (SFFS) orsequential backward floating search(SBFS) is that the FDR technique presented good results for this applica-tion. The FDR vector which leads to a separability in a low-dimensional space between sets of feature vectors associated
200 400 600 800 1000 1200 1400 Feature vector
0 10 20
FDR valu
es
(a)
200 400 600 800 1000 1200 1400 Feature vector
0 10 20
FDR valu
es
(b)
500 1000 1500 2000 2500 3000 Feature vector
0 10 20
FDR valu
es
(c)
500 1000 1500 2000 2500 3000 Feature vector
0 10 20
FDR valu
es
(d)
Figure9: FDR values related to (a)cf, (b)cfor, (c)cf, and (d)cfor
feature vectors when the disturbance is swell.
with different primitive patterns is given by
Jc=
m1−m2
2
1
D2 1+D22
, (42)
whereJc = [J1· · ·JLl]T,Llis the total number of features,
m1andm2, andD21andD22are the means and variances vec-tors of parameters vecvec-tors p1,k,k = 1, 2,. . .,Mp, andp2,k, k = 1, 2,. . .,Mp.p1,k andp2,k are feature vectors extracted from thekth voltage signals with and without disturbances andMp denotes the total number of feature vectors for the classes of disturbances associated with the presence or not of disturbances. The symbolrefers to the Hadarmard prod-uctrs=[r0s0· · ·rLr−1sLr−1]T. Theith element of the FDR
vector, see (42), having the highest value,Jc(i), is selected for use in the classification technique. Applying the same proce-dure,Kfeatures associated with theKhighest FDR values are selected.
200 400 600 800 1000 1200 1400 Feature vector
0 10 20
FDR valu
es
(a)
200 400 600 800 1000 1200 1400 Feature vector
0 10 20
FDR valu
es
(b)
500 1000 1500 2000 2500 3000 Feature vector
0 10 20
FDR valu
es
(c)
500 1000 1500 2000 2500 3000 Feature vector
0 10 20
FDR valu
es
(d)
Figure10: FDR values related to (a)cf, (b)cfor, (c)cf, and (d)cfor
feature vectors when the disturbance is interruption.
200 400 600 800 1000 1200 1400 Feature vector
0 5 10
FDR valu
es
(a)
200 400 600 800 1000 1200 1400 Feature vector
0 5 10
FDR valu
es
(b)
500 1000 1500 2000 2500 3000 Feature vector
0 5 10
FDR valu
es
(c)
500 1000 1500 2000 2500 3000 Feature vector
0 5 10
FDR valu
es
(d)
Figure11: FDR values related to (a)ch, (b)chor, (c)ch, and (d)chor
feature vectors when the disturbance is harmonic.
200 400 600 800 1000 1200 1400 Feature vector
0 5 10
FDR valu
es
(a)
200 400 600 800 1000 1200 1400 Feature vector
0 5 10
FDR valu
es
(b)
500 1000 1500 2000 2500 3000 Feature vector
0 5 10
FDR valu
es
(c)
500 1000 1500 2000 2500 3000 Feature vector
0 5 10
FDR valu
es
(d)
Figure12: FDR values related to (a)cu, (b)cuor, (c)cu, and (d)cuor
feature vectors when the disturbance is impulsive transient.
200 400 600 800 1000 1200 1400 Feature vector
0 50 100
FDR valu
es
(a)
200 400 600 800 1000 1200 1400 Feature vector
0 50 100
FDR valu
es
(b)
500 1000 1500 2000 2500 3000 Feature vector
0 50 100
FDR valu
es
(c)
500 1000 1500 2000 2500 3000 Feature vector
0 50 100
FDR valu
es
(d)
Figure13: FDR values related to (a)cu, (b)cuor, (c)cu, and (d)cuor
200 400 600 800 1000 1200 1400 Feature vector
0 5 10
FDR valu
es
(a)
200 400 600 800 1000 1200 1400 Feature vector
0 5 10
FDR valu
es
(b)
500 1000 1500 2000 2500 3000 Feature vector
0 5 10
FDR valu
es
(c)
500 1000 1500 2000 2500 3000 Feature vector
0 5 10
FDR valu
es
(d)
Figure14: FDR values related to (a)cu, (b)cuor, (c)cu, and (d)cuor
feature vectors when the disturbance is oscillatory transient.
These pictures illustrate very well the limitation of the HOS-based technique proposed in [46]. In fact, the use of HOS-based features when the lagτ = 0 is not a good choice be-cause for each primitive pattern there is a distinct set of fea-tures that improves the classification ratio. Finally, to evalu-ate the HOS-based features one can note that for the majority of the disturbance considered, the use of the approximation proposed in this contribution is better than the standard ap-proximation.
3.3. Pattern recognition technique
Pattern recognition techniques have been successfully ap-plied to power-quality applications. In these applications, the primitive patterns are represented by feature vectorpj, j = f,h,u, or attributes viewed as ad-dimensional vectors. From the feature vectors, a decision, making process can be summarized as follows: a given pattern is to be assigned to one ofccategoriesω1,ω2,ω3,. . .,ωc based on a vector ofd features.
Assuming that the features have a probability of mass function conditioned on the pattern class, then a vectorpj, j=f,h,u, associated with a pattern belonging to the classωi is viewed as an observation drawn randomly from the class-conditional probability function p(pj | ωi). If the a priori
0 0.01 0.02 0.03 0.04 0.05 0.06 Time (s)
−2 0 2
A
m
plitude
(a)
0 0.01 0.02 0.03 0.04 0.05 0.06 Time (s)
−2 0 2
A
m
plitude
(b)
0 0.01 0.02 0.03 0.04 0.05 0.06 Time (s)
−2 0 2
A
m
plitude
(c)
Figure15: Typical single disturbances related to vectorf. (a)–(c) are samples of disturbances called sag, swell, and interruptions, re-spectively.
probability as well as the parameters of the conditioned prob-abilities are known, partially known or unknown, then diff er-ent critera based on Bayes theory (ML, MAP, etc.), Neyman-Pearson, and so forth can be designed for obtaining the op-timum decision boundaries among the c classes in the d -dimensional feature vector space.
Assuming that the conditional probabilities functions are known and modeled as Gaussian ones, classifiers based on
themaximum likelihood(ML) criterion are designed. If the
Gaussian function parameters are estimated from the train-ing data, which is our situation, then the likelihood ratio test of themaximum likelihood(ML) criterion is given by
pPi|Hi,j,0
pi|Hi,j,0
pPi|Hi,j,1
pi|Hi,j,1
≥
< π0 π1
, (43)
0 0.01 0.02 0.03 0.04 0.05 0.06 Time (s)
−2
−1.5
−1
−0.5 0 0.5 1 1.5 2
A
m
plitude
Figure16: Harmonic disturbance associated with vectorh.
0 0.01 0.02 0.03 0.04 0.05 0.06 Time (s)
−2 0 2
A
m
plitude
(a)
0 0.01 0.02 0.03 0.04 0.05 0.06 Time (s)
−2 0 2
A
m
plitude
(b)
0 0.01 0.02 0.03 0.04 0.05 0.06 Time (s)
−2 0 2
A
m
plitude
(c)
Figure17: Disturbances associated with the vectoru. (a) is a sample of impulsive transient, (b) is a sample of notch, and (c) is a sample of a damped oscillation.
no incidence of the jth primitive disturbance (pattern) in theith primitive component.Hi,j,1, j =1,. . .,Ci, is the hy-pothesis with the presence of the jth primitive disturbance in the ith primitive component. Equation (43) is applied to detect the existence of disturbances in the vectors f,h, andu.
4. NUMERICAL RESULTS
The performance of the proposed technique to classify sin-gle and multiple disturbances in voltage signals is evaluated and compared with another technique. InSection 4.1, some results obtained with the proposed technique applied to clas-sify single and multiple disturbances inf,h, andu compo-nents are provided and discussed. Thereafter, inSection 4.2, comparison results between the proposed technique and the one proposed in [2], developed recently to classify sin-gle and multiple disturbances in voltage signal by consid-ering the voltage disturbances defined in [2, 3], are pre-sented.
4.1. Performance of the proposed method
To verify the performance of the proposed technique to clas-sify disturbances in the vectorsf,h, andu, simulations were carried out with several waveforms of voltage signals gener-ated with a sampling rate equal to fs = 256×60 samples per second (sps) and 32 bits for amplitude quantization. The selected primitive patterns are sag, swell, interruption, har-monic, impulsive transient, notch, and damped oscillation. Figures15,16,17show single disturbances associated with the vectorsf,h, andu, respectively.
Table 1 lists the attained classification ratio with the proposed technique applied to classify the set of primi-tive patterns (sag, swell, and interruption) that are associ-ated with the vector f. The following considerations were taken into account for the following simulations: (i) N = 128, 256, 512, 768, and 1024, then the lengths of the vec-torf correspond to 1/2, 1, 2, 3, and 4 cycles of the funda-mental component; (ii) feature vector pf with four HOS-based features, which were previously selected with the FDR technique, for each primitive pattern; (iii) two thousand sets of primitive patterns generated and equally divided into training and test data; (iv) the use of Bayes detection tech-nique based on the ML criterion as given by (43); (v)σ2
v = −30 dB; (vi) the amplitude of the fundamental component, A0, assumes values to characterize the disturbances in ac-cordance with the IEEE 1159-1995 Standard [49] and the phase, θ0, is modeled as uniform random variable in the interval (0, 2π]; (viii) the preprocessing block was imple-mented with finite word length with 16 bits. Figures 18, 19,20 portray the selected features extracted from vector
f by using the FDR to verify the occurrence of interrup-tions, sags, and swell. In these plots, the symbols ∗and◦ are associated with the occurrence or not of each distur-bance in the test data. One can note that there are linear separations, then the Bayesian classifiers reduces to a linear ones.
Table1: Performance of the proposed technique to classify disturbances in the vectorf.
Frame length Interruption (CR in %) Sag(CR in %) Swell(CR in %)
1C 99.93 99.95 100
2C 99.96 99.97 100
3C 100 99.98 100
4C 100 100 100
0 100 200 300 400 500
Feature vector
−0.08
−0.07
−0.06
−0.05
−0.04
−0.03
−0.02
−0.01 0 0.01
α1
With interruption Without interruption
Figure18: HOS-based features extracted fromf for interruption
α1=c2,f(68).
−3 −2.5 −2 −1.5 −1 −0.5 0 0.5
α2
−0.03
−0.02
−0.01 0 0.01 0.02 0.03 0.04 0.05
α1
With sag Without sag
Figure19: HOS-based features extracted from vectorffor sagα1=
c4,f(512) andα2=c2,f(194).
are reported whenN≥1024 or, at least, 4 cycles of the fun-damental component, see [3,5,28,32].
0 100 200 300 400 500
Feature vector
−0.06
−0.05
−0.04
−0.03
−0.02
−0.01 0 0.01 0.02
α1
With swell Without swell
Figure20: HOS-based features extracted from vectorf for swell
α1=c2,f(191).
0 100 200 300 400 500
Feature vector 0
0.01 0.02 0.03 0.04 0.05 0.06 0.07 0.08
α1
With harmonics Without harmonics
Figure21: HOS-based features extracted fromhα=c2,h(0).
Table2: Performance of the proposed technique for harmonic clas-sification.
Frame length CR in %
1/2C 100
1C 100
2C 100
3C 100
4C 100
harmonic was carried out by taking into account the fol-lowing considerations: (i)N =128, 256, 512, 768, and 1024 and, consequently, the lengths of the vector h correspond to 1, 2, 3, and 4 cycles of the fundamental component; (ii) two thousand sets of harmonic disturbances equally di-vided in training and test patterns were considered; (iii) Bayes detection technique based on the ML criterion was designed; (iv) σ2
v = −30 dB; (iv) the harmonic compo-nents, whose frequency aremω0,m = 3, 5, 7, 9, 11, 13, and 15, have amplitudes Ai and θi modeled as uniform ran-dom variables in the intervals (0.01, 0.4] and (0, 2π], respec-tively; (v) feature vector ph composed of one element se-lected by FDR criterion. The generated harmonics comply with the IEEE 1159-1995 standard [49].Figure 21shows the selected HOS feature obtained from vectorhto detect har-monic presence. The symbols∗and◦are associated with the occurrence or not of harmonic in the test data, respec-tively.
The results achieved with the proposed technique are presented inTable 2. The CR as high as 100% is not novel ifN ≥ 1024 or, at least, 4 cycles of the fundamental com-ponent are taken into account [3,5, 28, 32]. The novelty here is the fact that the proposed technique is capable of achieving CR as high as 100% if the length of vectorh cor-responds to 1/2, 1, 2, 3, and 4 cycles of the fundamental com-ponent.
To check the effectiveness of the proposed technique for the classification of primitive patterns in the vectoru, the fol-lowing considerations were taken into account: (i)N=1024, which corresponds to four cycles of the fundamental compo-nent; (ii) four-length feature vectorpuin which all elements are selected with the FDR technique; (iii) 3000 sets of dis-turbances such as impulsive transients, notches, and damped oscillations equally divided into training and test data; (iv) Bayes detection technique based on the ML criterion; (v) ad-ditive noise power equal toσ2
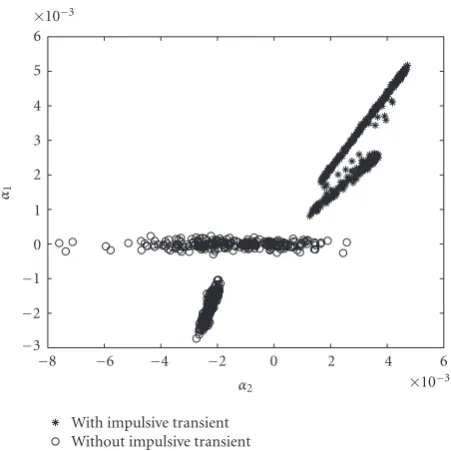
v = −30 dB; and (vi) single in-cidence of disturbances in the vectorx that appears in the primitive component represented by the vectoru. Figures22, 23,24depict the selected HOS-based features that were ex-tracted from vectoru to classify the disturbances as oscil-latory transient (damped oscillations), impulsive transient, and notch. In these figures, the symbols∗and◦are associ-ated with the occurrence or not of each disturbance in the test data.
The attained results with the test data are shown in Table 3. One can note that the proposed technqiue is
capa-0 100 200 300 400 500
Feature vector
−1 0 1 2 3 4 5 6 7 8 9
×10−3
α1
With damped oscillation Without damped oscillation
Figure22: HOS-based features extracted fromuto classify the os-cillatory transient named damped oscillation,α1=c2,u(257).
−8 −6 −4 −2 0 2 4 6
×10−3
α2
−3
−2
−1 0 1 2 3 4 5 6
×10−3
α1
With impulsive transient Without impulsive transient
Figure23: HOS-based features extracted fromuto classify the im-pulsive transientα1=c2,u(4) andα2=c2,u(511).
ble of classifying almost all primitive patterns in the vector
u.
0 100 200 300 400 500 Feature vector
−5
−4
−3
−2
−1 0 1 2
×10−3
α1
With notch Without notch
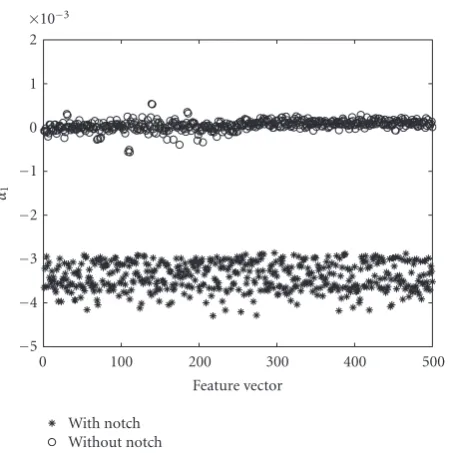
Figure 24: HOS-based features extracted from u to classify the notch disturbance,α=c2,u(97).
Table3: Performance of the proposed technique for disturbance classification in the vectoruwhenN=1024 is considered.
Disturbance CR in %
notch 100
Impulsive transient 100
Oscillatory transient (damped oscillation) 100
the approximations to estimate the HOS-based features with (35)–(37) provide better results than those obtained with approximations provided by (31)–(34); (iii) the combina-tion of features obtained with different approximations pro-vides better separability; (iv) the use of cumulants extracted from the ordered vectors usually does not offer any ad-vantage over the usual cumulants; (v) the cumulants as-sociated with 3rd-order are useless for disturbance classifi-cation; (vi) in the majority of the cases, the Baysian clas-sifiers reduce to linear clasclas-sifiers because there is a linear separability between the classes; (vii) to classify seven dis-turbances, we have to evaluate only eight HOS-based fea-tures.
Table 4presents the performance of the proposed tech-nique applied to classify multiple primitive patterns. Here, it is consideredN=1024. InTable 4, the termTransientrefers to notch, spike, or damped oscillation, the termFund de-notes disturbances in the fundamental component, the term Harmrefers to the harmonic disturbance, and the termTwo
transientsandThree Transientsmean that two or three
dis-tinct transients occur at the same frame, respectively. From Table 4, one verifies that the proposed technique is capable of
Table4: Performance of the proposed technique for the classifica-tion of multiple disturbances in vectorx.
Disturbances CR in %
Fund + Harm 100
Fund + Harm + One Transient 99.98
Fund + Harm + Two Transients 98.35
Fund + Harm + Three Transients 96.89
classifying several sets of multiple primitive patterns in volt-age signals.
4.2. Performance comparison
Finally, the proposed technique is compared against a pre-vious technique recently introduced in [2]. A set of dis-turbances, defined in accordance with [3] and reproduced inTable 5, was generated by following the same procedure adopted in [2,3]. By using this set of disturbances, a per-formance comparison between the technique discussed in [2] and the one introduced in this contribution was carried out and the results are comparatively reported in Table 6. Based on the reported results, one can verify that the pro-posed technique not only surpasses the performance of the previous one, but it also shows a considerable improve-ment.
One has to note that the results reported in both Sec-tions4.1and4.2were obtained with disturbances synthet-ically generated. As a result, the proposed technique will show a degradation in its performance if it is applied to real voltage signals, but it is worth stating that the classification technique proposed in [2,3] will present similar behavior. At this point, we are not able to say, under this situation, what technique will present the lowest performance degra-dation.
5. CONCLUSIONS
In this contribution, a paradigm and a technique to clas-sify single and multiple disturbances in electric signals are introduced. The main advantage offered by the paradigm is the use of the principle of divide to conquer to decom-pose the powerline signals into a set of primitive compo-nents in which simple and powerful feature extraction, fea-ture selection, and classification techniques can be applied to recognize primitive patterns (single and multiple distur-bances).
Based on the proposed paradigm, a disturbance classifi-cation technique is presented to classify single and the most probable sets of multiple disturbances in voltage signals. The numerical results obtained with computational simulations indicate that the proposed technique shows considerable im-provement in terms of classification ratio.
Table5: Power quality disturbance models following [3].
PQ disturbance Class Model Parameters
Normal C1 x(t)=A0sin(ω0t) A0=1
Swell C2
x(t)=A0{1 +α[u(t−t1)−u(t−t2)]}sin(ω0t)
t1< t2,u(t)=
⎧ ⎪ ⎨ ⎪ ⎩
1,t≥0
0,t <0
0.1≤α≤0.8
T≤t2−t1≤9T
Sag C3 x(t)=A0{1−α[u(t−t1)−u(t−t2)]}sin(ω0t) 0.1≤α≤0.8,T≤t2−t1≤9T
Harmonic C4 x(t)=A0[α1sin(ω0t) +α3sin(3ω0t) +α5sin(5ω0t) +α7sin(7ω0t)]
0.05≤α3≤0.15, 0.05≤α5≤0.15 0.05≤α7≤0.15,α2
i =1 Outage C5 x(t)=A0{1−α[u(t−t1)−u(t−t2)]}sin(ω0t) 0.9≤α≤0.1,T≤t2−t1≤9T
Sag + Harmonic C6
x(t)=A0{1−α[u(t−t1)−
u(t−t2)]}[α0sin(ω0t)
+α3sin(3ω0t) +α5sin(5ω0t)]
0.1≤α≤0.9,T≤t2−t1≤9T
0.05≤α3≤0.15, 0.05≤α5≤0.15,α2 i =1
Swell + Harmonic C7
x(t)=A0{1+α[u(t−t1)
−u(t−t2)]}[α0sin(ω0t)
+α3sin(3ω0t) +α5sin(5ω0t)]
0.1≤α≤0.9,T≤t2−t1≤9T
0.05≤α3≤0.15, 0.05≤α5≤0.15,α2 i =1
Table6: Performance comparison in terms of classification ratio (%) achieved by proposed technique and the technique proposed in [2].
Class Proposed technique Technique proposed in [2]
C1 100 100
C2 100 100
C3 100 85.55
C4 100 100
C5 100 82
C6 100 96.50
C7 100 100
ACKNOWLEDGMENTS
This work was supported in part by CNPq under Grants 150064/2005-5 and 550178/2005-8 and FAPEMIG under Grant TEC 00181/06, all from Brazil.
REFERENCES
[1] M. V. Ribeiro,Signal processing techniques for power line com-munication and power quality applications, Ph.D. thesis, De-partment of Communications, University of Campinas, Sao Paulo, Brazil, April 2005.
[2] H. He and J. A. Starzyk, “A self-organizing learning array sys-tem for power quality classification based on wavelet trans-form,”IEEE Transactions on Power Delivery, vol. 21, no. 1, pp. 286–295, 2006.
[3] T. K. Abdel-Galil, M. Kamel, A. M. Youssef, E. F. El-Saadany, and M. M. A. Salama, “Power quality disturbance classifica-tion using the inductive inference approach,”IEEE Transac-tions on Power Delivery, vol. 19, no. 4, pp. 1812–1818, 2004. [4] T. X. Zhu, S. K. Tso, and K. L. Lo, “Wavelet-based fuzzy
reason-ing approach to power-quality disturbance recognition,”IEEE
Transactions on Power Delivery, vol. 19, no. 4, pp. 1928–1935, 2004.
[5] M. Wang and A. V. Mamishev, “Classification of power quality events using optimal time-frequency representations—part 1: theory,”IEEE Transactions on Power Delivery, vol. 19, no. 3, pp. 1488–1495, 2004.
[6] M. S. Azam, F. Tu, K. R. Pattipati, and R. Karanam, “A depen-dency model-based approach for identifying and evaluating power quality problems,”IEEE Transactions on Power Delivery, vol. 19, no. 3, pp. 1154–1166, 2004.
[7] M. Wang, G. I. Rowe, and A. V. Mamishev, “Classifica-tion of power quality events using optimal time-frequency representations—part 2: application,” IEEE Transactions on Power Delivery, vol. 19, no. 3, pp. 1496–1503, 2004.
[8] Z.-L. Gaing, “Wavelet-based neural network for power dis-turbance recognition and classification,”IEEE Transactions on Power Delivery, vol. 19, no. 4, pp. 1560–1568, 2004.
[9] J. Chung, E. J. Powers, W. M. Grady, and S. C. Bhatt, “Power disturbance classifier using a rule-based method and wavelet packet-based hidden Markov model,” IEEE Transactions on Power Delivery, vol. 17, no. 1, pp. 233–241, 2002.
[10] W. R. A. Ibrahim and M. M. Morcos, “A power quality per-spective to system operational diagnosis using fuzzy logic and adaptive techniques,” IEEE Transactions on Power Delivery, vol. 18, no. 3, pp. 903–909, 2003.
[11] I. W. C. Lee and P. K. Dash, “S-transform-based intelligent system for classification of power quality disturbance signals,”
IEEE Transactions on Industrial Electronics, vol. 50, no. 4, pp. 800–805, 2003.
[12] P. K. Dash, B. K. Panigrahi, D. K. Sahoo, and G. Panda, “Power quality disturbance data compression, detection, and classifi-cation using integrated spline wavelet and S-transform,”IEEE Transactions on Power Delivery, vol. 18, no. 2, pp. 595–600, 2003.