Thesis by Menahem Segal
In Partial Fulfillment of the Requirements
For the Degree of Doctor of Philosophy
California Institute of Technology Pasadena, California
1973
ii
ACKNOWLEDGMENTS
I am grateful to Professor J. Olds for introducing me to the brain and teaching me how to ask intelligent questions about it. His brilliant and imaginative ideas guided me throughout my work with him.
I also thank Professors J. Bonner, D. Fender, R. Sperry and F. Strumwasser, the members of my thesis committee, for their help through the study.
Dr. M. E. Olds deserves special credence for demonstrating to me how to get answers to questions Dr. J. Olds taught me how to ask.
Drs. John Disterhoft, Richard Hirsh and Mike Ito, with whom I had the pleasure to work and discuss my work, helped me a
lot, each in his own way. I am grateful to them.
Finally, this work would not be accomplished without the dedicated help of Liza Katz, Edith Huang, Karen Roberts, Jill Meginnis, the other past and present members of the Lab and last but not least, my wife Nira.
ABSTRACT
A series of·experiments were conducted with the purposes of
describing a functional pathway in the rat hippocampus, characterizing some conditions necessary for activating it, and identifying critical steps in this pathway. In all experiments a classical conditioning paradigm was used and the responses of units in the hippocampus and related forebrain structures to the conditioned stimulus were measured. In the first experiment a few differences between dentate,
CA-3, and CA-l, the main fields of the hippocampus, were found. Units in the dentate were first to acquire a conditioned response, CA-3 followed and CA-l was last. This order fits with the anatomical pathway. However, dentate responses were phasic, that is, did not outlast the CS-US interval, and were not specific to the conditioned stimulus. The responses of CA-3 and CA-l units, on the other hand, were sustained and specific. The second experiment was devoted
to the' analysis of conditioned response latencies, in the hippocampus as w~ll as in septum, subiculum, cingulate, entorhinal, and related str~ctures, all known to be input stages to the hippocampus. In this experiment unconditioned short response latencies were found in the medial septum, one of the afferents of the hippocampus. These were not changed in the process of learning. The shortest
iv
other main afferent to the hippocampus did not seem to precede hippocampal units either. The special relations between the
hippo-campus and the dentate were demonstrated in another part of this experiment, where dentate units lost their conditioned responses, in the process of extinction, before those of CA-3 and CA-l. It was postulated that septal input triggers CA-3 responses and these would be maintained in the presence of reinforcing dentate and entorhinal inputs.
The relations between the dentate and the hippocampus were further studied in two experiments in which aversive electric shock served as an unconditioned stimulus. In experiment 3 food and shock served as unconditioned stimuli on alternate days. In
experiment 4 food and shock were presented in the same sessions as uncond!tioned stimuli to two different CS's. Dentate units had an excitatory conditioned response to a food signal and an inhibitory
conditioned response to a shock signal in both experiments. Hippocampal units had excitatory responses to both signals.
probably involved in the initiation of a conditioned response in the hippocampus but not in the maintenance of it.
A sensory-sensory paradigm (experiment 5) has demonstrated the presence of unconditioned unhabituated sensory responses in two of the afferents to the hippocampus, that is, the medial septum and the cingulate cortex. It failed to show signs of conditioning in the hippocampus proper. It was proposed that in the absence of an appetitive reward and the activity of the entorhinal-dentate pathway, conditioned responses in hippocampus cannot be established.
Conditioned entorhinal responses (experiment 6) had long latency but also long time constant. Their evoked activity was maintained for periods as long as one minute. It was found that hippocampal responses were larger, if the conditioned stimulus was applied within one minute from the previous trial. Hence, a
correlation between hippocampal responses and entorhinal firing rate was demonstrated. On the basis of these experiments it was proposed that septal input enters the hippocampus at the CA-3 area, is able to selectively activate these cells only in the
presence of facilitation produced by entorhinal and dentate activity. The facilitatory entorhinal activity is triggered mainly by
vi
TABLE OF CONTENTS
Page
A. INTRODUCTION----~--- 1 (i)
(ii) (iii) (iv)
General
The Wiring Diagram
Spatial Organization of the Hippocampus
The Physiological Properties of the Hippocampus
B. GENERAL METHODS--- 21 C. TRACING A FUNCTIONAL PATHWAY IN THE HIPPOCAMPUS--- 27
Experiment 1: The Development of Conditioned Responses
in the Hippocampus--- 27 (i) Methods
(ii) Results (iii) Discussion
Experiment 2: Analysis of Response Latencies in the
Hippocampus and Related Structures--- 59 (i) Methods
Page D. DETERMINANTS OF CONDITIONING IN THE HIPPOCAMPUS--- 100
Experiment 3: Hippocampal Unit Activity During Classical Aversive and Appetitive Conditioning--- 101 (i) Methods
(ii) Results (iii) Discussion
Experiment 4: The Activity of Units in the Hippocampal Circuit of the Rat d~ring Differential
Classical Conditioning--- 111 (i) Methods
(ii) Results (iii) Discussion
Experiment 5:
An
Attempt to Produce a Sensory-SensoryConditioning in the Hippocampal System---- 130 (i) Methods
viii
Page E. DISSECTING THE ROLE OF THE ENTORHINAL CORTEX IN
HIPPOCAMPAL CONDITIONING--- 130 Experiment 6: A Mechanism for Short Term Memory in
the Hippocampal System--- 150 (i) Prolonged Conditioned Entorhinal Unit Responses (ii) Time Constant of Prolonged Conditioned Entorhinal
Responses
(iii) A Correlation Between Entorhinal Firing Rate and Hippocampal Response Rate
A. INTRODUCTION
(i) General
The hippocampus has attracted the imagination as well as the energy of people from the whole spectrum of disciplines established over the past century in brain research. The uniqueness of this structure has led many scientists to believe that it is the "Rosetta Stone"; the key to the understanding of the mysterious gelatinous material packed en-cephalon. The basic wiring diagram of the system is now well documented, with the aid of all available anatomical methods. The physiological properties of its components are known as well; what is still a mystery is what the hippocampus does. Utilizing a variety of strategies many theories have tried to
ascribe functions to the hippocampus, but upon further examination, none have been found to be satisfactory.
A,similarly unsolved mystery is the basic and most unique property of the mammalian brain--plasticity. What are the neural mechanisms underlying conditioning, learning and memory? Here,
again, many years of study and the utility of a variety of methods did not yield the expected results. We still do not know how the brain, or parts of it, acquires information, stores and retrieves, or forgets. The present study is addressed to these two mysteries with a modest hope of being able to contribute to the understanding
-2-Exploring cellular activity while the rat learns a simple association might give us a clue as to a mechanism of conditioning. Understanding how the hippocampus operates as a learning mechanism can give us a clue as to what the functions of the hippocampus are.
The first question is: does the hippocampus learn? Learning is (Hilgard and Bower, 1966, p. 2) "the process by which an activity originates or is changed through reacting to an encountered
situation provided that the characteristics of the change in activity cannot be explained on the basis of native response tendencies, etc." Applying this definition to a search for a learning center in the brain, one would look for a neuron (or a group of neurons) which receives constant neural input and changes its responsiveness to this input. This changed responsiveness should not be attributed to temporary conditions. This part is illustrated by Eisenstein whose definition of learning (in Bullock, 1966, p. 173) " ••• the ability to code and retain different patterned sensitivities to the same stimulus," is complementary to Hilgard's one on a neural level.
Commonly used methods in brain research have failed to
distinguish between primary loci of conditioning and loci in which a conditioned response is secondary to conditioning established elsewhere. A careful analysis of response latencies to a
a "new" response during conditioning. Analysis can also determine which of these units, in a given system, has the briefest new response latency. The area that contains these cells has to be a primary locus affected by a conditioning procedure. It should be noted that in order to substantiate the argument that conditioning is taking place at this point, it has to be shown that, (1) this locus is getting sensory input during pseudo-conditioning, and
(2) this input is not modified by the conditioning procedure, as far as latency is concerned. This is a rather easy task in the hippocampus, since one can monitor the activity of all known
input elements to the system. Once a learing site is located
within the hippocampus, the next step is to characterize the optimal conditions necessary to evoke and maintain the learned behavior in this site.
Secondly, a working model can be drawn and tested, and assumptions about the functions of the hippocampus presented.
The Wiring Diagram
-4-Fink-Heimer, and the electron microscopy techniques (Nauta and Ebbeson, 1970) gives us as close a picture to the truth as one can presently get.
The hippocampus is made of two sheets of paleocortex folded into each other and twisted from the anterio-medio-dorsal (septal pole) to the posterio-lateral-ventral end (posterior pole) of the ·telencephalon (fig. 1.1). The two subdivisions are the dentate
gyrus and the Cornu Ammonis (CA). There are 6 and 4 recognizable layers in Cornu Ammonis and dentate, respectively. Although
Lorente de No (1934) lists 14 different types of cells in CA and 6 in dentate, there is a tendency to recognize, by electrophysiological methods, only two types of cells. In CA - pyramidal and
non-pyramidal cells (presumably Golgi type II) and in dentate -granular and Golgi type II cells. Dentate granular cells have a large
dentritic field, revealed by the Golgi stains. The main inputs to the dentate are from lateral entorhinal cortex (Raisman et al., 1965; Blackstad, 1958; Simonsen and Jeune, 1972). Other inputs are commissural (Raisman et al., 1965; Cragg andHamlyn, 1957),
and septal (Ibata et al., 1971) which end on the polymorphic layer, where the axons leave the dentate gyrus (see fig. 1.2 for the
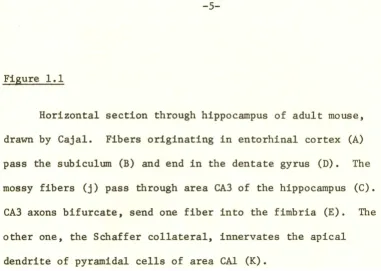
Figure 1.1
Horizontal section through hippocampus of adult mouse, drawn by Cajal. Fibers originating in entorhinal cortex (A) pass the subiculum (B) and end in the dentate gyrus (D). The mossy fibers (j) pass through area CA3 of the hippocampus (C).
-6-bouton en passage on the spines of the main dendritic shafts of CA3 pyramids (Hamlyn, 1962). Transmission in these synapses is blocked by a variety of antimetabolic drugs (Mclardy, 1962; von Euler, 1962). Thus far, CA3 is the only known output of the dentate gyrus (Blackstad et al., 1970).
CA3 pyramids are the largest cells in the hippocampus (20-30 ~in diameter). They extend through all layers of the hippocampal sheet. The inputs to CA3 cells are from the dentate gyrus, terminal fibers from the entorhinal cortex (Nafstad, 1967; Simonsen and Jeune, 1972), contralateral hippocampus (Raisman et al., 1965), and medial septal nucleus (Ibata et al., 1971; Siegel and Tassoni, 197la). The axon of the pyramidal cell splits after a short distance. One collateral runs through the fimbria and precommissural fornix to end in septal area. The other
forms the "Schaffer collaterals" which feed into CAl apical dendrites in the stratum lacunosum. Recently, a possible CA3-entorhinal
pathway has been discovered (Simonsen, 1971). CAl pyramidal somata are packed in a rather thin layer. The main afferents to CAl cells are the Schaffer collaterals, commissural fibers
(Raisman et al., 1965), and lateral and medial entorhinal cortex fibers (Ibid.). There is a disagreement between Raisman et al.
(1965), and Siegel and Tassoni (197lb) on the possible septal
CA3
s.mol. s.lac.
s. rad. - -s.pyr. s.ori.
alveus
- E n t .
"--
~
~-
Sch.-
~-...
~.~
&\\, ----
~:~.
CA1 s.mol. s.gra11. s.poly. -100~ ~ DG
- E n t.
Com. -cA3c
Camera I ucida tracings of two typical pyramidal cells from fields CA1 and CA3 of the hippocampus, and a granule cell from the dentate gyrus (DG ). The boundaries of the major strata are indicated by the horizontal lines (s.lac.-s.mol. =stratum lacurwsum-moleculare; s.rad.
=
stratum radiatum; s. pyr. = stratum pyramidale; s.luc. = stratum lucidum; s. ori.=
stratum oriens; s. mol. = stratum moleculare; s. gran. = stratum granulosum.; s. poly. = stratum polymorphe). The arrows indicate the principal sources of afferents which terminate within the various strata (Ent. = afferents from entorhinal cortex; Com .. = commissural afferents; Den. = mossy fibers from the dentate gyrus; Sep. = afferents from the medial septal nucleus; Bas.=
basket endings of the basket eells; Sch.=
Schaffer collaterals from fields CA3 and CA1 to field CA1 ; CA3c = an ipsilateral afferent pathway to the commissural zone of the dentate gyrus from subfield CA3c). This figure, which is adapted from one in Raisman, Cowan, and Powell (1965), is based principally upon the work of Blackstad and his colleagues (1956, 1958)and of Raistnan. et al. (1965).
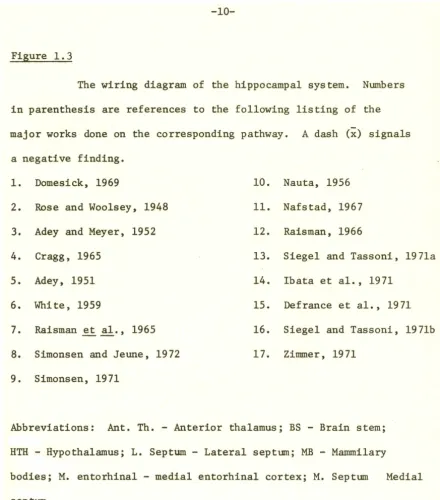
Tassoni and Ibata et al. (1971) in cats with Fink Heimer and EM techniques found septal endings on CAl cells. However, since there are inconsistencies between Siegel and Tassoni and Ibata . et al. (1971) who used the same preparation, the issue, to my mind, is still unsolved. CAl outputs go via post commissural fornix to mammilary bodies and anterior nucleus of thalamus and brain stem
(Nauta, 1956). A band of CAl fibers runs caudally towards entorhinal, but its terminus is not known. Adey et al. (1958) claims that the fibers go to entorhinal cortex. Votaw (1960) found fibers in monkeys, that go as far as the temporal cortex. Fig. 1.3 summarizes the known connections of the hippocampus.
(iii) Spatial Organ!zation of the Hippocampus The hippocampus extends on the septal-temporal axis and the dorso-ventral axis. Attempts to show spatial differentiation of the hippocampus were initiated by Lorente de No (1934) who main-tained that the temporal input (cingulate ex, gyrus lancis, entorhinal ex) was distributed on the dorso-ventral axis to that entorhinal innervated ventral hippocampus and cingulate-dorsal hippocampus. Since then, many differences in connectivity (Siegel and Tassoni, 197la), physiological (Elul, 1964), and functional
(Nadel, 1968) properties of dorsal and ventral hippocampus
-10-Figure 1.3
The wiring diagram of the hippocampal system. Numbers in parenthesis are references to the following listing of the major works done on the corresponding pathway. A dash (x) signals
a negative finding.
1. Domesick, 1969 10. Nauta, 1956
2. Rose and Woolsey, 1948 11. Nafstad, 1967 3. A dey and Meyer, 1952 12. Raisman, 1966
4. Cragg, 1965 13. Siegel and Tassoni, 197la
5. Adey, 1951 14. lbata et al., 1971
6. White, 1959 15. Defrance et al., 1971
7. Raisman e t al. , 1965 16. Siegel and Tassoni, 197lb
8.
Simonsen and Jeune, 1972 17. Zinnner, 19719. Simonsen, 1971
Abbreviations: Ant. Th. - Anterior thalamus; BS - Brain stem; HTH - Hypothalamus; L. Septum - Lateral septum; MB - Mammilary
M.B.
Ant. thL. SEPTUM
~
12
16
MFB
+
10
Ant. th.'~
association sensory
cortex I
3
sub
4rcingtlate
~
4
I
I
115
presub
6
pyriform
-12-lamination of entorhinal input to the dentate gyrus and from the dentate to the hippocampus, so that the septal-temporal axis can be sliced into fine projection fields with no significant overlap in the input pathways. However, in contrast to Lorente de No's idea, the entorhinal innervates the entire hippocampus (Simonsen and Jeune, 1972) and no fibers from cingulate to hippocampus could be detected (White, 1959; Adey, 1961). This work was supported by a physiological study done by Anderson et al. (1971). The picture is different in the septal projection to the hippocampus. Raisman found that medial septum. (of rat) innervates mainly the CA3 area of hippocampus, both the dorsal and ventral portions. Siegel
and Tassoni (197lb) found that the medial septum (of cat) innervates the dorsal hippocampus, and all the fields there. Ibata and
Kappas (Ibata et al., 1971) found that the medial septum innervates the entire hippocampus. In no case, however, was a lamellar
differentiation of the septal input described anatomically.
described the following steps in the production of an action potential in the hippocampus: (1) slow prepotentials which are not involved in initiation of a spike, are assumed to be summed EPSP's; (2) fast prepotentials, seen only in orthodromic or intra-cellular activation, which sometimes can be seen without a spike production, are ascribed to the dendritic spike initiated at the bitfurcation of the main apical dendritic shaft (Andersen, 1966);
(3) A-B break first seen in motoneurons which represents the transition of the spike from the axon hillock into the soma; (4) the spike, having the same characteristics of a motoneuron spike; (5) post spike depolarization, not seen in motoneurons, where a common hyperpolarization is observed. This post-potential
depolarization is involved in production of a burst, inactivation process (Green, 1964), production of the slow wave rhythms (Kandel and Spencer, 1961), and is probably responsible for the inability of hippocampal cells to fire at a high frequency rate, as seen in motoneurons. The existence of dendritic spikes was debated for
a long period. There seems to be an agreement that these may exist, although no intracellular dendritic recording has been achieved
(except, maybe, in the cerebellum). Laminar analysis of field potentials (Andersen, 1960b), isolated fast prepotentials (Spencer et al., 1961) and histological arguments led to the assumption
-14-spike without fast prepotential was observed (Purpura, 1966a).) Antidromic stimulation of a pyramidal cell leads to a long hyperpolarization (100 msec). This is not caused by afferent stimulation (Kandel and Spencer, 1961), but probably by activation of a local circuit (Andersen, et al., 1963) in a Renshaw loop. Support for the negative feedback Renshaw loop hypothesis was demonstrated by recording a high frequency train of spikes in hippocampal cells, while other cells demonstrated prolonged IPSP. Andersen assumes that these are Golgi type II neurons which synapse on the pryamidal cell bodies. Recently, a positive feedback local loop has been proposed (Lebovitz et al., 1971). The nature of these mechanisms is, as yet, not clear.
The connections between the hippocampal areas as well as the nature of hippocampal afferents have been thoroughly studied over the past decade. All hippocampal afferents (septal, entorhinal, and commissural) as well as intrinsic pathways (mossy fibers and Schaffer collaterals) were found to be excitatory. However, although stimulation of septal and commissural afferents can initiate time-locked spikes, the main effect of entorhinal input is initiation of long lasting EPS's. A lasting effect of stimulation of perforant path was demonstrated by Andersen (Andersen et al~, 1967) and Lomo
(1971): stimulation of 10-15 sec potentiate later dentate response to single pulses of perforant path. This specific frequency
this extent in an awake, unanesthetized animal. Potentiation of hippocampal response to septal stimulation after application of
a conditioning shock to entorhinal cortex WcS already demonstrated by Adey (Adey et al., 1958) and replicated in a preliminary fashion
-in our lab. The reverse, i.e., potentiation of hippocampal response to entorhinal stimulation following conditioning shock to septum, could not be demonstrated.
The Hippocampus as a Tissue
The precise arrangement of the pyramids such that all cell bodies are packed in a single thin layer, with the dendrites
perpendicular m this layer, has made this structure a favorite one for studies of brain potentials. A slow wave rhythm, "Theta
rhythm" (4-12 cps, depending on the animal in study) can be recorded from most parts of the hippocampus (Green, 1964). Although three different mechanisms were proposed for this rhythm (Stumpf, 1965), there are some accepted facts about its origin: (1) it is paced by cells in medial septal nucleus (Stumpf et al., 1962), (2) it is accompanied by intracellular waves recorded in pyramidal cells
(Fujita and Sato, 1964), (3) it is affected by cholinergic drugs (Stumpf, 1965), and (4) it is correlated with a variety of behavioral states. The basis issue in this field of research is whether
-16-(Vanderwolf, 1971). An orthogonal issue is whether or not it is related to learning, memory, and retrieval mechanisms. Again, some findings are accepted by all people involved in these issues:
(1) amount and frequency distribution of theta rhythm is different for different animals; rabbits have almost continuous theta rhythm whereas monkeys and humans seldom exhibit theta. Rats and dogs have intermittent rhythms. (2) some behavioral states are almost
always accompanied by this rhythm, the most notable of which is REM sleep, when the brain is awake and the body asleep. A theta
burst is evoked by a conditioned stimulus in at least some phases of a classical conditioning experiment, regardless of the animal's current behavior (Yokota and Fujimari, 1964; Konorski et al., 1968). It seems too, that theta rhythm accompanies attentional behaviors, when both orienting movements and recording of novel stimuli
The Hippocampus and Learning
The involvement of the hippocampus in various learning tasks has been documented by a variety of strategies. There are three main ways one can go about finding out the role of a brain area in learning: (1) correlate its activity with corresponding behavioral changes, (2) manipulate its activity and observe behavioral
changes, and (3) ablate it and look for effects on behavior. A fourth way, commonly used, is to look at the structure and speculate what the functions might be; one cannot avoid it when facing a
structure as organized as the hippocampus.
On the biochemical level, both the correlative and the
manipulative approaches have been intensively tried during the past decade. Only recently, with the development of regional and
miniature neurochemistry, has it been possible to demonstrate
that most of the observed changes in the brain, following training, are taking place in the hippocampus and related structures (Beach et al.·, 1969; Kottler et al., 1972; Yanagihara and Hyden, 1971; Kahan et al., 1970). The changes observed were mainly increased incorporation of labeled molecules into RNA and protein. Hyden
(Hyden and Lange, 1970) claims that there is an increase in synthesis of S-100 (specific acidic brain protein) which is specific to
-18-1972), and the precise localization of the drug effect is not completely established, it is still interesting to note that inhibition of protein synthesis in hippocampal areas disrupts memory (Flexner, 1968).
The correlation of gross electrical activity of the hippocampus (the theta rhythm) with various phases of learning has been
demonstrated in many laboratories. A series of experiments by Adey and his collaborators showed that in an alert cat there is theta in hippocampus, but fast, low voltage activity in dentate and subiculum (Radulovacki and Adey, 1965). During early stages of conditioning hippocampal theta leads similar activity recorded in entorhinal cortex. At latet stages of learning this phase relationship reverses (Holmes and Adey, 1960). At that time theta rhythm can be recorded from dentate as well. Marked frequency shifts during performance of single trials were detected in
further studies (Elazar and Adey, 1967). The generality of these results was questioned by many research groups (Grastyan et al., 1966; Bennett et al., 1971; Vanderwolf, 1971).
retention. The correlation of theta with strength of the memory trace was criticized recently by Klemm (1972). It should be remembereq that theta rhythm is not a product of hippocampal activity but rather a rhythm imposed upon the hippocampus via its septal afferents. In fact, there is a rather poor correlation between hippocampal unit activity and theta rhythm (Noda et al., 1969). It certainly would be interesting to know how theta rhythm affects hippocampal functions, but identification of theta rhythm with hippocampal activity is, to say the least, not accurate.
Hippocampal lesions have been the favorite tool of psychologists in studying hippocampal functions. A vast and confusing literature has accumulated during the past fifteen years. An excellent
-20-and hippocampal lesions have never been assessed, it might well be that the functions ascribed to the hippocampus are, in ·fact, projected into it via the entorhinal afferents. A more profound criticism is the recent discovery of the tremendous capacities of parts of the limbic system, as well as the visual system, to modify connections upon partial de-afferentiation (Linch et al., 1972; Raisman, 1970). It seems therefore, that in addition to lack of a hippocampus, these rats may have formed new unknown connections, probably with new functions assigned to these, and this factor just obscures possibly interpretation of lesion data. In the light of this point, it is not surprising to find
inconsistency between lesion experiments and those that temporarily knock out hippocampal activity (Hirano, 1965).
The best approximation of what the hippocampus does is what its elements are doing. Although recently developed, and used in only a few laboratories, the method of unit recording in awake freely moving animals promises what other methods have failed to achieve. By recording from the hippocampus and its afferents one can derive what the hippocampus is doing to information projected upon it by its afferents. A combined use of stimulation, lesions, and
B. GENERAL METHODS*
Subjects
All subjects in this study were albino male rats from the
Holtzmann Company. They were 12-15 weeks of age and weighed
between 250-350 grams.
Surgery
Each rat was anesthetized with sodium pentobarbital (Nembutal,
38 mg/kg) and introduced into the stereotaxic apparatus. Preliminary
preparation included drilling holes (0.5 mm in diameter each) in
the skull, puncturing the dura and implantation of an indifferent
electrode ("ground") into the anterior forebrain. Then the
implantation of the recording electrodes were started. The electrodes
were made of 62.5 ll nichrome (80% nickel, 20% chrome) wires. The impedance of these electrodes was approximately 100 K. With the
factory enamel insulation, they were 67.5 ll in diameter. Preparation of the electrodes from the wire consisted of cutting the wire with
scissors and inserting the blunt tip of the wire into the brain.
The coordinate system used consisted of the bregma as the zero
point for the anterio-posterior coordinates, the midline suture as
the zero line for medio-lateral coordinates, and the flat skull
-22-for dorso-ventral coordinates.
The wires were moved down into the brain to about 0.5 mm
from the target area. Then with the use of a micromanipulator,
CRT, and an audio display, the electrode was moved down, until
clear spikes of at.,least 100 lJV (i.e., 4:1 signal: noise) could
be monitored. For the most part, the knowledge of the characteristic
unitary activity of a given area helped to zero in on it. Therefore,
there were relatively few misses (i.e., recording from units in
areas irrelevant to the study). There were 8 electrodes implanted
in a rat, never more than 4 electrodies in one hemisphere. The
electrodes were first "tacked" to the skull with dental cement and
later assembled into a placque which was similarly affixed to the
skull. Throughout the surgery (2-3 hrs) rats were artificially
respirated.
Apparatus
A 12' circular plastic cage was housed in a sound attenuating
chamber. It contained a food tray from which the rat was hand
trained to retrieve 45 mg food pellets delivered by a noisy feeder.
It took approximately 0.5 sec between the delivery of the pellet
and the availability of the pellet to the rat. A special device
dropped the pellet out of the tray if it was not retrieved
end of every experiment, the number of unretrieved pellets were
counted and this nwnber served as one of the criteria for the
exclusion of a rat from the experiment. Water was supplied ad
libitum. A loudspeaker placed in the enclosure 1.5 feet from the
rat, provided two tones, 1 Khz and 10 Khz.
The rat's placque was connected to a 10 contact plug which
led through a low noise (Microdot) cable and a slip-ring commutator
to a panel, into which field effect transistor preamplifiers
were directly plugged. The weight of the plug, cord commutators
and preamplifiers was counterbalanced. Under these conditions the
rat was relatively free moving. No noise could be detected in
the system that was caused by the rat~ moving about the cage. A high noise open-e~wire was attached to the cable, and movements of the rat generated voltage in this wire, which was amplified
and served as a movement detector. The signals from the preamp
were fed into amplifiers with a frequency range of 500 to 10,000 hz.
The gain of these amplifiers was variable and set to produce a
noise level of 0.5 to 1 V, and accordingly the signal was 2-3 V
I
in amplitude. The output of the amplifier was fed into a unit
"window" discriminator. This discriminator used the amplitude and
the fall time of a spike as criteria for selection. It rejected,
upon appropriate setting, spikes of different amplitude or duration,
as well as various electrical noises. To assure exclusion of
-24-was taken and plotted throughout the whole experiment (Figure 1.4).
The discriminator, upon detection of a spike, produced a
0.1 msec binary pulse which was recorded on a IBM type by a PDP 8I
computer which controlled the experiment and accumulated the data.
Analysis of the data was done with the aid of a 370/155 IBM computer.
Histology
At the end of an experiment rats were sacrificed by means of
terminal anesthesia. Location of the recorded probes was marked by
passing 10 ~a positive current for 15 sec through the tip of the
electrodes. The brains were perfused with physiological saline
followed by 10% formalin. At least two days later, the brains
were sliced into 60· ~ slices on a freezing stage, and stained with
cresyl violet and Weil stains for alternate sections. These
procedures helped to locate accurately the recorded units by means
Figure 1.4
DISCRIMINATOR I t •I
LINE DRIVER
LINE SCANNER
LINE SCANNER
---~
A-D CONVERTER
TELETYPE
PDP 8!
BUS SWITCH
PDP 8
IBM MT
INCREMENTAL PLOTTER
I
N 0'\
C. TRACING A FUNCTIONAL PATHWAY IN THE LIMBIC
TELENCEPHALIC BRAIN
Experiment 1: The Development of a Conditioned Response in the
Hippocampus*
The first experiment was designed to find if information from
learned signals would follow the path outlined by the anatomy and
physiology of the hippocampus. Evidence for the emergence of a
conditioned response at one point along the pathway, and projection
of this response forward was sought by several means. One was to
determine whether two connected areas would show signs of learning
at the same time in the trial series. Another was to look for
similar learned responses patterns in two connected areas. A
third was to determine if closely linked areas would show a similar
amount of response generalization to the presentation of a neutral
stimulus which is not followed by food. Finally, a preliminary
analysis of response latencies was performed. Since a complete
study (to be presented later) was devoted to the analysis of
response-latencies, data for the preliminary analysis will not be
presented here.
-28-(i) Methods
Sixty Holtzman rats 12-15 weeks of age and weighing between
250-300gmserved as subjects. During a 3-4 day recovery period
after surgery the food supply was limited so that body weight was
reduced to 75% of the preoperative level. Following this each rat
was introduced to the training box.
The experiment was conducted on two successive days. On
the first day (pseudoconditioning) three events--delivery of the
food pellet and two tones--were presented randomly with an
inter-stimulus interval of 1 min; each was presented about 300 times in
a 16-hour period. This was followed by an 8 hour wait and then a
second day's experiment. The second day was divided into two parts.
First, 50 of each stimulus were presented as above (pseudoconditioning).
The second and main part of the day (conditioning) the food pellet
(US) was delivered 1 sec after the onset of one of the tones
(randomly selected and assigned as CS+). The other tone was presented
randomly (and assigned as CS-). Each of the tones was presented
Data Collection and Reduction
The collection of data was made for 3 sec periods including
the 1 sec pre=CS (background sample) and 1 sec CS-US interval and
1 sec after application of the US (see Figure 2.1). Each second
was divided into 100 bins, 10 msec each, and a binary record was
made indicating the presence or absence of unit detections for every
bin and every trial.
An
average probability histogram was preparefor successive 300 bins of 300 CS+ trials and 300 CS- trials during
a pseudo-conditioning and the same during conditioning.
Prior to analysis a number of cases were excluded from the
final sample for the following reasons: (1) failure to isolate
unit activity or inclusion of "noise" in the records (detected by
inspecting plotted samples of the identified units); (2) insufficient
data (i.e., the unit disappeared or change height during training,
causing the mean frequency in the 1 sec pre-CS to be ~ 1 response
in 5 sec); (3) inability to localize accurately the recorded site
in the brain. Based on these criteria 25 units were excluded
from the final sample.
The CS-US Interval
The 1 sec CS-US interval was divided into 4 quarters, each
being 25 successive bins. For each of these the average firing
-30-Figure 2.1
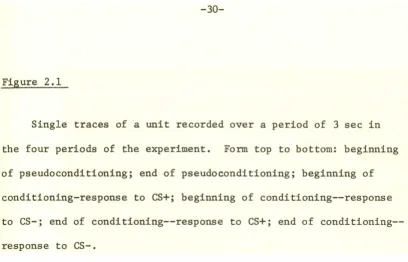
Single traces of a unit recorded over a period of 3 sec in
the four periods of the experiment. Form top to bottom: beginning
of pseudoconditioning; end of pseudoconditioning; beginning of
conditioning-response to CS+; beginning of conditioning--response
to CS-; end of response to CS+; end of
Rat '*9396 5-423 CA I
2
3
4
..
.
- • t I
5
1, 1 0 f\ ' 1 1 . ,
0 I o . , II! ••
• • - - . . . - < • · · - : -
-' I • .. • ., I I ' '.
6
1 I I I
TONE
PELLET
---~I , Beginning of Pseudoconditioning
2 End of Pseudoconditioning
3 Beginning of Conditioning CS +
4 Beginning of Conditioning
CS-5 End of Training CS
+
6 End of Training
-
-32-this was divided by the background standard deviation to yield a standardized score called a
"Q
score." It gave the rate during each of these post-stimulus quartiles as a number of standard deviations from the mean background rate. These scores provided quantitative representation of the averaged response pattern and were used in the following analysis.The Shape Analysis
The Generalization Ratio
It was impossible to make an accurate comparison of response change to CS+ with response change to CS- because responses to the CS- were not measured during pseudoconditioning. The unresponsiveness of units on the first day made it relatively unnecessary. Because such a large proportion of the responses on the second day were "learned," a reasonably accurate way to test for "generalization" to the CS- was to compare second day responses to the 2 stimuli. A "generalization ratio" was computed which stated response to the CS- as a percentage of the response to the CS+ for the quarterly interval yielding the largest CS+ score. Statements about
generalization derived from this measure were in accord with
observations made on the combined "learning curves" described below.
The Learning Curve
-34-(ii) Results
Description
140 units were identified, recorded and passed the various quality criteria (Figure 2.2). These units were divided into 4
main groups by areas: the dentate gyrus (43 units), CA-3,4 (41 units), CA-l (42 units), and subiculum (14 units). The boundaries of the
areas are in accord with Lorente de
No
(1934) and Raisman et al. (1965). No attempt was made to differentiate anterior-posterior levels. Almost all the units were located in the pyramidal layer of the Ammon's horn or the granular layer of the dentate gyrus.The Unit Activity during Pseudoconditioning
Most of the units did not respond to the tones during pseudo-conditioning. The units that did respond showed an intermittent short period of change from the background level of activity. It should be noted that the method of averaging 300 trials was
relatively-insensitive to changes in unit activity if the response to the novel stimuli habituated in a small number of trials.
However, 33% of the CA-3 units showed a significant response in at least one of the quarterly intervals; 20% of the GD units and 16% of those in the CA-l, and none of those in the subiculum. On the basis of the Q-scores, grand averages were computed for each brain area; i.e., all the Q
Figure 2.2
Distribution of the points in the hippocampus, marked on
sagittal sections of the rat brain. Sections are redrawn from
•
•
Early No chon9! response•
0
-36-(A
2180 )'/
. ~ 1760)1I
point, all the Q
2's to get the second, and so on (see Figure 2.3).
2
The .difference, by means of a x test, between the areas during pseudoconditioning was not significant statistically (.05 < p < .10) but it is interesting to note that CA-3 seemed more "responsive" than the dentate, whereas the subiculum was not responsive at all.
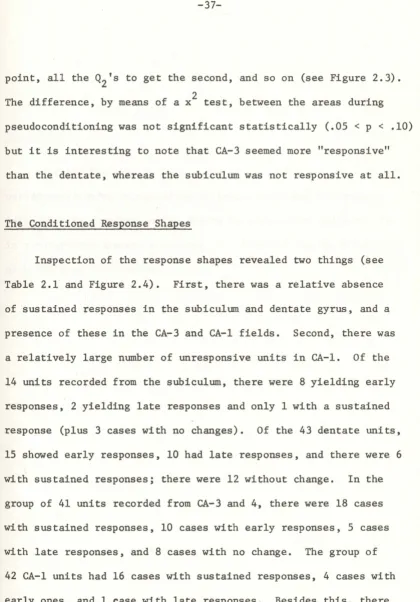
The Conditioned Response Shapes
Inspection of the response shapes revealed two things (see Table 2.1 and Figure 2.4). First, there was a relative absence of sustained responses in the subiculum and dentate gyrus, and a presence of these in the CA-3 and CA-l fields. Second, there was a relatively large number of unresponsive units in CA-l. Of the 14 units recorded from the subiculum, there were 8 yielding early responses, 2 yielding late responses and only 1 with a sustained response (plus 3 cases with no changes). Of the 43 dentate units, 15 showed early responses, 10 had late responses, and there were 6 with sustained responses; there were 12 without change. In the
-38-Figure 2.3
Subiculum
+
+
+
Dentate
+
---·~
I I I I
2
3
4
+
PSC
• CS
+ •
CS-... ...
~- ~ ~
l I I I
2
3
4
I w
\0
-40-were 21 cases without change in the CA-l area; this is a significantly
larger number without change than appeared in any of the other
fields. Although not considered as responding, 15 of these units
had a (-) sign to their largest Q score.
Generalization of the Conditioned Response
The amount of "generalization" was different for units in the
various areas. The subiculum and dentate units that showed mainly
an early transient response to the CS+, generalized it to the CS-.
However, units that had late transient responses
ro
the CS+ didnot respond to the CS- (see Figure 2.4).
The other hippocampal areas were less variable, and had
relatively small responses to CS-.
A comparison of averaged generalization ratios, by means of
a one~way analysis of variance, yielded a significant difference
among the areas (F
=
3.66 p < .05). There was less generalization in CA-3 averages than in the dentate ones (Figure 2.5). CA-l wasnot different from CA-3; subiculum was not different from the dentate.
A possible linear trend (t'
=
6.22 p < .10) was found in subiculum,Figure 2.4
Post-stimulus time histograms averaged over 300 trials each
for units in various hippocampal areas. For every unit 3 traces
represent the responses to a tone during pseudoconditioning
(PSV), to CS+ and CS- during conditioning. Scale- sec. Bar to
the left of every triad of traces represents a probability of
Rat # 9005
CA 3
Rat # 9064
CAl
PC
CS+
I
cs-2 3
PC
CS+
I
cs-Rat# 8808 Subiculum 2 2 3 PC CS+
cs-3Rat •
8611
Dentate
Rat # 8418
Dentate
Rat # 9028
Dentate
PC
CS+
I ~-L.&.A • . l . ,_.&. __ •-"•& -"--
cs-,~
I 2 3
..., ,., ~ ..,..., ,..._.... • ~ .... ,·~_..c-"r b£d " - • ... bll PC
CS+
1
cs-2 3
-- .__.. ~~~ ...___- " • ." ~~ ~~ ~ ....a-.. , . • ++ • '• nw. a A ~ ...,.,.., PC
CS+
~~~cs-2 3
I
~
N
Figure 2.5
Generalization ratio. For every responsive unit during
conditioning a ratio of the amount of response to CS- over
response to CS+ was calculated. The quarter of a second interval
yielding the biggest response to CS+ was chosen for the calculation.
-44-•
~-~
0.5
-...
...
-~
.,.
...
--0.25
~The Learning Process
The responses (i.e., changes in rate caused by CS+ orCS-) of
all the units in a given area were averaged in successive blocks
of 10 trials, starting from 30 trials before the point at which
the CS+ became correlated with the pellet. Based on these averages
(see Figure 2.6), analyses were performed on the learning curves
of the dentate, CA-3 and CA-l. The subiculum was analyzed separately
due to the small sample of units taken from this area. A 3-way
analysis of variance showed a significant difference between the
areas in their response to the correlated tone (F = 69.84 p < .01).
No significant interactions were found. Further analysis showed
a significant linear trend, indicating improvement from the beginning
to the end of training. This appeared in the dentate group where
it was largest, in CA-3 where it was smaller, and in the CA-l group
where it was smallest.
In order to determine the point at which the learning curves
start to deviate significantly from the averaged response to the
tone in the uncorrelated state (the first 3 points in Figure 2.6),
a Dunnett multiple t-test (Edwards, 1968) was performed on the
successive means of each averaged learning curve. The first points
to deviate from the mean of the uncorrelated trials with a p < .01
were found to be the third, fifth, and seventh in the dentate,
CA-3 and CA-l, respectively. The results of this analysis are
-46-Figure 2.6
Averaged learning curve for the various hippocampal areas.
Ordinate c number of trials; abscissa
=
probability of firing per10 msec bin. Arrow represents the point of beginning of the
.2
Movement .I
n=50
.16
Retrieval ·12 Behavior
.oa
n=33 .04
.02[
Subiculum .OI
n=14
0
.03~
Dentate .02
Gyrus n=35 .OI
0
.03~
CA 3 ·02
n=38 .0~
CAt
.03
.02
n= 34 ·01
... CS+
-o- CS
Dentate
CA-3
CA-l
Sub
-48-TABLE 2.1
Distribution of Response Shapes in the Hippocampus
Early
15
10
4
8
Sustained
6
18
16
1
Late
10
5
1
2
No Change
12
8
21
during the 20-30 trial period (3rd point), the dentate group response
was significantly above that of the CA-3 group; but during the
40-50 trial period (5th point) they were about equal. During the
40-50 trial period, both of these were significantly larger
than responses in the CA-l. During the 60-70 trial period (7th
point), CA-l had responses as large as those in CA-3 (but not as
high as those in the dentate group).
The subiculum was analyzed separately by means of a one-way
analysis of variance. This analysis did not yield a statistically
significant change in the responses during the sequence of blocks
of trials (F
=
1.37, p > .05).Background unit activity was sampled in the 1 sec pre-CS
periods. It was plotted and averaged (Figure 2.7) in a way similar
to that for the "response" curves. A two way analysis of var:J,.ance
was performed to compare the amount of background activity in
dentate gyrus, CA-3 and CA-l, and to study the changes in these
background rates from trial to trial. No trends indicating changes
from trial to trial were found. The difference between areas
(F = 37.95 p < .01) was significant. CA-l had the lowest background
rate of activity in comparison to dentate and CA-3.
As mentioned earlier, subiculum was analyzed separately.
Surprisingly, a one-way analysis of variance to detect changes
-so-Figure 2.7
Background activity recorded during 1 sec pre~cs period.
q-
~ (X)r() r()
II II II
c:
c: c:
.a -
r():J
.
'
<t <t
( / ) ( . ) (.)
Q
I
+
I
I
0
+
l() r() II
c:
0
(!)I
w
tO
q-
r()(\J
-
0
-52-difference between blocks (F
=
2.86, p < .01). There seems tobe in that area an increase in background activity which
accompanied the onset of conditioning followed by a later decrement.
(iii) Discussion
The analysis of the data presented above revealed many
differences among the areas of the hippocampus. In the process of
learning, dentate was the first area to acquire a "conditioned
response." Next was the CA-3 field and CA-l was last. The change
of CA-l units occurred 40-50 trials after the behavioral conditioned
response had already been established. The areas differed in their
characteristic averaged response to the conditioned stimulus.
The dentate· and the subiculum had a response of relatively short
duration (usually lasting not more than 300-400 msec). These
responses occurred either at the beginning or the end of the CS-US
interval and appeared to be correlated with orientation to the CS
and preparation for the US respectively. The units of CA-3 and
CA-l on the other hand had a characteristic response with a relatively
short latency (at least as early as the dentate early responses) and
this lasted throughout the whole
cs-us
interval (and indeed outlastedthe interval altogether in many cases).
In both pseudoconditioning and conditioning experiments there
showing responses. CA-3 field yielded more responses during
pseudo-conditioning; these were brief (similar to those which characterized
the dentate units after conditioning). CA-l was the only field
with a high percentage of unresponsive units after conditioning.
There were also marked differences in the degree of generalization.
The dentate early responses were more generalized (showing almost
no differences between CS+ and CS-). The CA-3 and CA-l responses
were by contrast well discriminated (showing clear difference between
responses to CS+ and CS- in almost all cases). Best discriminated
of all however were the late responses in dentate which were in
all cases clearly different for CS+ and CS- (as were the behavioral
responses to the two stimuli).
There were also some differences in background change during
the course of learning. The spontaneous activity rates (observed
in the recording periods just prior to CS ~plication) were relatively
constant during, ~efore, and after learning in dentate and in CA-3
and CA-l, but there were increases in background activity in
subiculum which occurred during the period of rapid behavioral
improvement and then returned to normal as the gross conditioned
response became stabilized.
In addition to these findings, other important differences
among hippocampal areas were observed in this experiment. These
were reported separately (Olds et al., 1972) and will be summarized
-54-responses (in the 10-20 msec range). CA-l units and dentate
units had somewhat longer latencies of their earliest conditioned
responses (the earliest observed were in the 20-40 rnsec range).
Subiculum units were not observed in large enough numbers to yield
a clear answer.
What conclusions can be derived concerning the nature of the
activity in the hippocampus circuit during conditioning?
Several different findings seemed compatible with the possibility
that a "conditioned response" emerged in the CA-3 field (or in its
entorhinal or septal afferent systems) and that the response was
projected from there to the CA-l field. The first supporting
evidence was that the CA-l response did not appear in the course
of training until after there was already a response in the CA-3
field. Second, there were the shorter latencies observed in the
CA-3 field. Third, there was the similar character of the responses
in the two areas (responses were relatively early in onset and were
sutained through and after the CS-US interval). Fourth, there was
the difference in responses between CS+ and CS- (which was the same
in both areas). These four similarities lent credence to the view
that these two areas are linked.
Other evidence exists that the projection was not simple and
that there were quite likely secondary synaptic changes between the
two fields. First, the CA-l responses did not appear concurrently
Second, there was the relatively smaller number of units which
developed conditioned responses in CA-l (it appeared that most
of the ~A-3 units were less selective in their readiness to
participate in a learning process). The projection from CA-3
into CA-l may therefore involve secondary changes occurring at
the linkage between the two fields. This would most likely be in
the synapses between the Schaeffer collateral axons and the CA-l
ap!cal dendrites.
All of the tests which indicated this possible relation
between CA-3 and CA-l were also applied to the relation between
the dentate gyrus and the CA-3 field. Only one of them seemed
compatible with a dentate to CA-3 projection: dentate units showed
learning changes earlier in the course of training than did the
CA-3 units. Several other findings, however, militated against
a projection of the conditioned response from dentate to CA-3.
First, there was a difference in response pattern between the
sustained responses of CA-3 and the transient ones that appeared in
the dentate gyrus. Second, there was a difference in degree of
generalization between CS+ and CS- , there was a large degree of
generalization in the early dentate unit responses but almost none
in the early CA-3 responses. Because of these findings against
projection of a conditioned response, the possibility was considered
-56-program the new responses in CA-3 which would then be triggered
or released by a different afferent system. However, there was
no observed change in the background activity of dentate gyrus
units during the course of conditioning. For all of these re~ons
it was scarcely conceivable that there was any significant direct
dependence of the CA-3 responses on their being triggered by dentate
afferents.
Nevertheless, CA-3 neurons represent the main projection field
of the dentate neurons and therefore some indirect relation of a
non-"triggering" nature must be presumed. The special relations
between dentate units and the overt behavior seemed to help clarify
one possible meaning of this indirect relation. Several facts
tied dentate units to behavior. The early and late dentate responses
were closely tied in time to the orienting response on the one hand
or to the food-preparatory response on the other. Also, in behavior
and dentate units, the early response was poorly discriminated
between CS+ and CS-, and the late response was well discriminated.
This suggested that they were fed back from behavioral performance
in some way. The possibility must be considered, therefore, that
dentate served to reflect information about ongoing behavior into
CA-3. This might serve in one way or another to modulate or
reinforce the activity of the hippocampal fields. The re-afferent
thereby accounting for the difference between the brief CA-3
response during pseudoconditioning and the relatively enduring CA-3
actitivy after conditioning had occurred.
The relatively late appearance of the hippocampal responses
in the course of the training rules out the possibility of its
involvement in the early phases of classical conditioning. It
leaves, however, the possibility of its involvement in the
establish-ment of a long term memory. This possibility was indicated by many
stimulation (9), and lesion (13) studies. An alternative
interpretation of the later appearance of conditioned responses
in these areas is suggested by the fact that the animals continued
to improve in performance of the retrieval behavior long after the
first signs of learning appeared, and this leaves open the
possibility of involvement of the hippocampus in elaboration of
skilled instrumental behavior (15).
One objection to the view that the conditioned responses
observed in hippocampus were generated by changes in synaptic
connection between afferents from septal area or entorhinal cortex
and the CA-3 elements lies in the possibility that the responses
were generated in one of those afferent systems (or earlier) and
projected to this point. Prior conditioned responses in other
brain areas are rendered somewhat unlikely because the conditioned
response latencies of some of the CA-3 units were among the
-58-at least a preliminary fashion, a fair sample of the brain. It
is possible nevertheless that conditioned activity in some other
area preset the CA-3 units to respond with a latency this short.
One candidate would be the subiculum which showed interesting
changes in background activity of the sort that would need to be
involved in any presetting mechanism (see Figure 2.7). The difficulty
is that the time course of background changes (which consisted of
a transient increment during the early part of the learning series)
did not have the same form as the learning curve for CA-3 units
(which consisted of an increment somewhat later which was not
transient). If there was a "presetting" afferent system therefore
it was more likely the entorhinal area or other similarly placed
sources of the perforant pathway, the latter being perhaps the
largest system of afferents projecting to CA-3. It is therefore
possible either t~at the entorhinal cortex elements set the CA-3
dendrites, via the perforant path, to respond with a short latency
to some other input--septum perhaps, or that there was actually
a local synaptic change in the connections between axons from
entorhinal cortex, or septum and the CA-3 dendrites. Further
experiments probing these two afferent areas are required to resolve
the issue. Both interpretations, however, agree that CA-3 may
have been the junction point upon which information converged,
Experiment 2: Analysis of Response Latency in
Hippocampus and Related Structures
The previous experiment demonstrated the progression of a
conditioned response through the hippocampus. A few points needed
further clarification: (1) Do dentate unit responses have longer
latencies than units in area CA-3, to which the dentate is projecting?
(2) What are the relations between the latencies of hippocampal
units'. responses and its afferents; what is driving the hippocampus? (3) Are the conditioned responses observed in hippocampus a mere
reflection of conditioning established elsewhere? Several
considerations led to the design of the present experiment. Since
the main variable of interest was the response latency, the finest
grain of separation within the limits of the instruments was used.
In order to optimize learning, a shorter CS-US interval and shorter
pseudoconditioning session were used. As another control and as a
consequence of the assumed involvement of the hippcampus in
extinction processes, an extinction session was introduced.
These procedures would reduce variability and give a more coherent
picture of response latency in the examined areas. On the other
hand, variables other than response latency having already been
-60-(i) Methods
Subjects
155 rats were used in this experiment.
Procedure
The experiment was conducted on two successive days. Each day
was divided into two equal sessions. First there were
pseudo-conditioning; two tones, each 400 msec in duration, and food
pellets were presented in random order, with random inter-trial
interval (mean= 1 min), 150 times each. Following was a
conditioning session, i.e., a food pellet was present 300 msec
after the onset of one of the tones. 150 trials of food
reinforced-tone (CS+) and non-reinforced reinforced-tone (CS-) were presented in this
session, distributed over equal amount of time as in the
pseudo-conditioning session. The first day was followed by an 8 hour wait
and then a second day's experiment began. This was identical to
the first day, with the order reversed: first conditioning, and
then pseudoconditioning extinction session.
Data Collection and Analysis
Unit activity was sampled during 150 msec prior to application
of the stimuli and for 300 msec from the onset of the tones. The
for the pre-CS period and 200 bins for the CS-US interval. Ten . successive trials were grouped (see Figure 3.1) and stored on an IBM tape for further analysis. Two types of analysis were done.
1. The Unit Response Latency. For every unit, an averaged firing histogram was prepared f