A Framework for Engineering Stress Resilient Plants using
Genetic Feedback Control and Regulatory Network
Rewiring
Mathias Foo1,†, Iulia Gherman1,†, Peijun Zhang2, Declan G. Bates1* and Katherine J. Denby3*
1. Warwick Integrative Synthetic Biology Centre, School of Engineering, University of Warwick, Coventry CV4 7AL, United Kingdom
2. Department of Animal and Plant Sciences, University of Sheffield, Sheffield, S10 2TN, United Kingdom
3. Department of Biology and Centre for Novel Agricultural Products, University of York, York YO10 5DD, United Kingdom
† Joint first authors. *Correspondence: [email protected], [email protected]
ABSTRACT
Unfavorable environmental conditions during the growth of crop plants can cause significant yield loss and reduction in quality. These conditions include abiotic stresses, such as drought and extreme temperature, as well as the biotic stresses of disease and herbivory. Climate change is driving increasingly unpredictable and variable weather, and bringing associated change in pathogen (and hence disease) prevalence and incidence.1, 2 It is therefore important to develop crops that are resilient to varying conditions and able to maintain yield in suboptimal environments.3 The introduction and/or removal of single genes via genetic engineering has led to plants with enhanced tolerance to particular abiotic and biotic stresses,4 however, often such approaches have unintended consequences on other plant responses,5 and in the case of disease resistance they may not be durable. Recent increased understanding of how plant responses to different environmental conditions are controlled and integrated, together with the development of systems biology approaches, has opened up the possibility of designing stress resilient crops using engineering principles. In this work, we have focused on transcriptional regulation, as transcriptional reprogramming is a significant component of plant stress responses6-8 and a point of cross-talk between responses to different stresses.9
In this paper we focus on the regulation of the defense response induced in Arabidopsis by the fungal pathogen, Botrytis cinerea.10 When pathogens infect plants, disease is the result of dynamic interactions between the two organisms. Pathogens secrete a range of proteins, small RNAs and metabolites to disrupt host defense and manipulate the extra- and intracellular environment to aid colonization.11-14 This is thought to explain why some positive regulators of defense are downregulated during infection, for example expression of TGA3 decreases during B. cinerea infection of Arabidopsis, yet plants lacking TGA3 expression are more susceptible to this pathogen.10 In this study, we use a control engineering approach to counteract such potentially pathogen-mediated perturbations of positive regulators of defense. Constitutive overexpression of such positive regulators would be an obvious approach, but this brings significant drawbacks; the positive regulator of defense may have other roles in the plant which are disrupted due to constitutively high levels of expression, and constitutive activation of plant defense responses is known to often impact on growth.15 Our proposed approach, which seeks to dynamically respond to perturbations of expression over the time-course of infection, should overcome these drawbacks.
these tools to the analysis and design of complex biological networks is now attracting significant interest within the synthetic biology community.17, 18 To date, however, the potential usefulness of such approaches for engineering more resilient plants has not been investigated.
Here, we explore how combining control engineering design tools19-21 with synthetic biology techniques could be used to enhance resistance against B. cinerea in Arabidopsis by preventing downregulation of a positive regulator of defense during infection. We design and test our controller using a model of the Arabidopsis gene regulatory sub-network underlying the transcriptional response to B. cinerea infection. This network model is formulated using ordinary differential equations (ODEs) and constructed from experimental data using network inference and system identification techniques. It is then validated against different time-series transcriptome datasets capturing the response of the plant’s regulatory network to pathogen attack. Simulation results show the capability of the proposed approach to significantly reduce the perturbation of a positive regulator of plant defense in response to infection. We propose a novel strategy for implementing the controller experimentally, which avoids the need for the incorporation of any exogenous synthetic control circuitry. This strategy is based on the insight that the network motif required for the controller can be implemented by rewiring the regulatory regions of existing genes in the plant’s stress-response network. We show how this can be done through the addition of gene coding sequences under the control of alternative regulatory regions.
RESULTS
consensus network to limit it to 8,830 edges. Furthermore only the top three regulators of each node were kept based on the highest probability score. From this final network, we looked for sub-networks surrounding positive regulators of defense against B. cinerea that were downregulated during infection. This led us to focus on a 9-gene regulatory network, termed 9GRN (see Figure 2) containing the TF CHE, which includes predicted upstream regulators of CHE.
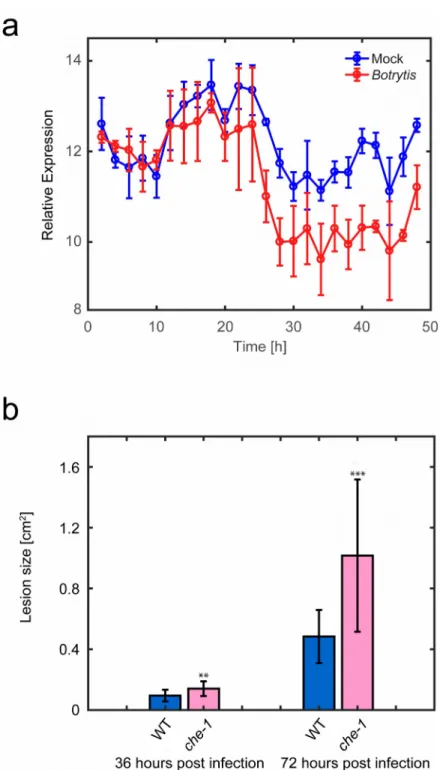
CHE is a positive regulator of defense against B. cinerea. Expression of the transcription factor (TF) CCA1 HIKING EXPEDITION (CHE) is downregulated during B. cinerea infection (ref 10 and Figure 1a). Rhythmic expression of CHE is clear in the mock-inoculated samples (reflecting the role of CHE within the circadian clock27) with downregulation due to infection beginning around 22 hours post inoculation. A mutant with significantly reduced expression of CHE, che-1,27 shows increased susceptibility to B.
cinerea compared to wildtype indicating CHE plays a positive role in defense against this pathogen (Figure 1b). In addition to CHE, two other genes in the 9GRN are important in defense against B. cinerea: ORA59 and at-ERF1. ORA59 is a positive regulator of defense28 and at-ERF1 is a negative regulator of defense (Figure S1).
Validating edges in the 9GRN model. To increase our confidence in the validity of the inferred 9GRN sub-network model, we used yeast-1-hybrid (Y1H), a partial Arabidopsis cistrome map29, and gene expression data from RAP2.6L overexpressors30 to test regulation predicted by the model. A set of pair-wise Y1H had been carried out testing binding of 75 TFs to the promoter regions of 34 of the same TFs. Within this set, there were 4 edges in our model (RAP2.6L to ANAC055; ANAC055 to RAP2.6L, ANAC055 to ORA59 and at-ERF1 to ORA59) that had been tested. For two of these edges, strong binding was seen in the Y1H experiments; RAP2.6L could bind to the promoter of ANAC055 and at-ERF1 could bind to the promoter of ORA59 (Figure S2). In addition, the Y1H data suggested two additional edges that were missing from our model (RAP2.6L to ORA59, and ORA59 to ANAC055), however, expression data from RAP2.6L overexpressors30 and knockout mutant of ORA5928 do not show any evidence for these regulatory edges. Additional interactions in the 9GRN were verified using data from an Arabidopsis cistrome map.29 The cistrome is the complete set of cis-elements or TF binding sites in an organism, and a partial map was generated by O’Malley et al.29 using DNA affinity purification sequencing (DAP-seq) to identify TF binding sites for 349 TFs (including CHE, ORA59, ANAC055 and MYB51 from our network). This analysis revealed that ANAC055 can bind to the promoters of ORA59 and RAP2.6L. Finally,
evidence for this regulatory interaction.30 Edges with supporting experimental data are shown in green in Figure 2.
A validated dynamic model of the CHE regulatory sub-network. The network inference algorithms used to infer the large consensus network model are able to predict regulatory relationships between the genes in the 9GRN but the type of regulation (i.e. activating or inhibiting) cannot be determined. Since these are essential features of any model that can be used for controller design, we next determined the direction of the regulatory edges in the 9GRN using standard four-step system identification techniques: data collection, model structure selection, parameter estimation and model validation (see chapters 1 and 7 of ref 31). Previous studies that utilized this technique to identify regulation types in GRNs used
linear models 31-33, and there is now strong evidence that the underlying dynamics of GRNs can be accurately described using such models (we define accurate as a model able to recapitulate experimental data within a single standard deviation of error).34, 35 Moreover, as the model is subsequently to be used to design perturbation mitigation strategies, a linear model facilitates the use of linear control design techniques that are more established than their nonlinear counterparts. In system identification terminology, black box models refer to a set of ready-made models with no physical structure or biological interpretation. On the other hand, gray box models refer to models that are tailor-made given some prior information about the system. Since we have prior knowledge of the direction of regulation between the genes obtained from the inferred network above, we use a linear gray box model comprising nine ODEs (Equation 4 in the Methods section) for the 9GRN, and thus only need to identify the regulation type and dynamics within the 9GRN.
Additionally, the model shows good predictive capability against two mutant datasets (see Figure S4).
Design of a feedback controller for perturbation mitigation. As outlined above, our control objective is to employ feedback to prevent the reduction in CHE levels when the plant is subjected to pathogen attack. There are several frameworks available for designing genetic controllers.19, 21, 41 In refs 19 and 41, the authors proposed and extended a framework for implementing an integral controller using a negative feedback of a two-promoter gene network. In ref 21, the authors analyzed the dynamics of gene regulation using frequency domain tools from control theory and proposed the implementation of a genetic phase lag controller. Here, we based our design on the framework proposed in Harris et al.21, where the proposed genetic controller is made up of a combination of genes and the regulatory relationships between them. In ref 21, these gene regulations are modeled using nonlinear Michaelis-Menten type functions and these functions are then linearized such that the controller design and analysis can be done using standard frequency domain methods. In this study, since we have used a linear model to describe the 9GRN, we also model the gene regulations in the controller using linear functions.
Figure 4a shows the genetic circuit diagram of the proposed feedback controller. The controller architecture is modified from the framework suggested in ref 21, whereby for the purposes of implementation in plants we replace the protease degradation component with a transcriptional inhibitor component. The modified circuit contains three genes and their associated proteins: genes X, Y and E giving proteins X, Y and E.
Let X denote an arbitrary gene that can be regulated by E, and its translated protein X denotes the TF that can regulate the output gene, Y, whose levels we ultimately want to control. E denotes the protein whose function is to regulate gene X and calculate the error signal. Here the error signal is the difference between the desired reference level and the output signal Y (see Section S1 of the Supporting Information). The ODE for the regulation of X by E is given by:
dX
dt
=α
X , EE
−β
XX
+
b
S, X(1)
Here, α, β and bS represent production rate, degradation rate and basal expression level
respectively. With Y being the output of the process that we want to control, then the ODE describing the regulation of Y by X and E can be written as:
(2)
Y (s)
E(s)=
(
s+βX+(αX , EαY , X/αY , E)
s+βX
)(
αY , E
s+βY
)
(3)Equation 3 is the open-loop transfer function from E to Y. In control theory, an open-loop transfer function is defined as the ratio of the output signal to the input signal in the absence of feedback and it is usually composed of the product of the transfer functions of the controller and the process. In a transfer function, the solutions making the numerator to zero are called the zeros of the system while the solutions making the denominator zero are called the poles of the system. Since Y is the output of the process, its transfer function is
given by
(
αY , E/(
s+βY)
)
. Thus, the transfer function of the controller is then given by(
s
+
β
X+(
α
X ,Eα
Y ,X/
α
Y , E))/(
s
+
β
X)
, where the zeros and poles of the controller arez
=−((
β
X+(
α
X ,Eα
Y ,X))/
α
Y ,E)
andp
=−
β
X , respectively. Since |p| < |z|, we obtain aphase lag controller. In control engineering, phase lag controllers are commonly used to
improve disturbance rejection and reduce steady-state error,42 and thus they are well suited to our control objective of achieving perturbation mitigation. Interestingly, based on the schematic diagram of the phase lag controller as shown in Figure 4a, we note that this controller structure is equivalent to a coherent feedforward loop type-I network motif,43, 44 but with an added feedback loop. The role of this network motif in natural biological systems has been subjected to extensive studies and one of its key roles includes perturbation attenuation.45, 46
We illustrate here in simulation the use of the genetic phase lag controller in mitigating the perturbation affecting CHE in the 9GRN. The configuration for perturbation mitigation using the genetic phase lag controller is shown in Figure 4b. In 9GRN, the output gene Y is CHE and the feedback is delivered by CHE’s transcriptional repressor activity on gene E. As with standard perturbation mitigation strategies in feedback control theory, when a perturbation causes the output level to deviate from its desired level, the controller upon detecting this deviation will react in order to restore the output to its desired level.
of CHE oscillating around 12.33. Moreover, this control strategy is shown to be robust against variation in model and controller parameters through a Monte Carlo simulation (see Methods section), where we randomly varied the parameters within 20% of their nominal values.
It is known from control theory that to exactly restore the output to the desired reference level after a step disturbance requires an integral-type controller.47 In terms of the controller transfer function, an integral-type controller has a pole at s = 0. The transfer function of the phase lag controller given in Equation 3 has a pole at s = –βX, and therefore
the slower the degradation rate for X (which corresponds to a longer mRNA half-life), the more closely the controller will implement an integral-type control action that exactly restores the output to the desired reference level after a disturbance. In Arabidopsis, the longest half-life reported for mRNAs is approximately 26 hours,40 which corresponds to a degradation rate of 0.026 /hour (calculated using the standard equation for exponential decay, β = ln(2)/T
) and therefore we have used this value in our simulations (blue solid line in Figure 4c). Full details of all the equations and parameter values underlying the simulations shown in Figure 4c can be found in Section S2.1 of the Supporting Information.
Controller implementation using regulatory network rewiring. The direct implementation of the proposed controller in Arabidopsis presents a number of challenges, largely due to the choice of TFs for E and X and associated binding sequences. In ref 21, the suggested genes for E and X are RhaS (E in Figure 4a) and XylS (X in Figure 4a). RhaS activates the production of XylS and CHE through a coherent feedforward loop, and XylS also acts as a regulator for the production of CHE. However, orthogonal TFs may not function in plants whilst using endogenous TFs is likely to have unintended consequences on other processes. To get around these problems we propose an alternative approach for implementing the proposed controller, based on network rewiring. As shown in Figure 4a, (and Section S6 of the Supporting Information) the structure of a genetic phase lag controller is composed of a coherent feedforward loop type I motif with negative feedback. Thus, if we are able to realize this network motif through the rewiring of the 9GRN, we can obtain a genetic phase lag controller without the need to introduce new non-endogenous genetic circuitry.
For the 9GRN network shown in Figure 2, there are 46 potential rewiring combinations that can realize the network motif of a phase lag controller. However, not all genes within the 9GRN can be used in the rewiring exercise, due to functional constraints. Genes ATML1, LOL1 and AT1G79150 are not suitable for rewiring, as during B. cinerea
hence we would not wish to increase its expression further. Using at-ERF1 as part of the positive regulation of the network motif, however, would lead to an increase in its expression. In addition, the gene ORA59 is a positive regulator of defense, so decreasing its levels would negatively affect the defense response to B. cinerea. The gene RAP2.6L is highly responsive to stress hormones30, 48 and while its involvement in infection with B. cinerea has not been conclusively proven, we have also chosen to discard rewiring combinations that decrease its levels. Taking these constraints into account, we are left with 11 possible rewiring combinations (see Section S3 of the Supporting Information). Further analysis of these 11 rewiring combinations (see Section S3 of the Supporting Information) reveals that the rewiring strategy that requires the least amount of experimental modification involves the pathway from MYB51 (E) to ORA59 (X) to CHE (Y). Note that we have included the equivalent function of the genetic phase lag controller in brackets.
Figure 5a shows the rewiring configuration using the pathway from MYB51 to ORA59
to CHE. To realize the required network motif, CHE must inhibit expression of MYB51, and MYB51 and ORA59 must activate CHE expression. Implementing this in simulation, with the perturbation introduced at time 120 hours, we notice only a small recovery in the expression level of CHE from around 9.77 to 10.31 after the perturbation (Figure 5a). Why is the increase in the level of CHE small given that we have implemented a phase lag controller through network rewiring? From Equation 3, we note that the pole of the phase lag controller is given by the degradation rate of X, and in this network motif, this corresponds to the degradation rate of ORA59. From Table 3, the value of the degradation rate of ORA59 is 38.0062, which corresponds to placing the pole at s = -38.0062. From our previous discussion, it is desirable to have the pole of the controller to be as close to 0 in order for the controller to restore the output to its desired reference level. To move the pole associated with ORA59 closer to 0, we use positive autoregulation19, 21, 49, i.e. we further rewire the network so that ORA59 activates itself. As expected, with the addition of auto-activation of
ORA59, we observe that the expression level of CHE begins to show a significant increase at around 140 hours. However, instead of returning to its original level, it increases by an extra 15% compared to its original value (Figure 5b). A detailed look at the plot of MYB51 reveals that the error computed by MYB51 is higher than expected. The reason for the incorrect error computation is that there is unmodeled regulation affecting MYB51 (see Equation 4 in Methods section and Section 5 of Supporting Information). As a result, the controller ‘sees’ a larger error than actually exists, and thus exerts a higher control action to mitigate this error, resulting in the observed further increase in the expression level of CHE.
independent of the process output, this is equivalent to using a feedforward controller. With the addition of autoregulation and feedforward control, the simulation results in Figure 5c show that the phase lag controller implemented via rewiring is now able to significantly attenuate the effect of the perturbation on CHE and return it to its original expression level. Additionally, the Monte Carlo simulations (see Methods section) show that the proposed strategy is robust against parameter variations. The details of the equations and parameter values underlying the simulations shown in Figure 5c can be found in Section S2.2 of the Supporting Information.
DISCUSSION
We have presented a novel strategy, based on the use of feedback control, for mitigating the effects of pathogen attack on plant gene regulatory networks, and demonstrated via simulation the ability of this approach to restore the levels of CHE, a key defense gene in Arabidopsis, after infection by B. cinerea. The use of simple rewiring such as negative autoregulation of CHE and direct regulation from ANAC055 was found to be insufficient for restoring the level of CHE, therefore we employed a coherent feedforward type I motif with negative feedback. In order to develop the strategy, we employed system identification techniques to build and validate a new dynamical model of the infected gene regulatory sub-network that accurately predicts the type of regulation between each node of the sub-network. Then, using this model, we designed perturbation mitigation strategies using feedback control theory. In the proposed approach, we applied a combination of two positive and one negative regulatory interactions to implement genetic circuitry realizing a phase lag controller. Phase lag controllers are widely used in engineering systems to reduce the effects of disturbances on system performance, and have been proposed as a useful motif for implementing synthetic biological control systems.21 To date, however, practical strategies for implementing such controllers in vivo remain to be elucidated. Here, based on the observation that this control architecture resembles a coherent feedforward loop type-I with negative feedback, we propose a novel controller implementation strategy based on identifying groups of genes within the 9GRN whose regulation can be rewired to realize this network motif. Within the 9GRN, rewiring the pathway from MYB51 to ORA59 to CHE was shown to provide the most straightforward implementation of the phase lag controller. When suitably augmented with rewired autoregulation and feedforward components, this implementation of the controller was shown to deliver almost perfect perturbation mitigation without the need for any non-endogenous synthetic circuitry.
region or TF binding sites combined with a minimal promoter sequence. Given that there are multiple TF binding sites in a typical promoter sequence (see e.g. ref 50), it is preferable to use specific TF binding regions. For the rewiring we propose for the 9GRN, regulation of
MYB51 by CHE, CHE by ORA59, and ORA59 regulation of its own expression, could be
achieved using specific promoter regions that have been shown to confer the necessary regulation to drive expression of copies of the target TF coding sequence. CHE binds to the promoter of its target gene CCA1 at the sequence GGTCCCAC.27 Both the region 363 to -192 bp of the CCA1 promoter encompassing this sequence and a trimer of the CHE binding sequence have been shown to be bound by CHE.27 ORA59 binds to two GCC boxes (GCCGCC and GCAGCCGCT) in the PDF1.2 promoter and a tetramer of one of these boxes is sufficient for ORA59 activation of expression.51 The other regulatory edges required for rewiring (MYB51 activation of CHE expression and ANAC055 inhibition of MYB51) would currently require using the full length promoter sequences and potentially fusion of transcriptional repression domains. Rewiring using full-length promoter sequences could be achieved relatively quickly (1-2 years) and methods to insert multiple gene constructs into Arabidopsis are available (for example, Golden gate cloning52). However,the site of insertion of the necessary transgenic constructs (which is not controlled) may also influence resulting levels of expression and hence further optimization/selection of lines with appropriate levels will no doubt be necessary.
to other environmental conditions. For example, MYB51 promotes expression of indolic glucosinolate biosynthetic genes54 in response to mechanical stimuli and ANAC055 is induced by drought, salt and abscisic acid stress.55 Changes in the expression of these genes due to other stimuli could prevent the controller from operating during B. cinerea
infection (for example, induction of ANAC055 would lower levels of MYB51 and indicate a lower level of error to the controller, leading to the controller not reacting properly). Our controller is not designed to handle more than one perturbation (environmentally induced shift in gene expression) and this limitation raises another key challenge in plant systems biology. The development of novel approaches to model and simulate dynamic networks of sufficient size to capture environmental stress cross-talk will significantly improve our ability to rationally engineer stress resilient plants.
METHODS
Transgenic Arabidopsis line. The CHE T-DNA insertion line, SALK_143403c, was obtained from the SALK collection56 and confirmed to be homozygous. Expression of CHE in this line is significantly reduced compared to wildtype (Col-0).27 The coding region of
at-ERF1 was cloned into the pB7WG2 vector57 and stable transgenic Arabidopsis lines generated in a Col-4 background. The coding region of at-ERF1 was cloned into the pB7WG2 vector57 and stable transgenic Arabidopsis lines generated in a Col-4 background.
Infection assay. Arabidopsis plants were grown and B. cinerea strain pepper58cultured as described in ref 10. Leaves from 5-week-old plants were detached and placed on 0.8% agar in propagator trays. Each leaf was inoculated with a single 10μl droplet of B. cinerea
inoculum, or a 10μl droplet of sterile grape juice diluted in a 1:1 ratio with sterile water. Each tray contained 9 control leaves and 81 infected leaves, with control and infected leaves in each row. The trays were covered with lids and kept in a growth cabinet under a 16:8 hour light:dark cycle at 22°C, with 90% humidity. Lesion area was assessed from photographs using ImageJ. Mean lesion area of leaves from WT and T-DNA insertion lines were compared using a Student’s two-tailed t-test, which assumed equal variance.
strain Y187 (Clontech) was transformed with the individual vectors to create the bait strain. The promoter strain was spotted onto YPDA (yeast, peptone, dextrose, adenine) plates, overlaid with the TF strain, and incubated for 24 hours at 30°C. The diploid cells were replica plated onto selective plates and incubated overnight. This was followed by replica-cleaning and incubation for 4 days, after which growth was scored. Each interaction was tested twice. Primer sequences for the promoter fragments are given in Table 1.
Table 1: Primer sequences for cloning promoter fragments for Y1H.
Gene Forward Primer Reverse Primer
AT1G06160 AAAAAAGCAGGCTTCGTGCAAT TGATCACTATATTAGTTGAACTG CAAGAAAGCTGGGTCGTGTCTAA GTGGCACTAAGTTTGGG AT1G06160 AAAAAAGCAGGCTTCCCGCCTT AGTTTCTGACAGAGTTTCGACTC CAAGAAAGCTGGGTCGAGTGTA TGACGTACGGCGGCGTATTCCCG AT1G06160 AAAAAAGCAGGCTTCCTGTTCTG TCGAGTTGTTGCTTGTTGAGCC CAAGAAAGCTGGGTCTGTGGGCA AAATAGGTCAAACATGCGGC AT3G15500 GGGGGAATTCATAAGAGGAGGT
ACAGTCACACA GGGGAAGCTTACGCGTCGAAGCTCTGCTACTCGTGTATGTAT AT3G15500 GGCCGAATTCATCCCATCATTC
ACTTACAC GGGGAAGCTTACGCGTGATCAATTAGAGCGTCGTGATTTATGC AT3G15500 GGGGGAATTCGTTTGTTGTTTG TCCCTCTCTCTGA GGGGAAGCTTACGCGTTGAGTT ACATAACAGTGACAATCTACGA AT3G15500 GGGGGAATTCGAGAAGCGTGT TTGTGTTATACGGACTTA GGGGAAGCTTACGCGTTGTGTC TATTGGTTGAGTTAGGC
Accession numbers. Arabidopsis gene names and AGI locus codes referred to in this article are shown in Table 2.
Table 2: Associated AGI to Arabidopsis gene names.
Gene name AGI
ORA59 AT1G06160 MYB51 AT1G18570 LOL1 AT1G32540 AT1G79150 AT1G79150 ANAC055 AT3G15500 at-ERF1 AT4G17500 ATML1 AT4G21750 CHE AT5G08330 RAP2.6L AT5G13330
Generating a dynamic model of the CHE regulatory sub-network. Traditionally, a model of a gene regulatory network comprises both transcription and translation mechanisms. However, in our case, given that only mRNA accumulation time-series data are available10, the following two assumptions are made in building the 9GRN model. Firstly, the translation of the protein from mRNA follows a linear relationship and secondly, the behavior of the translated protein follows its mRNA closely. With these two assumptions, we can group together the protein translation rate with the mRNA transcription rate resulting in the entire 9GRN being modeled using only mRNA data. Based on the above assumptions, the model of the 9GRN shown in Figure 2 can be described by the following ODEs:
dN
ORAdt
=α
ORA ,1N
MYB+
α
ORA ,2N
ANA+
α
ORA ,3N
ERF+
β
ORAN
ORA+b
S , ORAdN
MYBdt
=
β
MYBN
MYB+b
S , MYB+c
MYBW
dN
LOLdt
=
β
LOLN
LOL+b
S , LOL+c
LOLW
dN
AT 1dt
=α
AT1,1N
CHE+
α
AT1,2N
RAP+
β
AT1N
AT1+b
S , AT1+c
AT1W
dN
ANAdt
=α
ANA ,1N
RAP+
β
ANAN
ANA+b
S , ANA+c
ANAW
dN
ERFdt
=
β
ERFN
ERF+b
S , ERF+c
ERFW
dN
ATMdt
=α
ATM ,1N
RAP+
β
ATMN
ATM+b
S , ATM+
c
ATMW
+
γ
ATML
dN
CHEdt
=
α
CHE ,1N
LOL+α
CHE ,2N
AT1+
a
CHE ,3N
ATM+
β
CHEN
CHE+
b
S , CHE+γ
CHEL
dN
RAPdt
=
α
RAP ,1N
ANA+
β
RAPN
RAP+
b
S , RAP+
c
RAPW
(4) where αi,j ∈ (–∞,+∞), βi > 0, γCHE > 0, bS,i ∈ (–∞,+∞), and ci ∈ (–∞,+∞) are the unknown
light and CHE follows a sinusoidal rhythm as known.27 For details on the mathematical representation for W and L see Section S5 of the Supporting Information.
The values of the model parameters were estimated from the available mRNA time-series data using a nonlinear least squares algorithm and the estimated parameters are given in Table 3.
Table 3: Estimated parameters of the linear model
Gene Name Values
ORA59 αORA,1 = 14.3800, αORA,2 = -0.7359, αORA,3 = 21.5714, βORA = -38.0062, bS,ORA = 15.2355
MYB51 βMYB = -0.6658, bMYB = 5.6277, cMYB = 1.1890 LOL1 βLOL = -0.0485, bS,LOL = 0.4874, cLOL = -0.1241
AT1G79150 αAT1,1 = 0.7577, αAT1,2 = -0.7408, βAT1 = -2.4088, bS,AT1 = 23.863, cAT1 = 0.91809 ANAC055 αANA,1 = 25.6935, βANA = -28.4685, bS,ANA = 0.0517, cANA = 82.5415
at-ERF1 βERF = -0.2051, bS,ERF = 1.8699, cERF = 0.8735
ATML1 αATM,1 = -0.7945, βATM = -1.1142, bS,ATM = 19.3684, cATM = 0.0040, γATM = 0.5000
CHE αCHE,1 = 24.5024, αCHE,2 = 3.3801, αCHE,3 = 17.6771, βCHE = -40.1258, bS,CHE = 3.7167, γCHE = 16.8001
RAP2.6L αRAP,1 = 0.4186, βRAP = -0.7933, bS,RAP = 3.7046, cRAP = 0.0045
All the simulations of the ODE models, phase genetic controller and network rewiring are done using MATLAB built-in solver ode45, and the initial condition for each gene to solve the ODE is the first data point of the mRNA time-series for each respective gene. For the simulation using the genetic phase lag controller (Equation S2.1), the initial conditions for solving the ODEs for X and E are set to 0.
Parameter estimation. For the 9GRN linear model, the values of the unknown parameters are estimated from the available mRNA time-series using nonlinear least square, given by
^
θ=
argmin
θ1
N
L∑
i∈ψ∑
t=1 NL[
N
i(
t
)− ^
N
i(
t ,θ
)
]
2(5)
where θ = [αi, βi, bS,i, ci] with i∈ ψ = [ORA, MYB, LOL, AT1, ANA, ERF, ATM, CHE, RAP],
NL is the length of the time-series data,
N
^
is the simulated data from Equation 4 and N isAs a quantitative measure of the model performance, we compute the Mean Square Error (MSE) for each gene between the experimental data and the model given by Equation 4. The MSE for each gene is computed as follows:
MSE= 1
NL
∑
t=1 NL[
N(t)− ^N(t , θ)]
2(6)
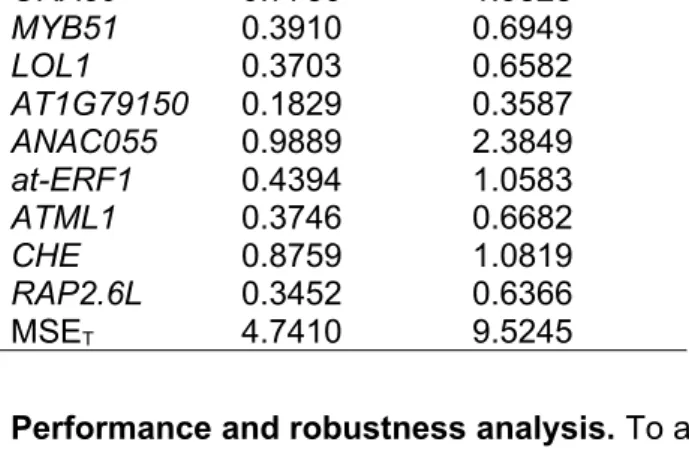
The total MSE, MSET is computed by summing the MSE for all nine genes in the 9GRN. Table 4 shows the MSE values for both the training and validation data sets.
Table 4: MSE for both training and validation data sets. Gene Name MSE
(Training)
MSE (Validation)
ORA59 0.7730 1.9828
MYB51 0.3910 0.6949
LOL1 0.3703 0.6582
AT1G79150 0.1829 0.3587
ANAC055 0.9889 2.3849
at-ERF1 0.4394 1.0583
ATML1 0.3746 0.6682
CHE 0.8759 1.0819
RAP2.6L 0.3452 0.6366
MSET 4.7410 9.5245
Performance and robustness analysis. To analyze the performance and robustness of the proposed strategies, we perform a Monte Carlo simulation where we randomly draw all the parameters from a uniform distribution. Then, we vary the parameters within ranges of 20%, around their nominal values. Mathematically, we have p(1 + ΔP(x)), where p denotes the model and the controller parameters, P(x) is the probability distribution and Δ = 0.2. Using the Chernoff bound and associated guidelines for Monte Carlo simulation, a total number of 1060 simulations is required to achieve an accuracy level of 0.05 with a confidence level of 99%.62, 63
ASSOCIATED CONTENT
Supporting Information
Comprises supplementary text, supplementary figures and supplementary files referenced in this article. The supplementary files contain lists of Arabidopsis TF genes, their associated biological functions and TF genes that are differentially expressed during B. cinerea
infection. These are available free of charge via the Internet at http://pubs.acs.org
AUTHOR INFORMATION
Email: [email protected], [email protected]
Author Contributions
KJD and DGB conceived the study. MF and IG developed the models and simulations. Experimental data was generated by by PZ and IG. MF, IG, DGB, and KJD analyzed the data. All authors reviewed and wrote the manuscript. †MF and IG are joint first authors. MF is currently with the School of Mechanical, Aerospace and Automotive Engineering, Coventry University, CV1 5FB, United Kingdom.
Notes
The authors declare no competing financial interests.
ACKNOWLEDGEMENTS
This work was supported by the Biotechnological and Biological Sciences Research Council (BBSRC)/Engineering and Physical Sciences Research Council (EPSRC) Warwick Integrative Synthetic Biology Centre (WISB) via research grant BB/M017982/1 (MF, KJD, DGB) and the EPSRC/BBSRC Oxford/Warwick/Bristol Centre for Doctoral Training in Synthetic Biology (SynBio CDT) via research grant EP/L016494/1 (IG). PZ and KJD were supported by the BBRSC/EPSRC-funded grant Plant Response to Environmental Stress
Arabidopsis (BB/F005806/1).
REFERENCES
(1) Bebber, D. P.; Ramotowski, M. A. T.; Gurr, S. J. (2013) Crop pests and pathogens move polewards in a warming world. Nature Clim. Change 3, 985-988.
(2) Bebber, D. P.; Holmes, T.; Gurr, S. J. (2014) The global spread of crop pests and pathogens. Glob. Ecol. Biogeogr. 23, 1398-1407.
(3) Buchanan-Wollaston, V.; Wilson, Z.; Tardieu, F.; Beynon, J.; Denby, K. (2017) Harnessing diversity from ecosystems to crops to genes. Food Energy Secur. 6, 19-25.
(4) Parmar, N.; Singh, K. H.; Sharma, D.; Singh, L.; Kumar, P.; Nanjundan, J.; Khan, Y. J.; Chauhan, D. K.; Thakur, A. K. (2017) Genetic engineering strategies for biotic and abiotic stress tolerance and quality enhancement in horticultural crops: a comprehensive review. 3 Biotech 7, 239.
(5) Veronese, P.; Nakagami, H.; Bluhm, B.; AbuQamar, S.; Chen, X.; Salmeron, J.; Dietrich, R. A.; Hirt, H.; Mengiste, T. (2006) The membrane-anchored BOTRYTIS-INDUCED KINASE1 plays distinct roles in Arabidopsis resistance to necrotrophic and biotrophic pathogens. Plant Cell 18, 257-273.
the response to water deficit, high temperature, and agricultural environments. Plant Cell 28, 2365-2384.
(7) Lewis, L. A.; Polanski, K.; de Torres-Zabala, M.; Jayaraman, S.; Bowden, L.; Moore, J.; Penfold, C. A.; Jenkins, D. J.; Hill, C.; Baxter, L.; Kulasekaran, S.; Truman, W.; Littlejohn, G.; Prusinska, J.; Mead, A.; Steinbrenner, J.; Hickman, R.; Rand, D.; Wild, D. L.; Ott, S.; Buchanan-Wollaston, V.; Smirnoff, N.; Beynon, J.; Denby, K.; Grant, M. (2015) Transcriptional dynamics driving MAMP-triggered immunity and pathogen effector-mediated immunosuppression in Arabidopsis leaves following infection with Pseudomonas syringae pv tomato DC3000. Plant Cell 27, 3038-3064.
(8) Breeze, E.; Harrison, E.; McHattie, S.; Hughes, L.; Hickman, R.; Hill, C.; Kiddle, S.; Kim, Y.-s.; Penfold, C. A.; Jenkins, D.; Zhang, C.; Morris, K.; Jenner, C.; Jackson, S.; Thomas, B.; Tabrett, A.; Legaie, R.; Moore, J. D.; Wild, D. L.; Ott, S.; Rand, D.; Beynon, J.; Denby, K.; Mead, A.; Buchanan-Wollaston, V. (2011) High-resolution temporal profiling of transcripts during Arabidopsis leaf senescence reveals a distinct chronology of processes and regulation. Plant Cell 23, 873-894.
(9) Sharma, R.; De Vleesschauwer, D.; Sharma, M. K.; Ronald, P. C. (2013) Recent advances in dissecting stress-regulatory crosstalk in rice. Mol. Plant 6, 250-260.
(10) Windram, O.; Madhou, P.; McHattie, S.; Hill, C.; Hickman, R.; Cooke, E.; Jenkins, D. J.; Penfold, C. A.; Baxter, L.; Breeze, E.; Kiddle, S. J.; Rhodes, J.; Atwell, S.; Kliebenstein, D. J.; Kim, Y.-s.; Stegle, O.; Borgwardt, K.; Zhang, C.; Tabrett, A.; Legaie, R.; Moore, J.; Finkenstadt, B.; Wild, D. L.; Mead, A.; Rand, D.; Beynon, J.; Ott, S.; Buchanan-Wollaston, V.; Denby, K. J. (2012) Arabidopsis defense against Botrytis cinerea: chronology and regulation deciphered by high-resolution temporal transcriptomic analysis. Plant Cell 24, 3530-3557.
(11) Williamson, B.; Tudzynski, B.; Tudzynski, P.; Van Kan, J. A. L. (2007) Botrytis cinerea: the cause of grey mould disease. Mol. Plant Pathol. 8, 561-580.
(12) Jamir, Y.; Guo, M.; Oh, H.-S.; Petnicki-Ocwieja, T.; Chen, S.; Tang, X.; Dickman, M. B.; Collmer, A.; R. Alfano, J. (2004) Identification of Pseudomonas syringae type III effectors that can suppress programmed cell death in plants and yeast. Plant J. 37, 554-565.
(13) Weiberg, A.; Wang, M.; Lin, F.-M.; Zhao, H.; Zhang, Z.; Kaloshian, I.; Huang, H.-D.; Jin, H. (2013) Fungal small RNAs suppress plant immunity by hijacking host RNA interference pathways. Science 342, 118-123.
(14) Jones, J. D. G.; Dangl, J. L. (2006) The plant immune system. Nature 444, 323-329.
(15) Heidel, A. J.; Clarke, J. D.; Antonovics, J.; Dong, X. (2004) Fitness costs of mutations affecting the systemic acquired resistance pathway in Arabidopsis thaliana. Genetics 168, 2197-2206.
(16) Hespanha, J. P.; Naghshtabrizi, P.; Xu, Y. (2007) A survey of recent results in networked control systems. Proc. IEEE 95, 138-162.
(17) Liu, Y.-Y.; Slotine, J.-J.; Barabasi, A.-L. (2011) Controllability of complex networks.
Nature 473, 167-173.
directed human protein interaction network identifies disease genes and drug targets. Proc.
Natl. Acad. Sci. USA 113, 4976-4981.
(19) Ang, J.; Bagh, S.; Ingalls, B. P.; McMillen, D. R. (2010) Considerations for using integral feedback control to construct a perfectly adapting synthetic gene network. J. Theor. Biol. 266, 723-738.
(20) Briat, C.; Zechner, C.; Khammash, M. (2016) Design of a synthetic integral feedback circuit: dynamic analysis and DNA implementation. ACS Synth. Biol. 5, 1108-1116.
(21) Harris, A. W. K.; Dolan, J. A.; Kelly, C. L.; Anderson, J.; Papachristodoulou, A. (2015) Designing genetic feedback controllers. IEEE Trans. Biomed. Circuits Syst. 9, 475-484.
(22) Huynh-Thu, V. A.; Irrthum, A.; Wehenkel, L.; Geurts, P. (2010) Inferring regulatory networks from expression data using tree-based methods. PLoS ONE 5, e12776.
(23) Haury, A.-C.; Mordelet, F.; Vera-Licona, P.; Vert, J.-P. (2012) TIGRESS: trustful inference of gene regulation using stability selection. BMC Syst. Biol. 6.
(24) Bonneau, R.; Reiss, D. J.; Shannon, P.; Facciotti, M.; Hood, L.; Baliga, N. S.; Thorsson, V. (2006) The inferelator: an algorithm for learning parsimonious regulatory networks from systems-biology data sets de novo. Genome Biol. 7, R36.
(25) Schaffter, T.; Marbach, D.; Floreano, D. (2011) GeneNetWeaver: in silico benchmark generation and performance profiling of network inference methods. Bioinformatics 27, 2263-2270.
(26) Marbach, D.; Costello, J. C.; Kuffner, R.; Vega, N. M.; Prill, R. J.; Camacho, D. M.; Allison, K. R.; Kellis, M.; Collins, J. J.; Stolovitzky, G. (2012) Wisdom of crowds for robust gene network inference. Nat. Meth. 9, 796-804.
(27) Pruneda-Paz, J. L.; Breton, G.; Para, A.; Kay, S. A. (2009) A functional genomics approach reveals CHE as a component of the Arabidopsis circadian clock. Science 323, 1481-1485.
(28) Pré, M.; Atallah, M.; Champion, A.; De Vos, M.; Pieterse, C. M. J.; Memelink, J. (2008) The AP2/ERF domain transcription factor ORA59 integrates jasmonic acid and ethylene signals in plant defense. Plant Physiol. 147, 1347-1357.
(29) O’Malley, Ronan C.; Huang, S.-shan C.; Song, L.; Lewsey, Mathew G.; Bartlett, A.; Nery, Joseph R.; Galli, M.; Gallavotti, A.; Ecker, Joseph R. (2016) Cistrome and epicistrome features shape the regulatory DNA landscape. Cell 165, 1280-1292.
(30) Hickman, R.; van Verk, M. C.; Van Dijken, A. J. H.; Pereira Mendes, M.; Vroegop-Vos, I. A.; Caarls, L.; Steenbergen, M.; Van Der Nagel, I.; Wesselink, G. J.; Jironkin, A.; Talbot, A.; Rhodes, J.; de Vries, M.; Schuurink, R. C.; Denby, K.; Pieterse, C. M. J.; Van Wees, S. C. M. (2017) Architecture and dynamics of the jasmonic acid gene regulatory network. Plant Cell, Aug, 2017. DOI:10.1105/tpc.16.00958.
(32) di Bernardo, D.; Thompson, M. J.; Gardner, T. S.; Chobot, S. E.; Eastwood, E. L.; Wojtovich, A. P.; Elliott, S. J.; Schaus, S. E.; Collins, J. J. (2005) Chemogenomic profiling on a genome-wide scale using reverse-engineered gene networks. Nat. Biotech. 23, 377-383.
(33) Bansal, M.; Belcastro, V.; Ambesi‐Impiombato, A.; di Bernardo, D. (2007) How to infer gene networks from expression profiles. Mol. Syst. Biol. 3.
(34) Dalchau, N.; Baek, S. J.; Briggs, H. M.; Robertson, F. C.; Dodd, A. N.; Gardner, M. J.; Stancombe, M. A.; Haydon, M. J.; Stan, G.-B.; Gonçalves, J. M.; Webb, A. A. R. (2011) The circadian oscillator gene GIGANTEA mediates a long-term response of the Arabidopsis thaliana circadian clock to sucrose. Proc. Natl. Acad. Sci. USA 108, 5104-5109.
(35) Herrero, E.; Kolmos, E.; Bujdoso, N.; Yuan, Y.; Wang, M.; Berns, M. C.; Uhlworm, H.; Coupland, G.; Saini, R.; Jaskolski, M.; Webb, A.; Gonçalves, J.; Davis, S. J. (2012) EARLY FLOWERING4 recruitment of EARLY FLOWERING3 in the nucleus sustains the Arabidopsis
circadian clock. Plant Cell 24, 428-443.
(36) Kim, J.; Bates, D. G.; Postlethwaite, I.; Heslop-Harrison, P.; Cho, K.-H. (2007) Least-squares methods for identifying biochemical regulatory networks from noisy measurements.
BMC Bioinform. 8, 8.
(37) Kim, J.; Bates, D. G.; Postlethwaite, I.; Heslop-Harrison, P.; Cho, K.-H. (2008) Linear time-varying models can reveal non-linear interactions of biomolecular regulatory networks using multiple time-series data. Bioinformatics 24, 1286-1292.
(38) Wu, H.; Kerr, M.; Cui, X.; Churchill, G. (2003) MAANOVA: a software package for the analysis of spotted cDNA microarray experiments. The Analysis of Gene Expression Data, 313-341.
(39) Yang, Y. H.; Dudoit, S.; Luu, P.; Lin, D. M.; Peng, V.; Ngai, J.; Speed, T. P. (2002) Normalization for cDNA microarray data: a robust composite method addressing single and multiple slide systematic variation. Nucleic Acids Res. 30, e15.
(40) Narsai, R.; Howell, K. A.; Millar, A. H.; O'Toole, N.; Small, I.; Whelan, J. (2007) Genome-wide analysis of mRNA decay rates and their determinants in Arabidopsis thaliana.
Plant Cell 19, 3418-3436.
(41) Ang, J.; McMillen, David R. (2013) Physical constraints on biological integral control design for homeostasis and sensory adaptation. Biophys. J. 104, 505-515.
(42) Franklin, G. F.; Powell, J. D.; Emami-Naeini, A. (2015) Feedback control of dynamic systems. 7th ed.; Pearson.
(43) Milo, R.; Shen-Orr, S.; Itzkovitz, S.; Kashtan, N.; Chklovskii, D.; Alon, U. (2002) Network motifs: simple building blocks of complex networks. Science 298, 824-827.
(44) Alon, U. (2007) Network motifs: theory and experimental approaches. Nat. Rev. Genet. 8, 450-461.
(45) Ma, W.; Trusina, A.; El-Samad, H.; Lim, W. A.; Tang, C. (2009) Defining network topologies that can achieve biochemical adaptation. Cell 138, 760-773.
(47) Ogata, K. (2009) Modern control engineering. 5th ed.; Pearson.
(48) Krishnaswamy, S.; Verma, S.; Rahman, M. H.; Kav, N. N. V. (2011) Functional characterization of four APETALA2-family genes (RAP2.6, RAP2.6L, DREB19 and DREB26) in Arabidopsis. Plant Mol. Biol. 75, 107-127.
(49) Drengstig, T.; Ni, X. Y.; Thorsen, K.; Jolma, I. W.; Ruoff, P. (2012) Robust adaptation and homeostasis by autocatalysis. J. Phys. Chem. B 116, 5355-5363.
(50) Hickman, R.; Hill, C.; Penfold, C. A.; Breeze, E.; Bowden, L.; Moore, J. D.; Zhang, P.; Jackson, A.; Cooke, E.; Bewicke-Copley, F.; Mead, A.; Beynon, J.; Wild, D. L.; Denby, K. J.; Ott, S.; Buchanan-Wollaston, V. (2013) A local regulatory network around three NAC transcription factors in stress responses and senescence in Arabidopsis leaves. Plant J. 75, 26-39.
(51) Zarei, A.; Körbes, A. P.; Younessi, P.; Montiel, G.; Champion, A.; Memelink, J. (2011) Two GCC boxes and AP2/ERF-domain transcription factor ORA59 in jasmonate/ethylene-mediated activation of the PDF1.2 promoter in Arabidopsis. Plant Mol. Biol. 75, 321-331.
(52) Engler, C.; Gruetzner, R.; Kandzia, R.; Marillonnet, S. (2009) Golden gate shuffling: a one-pot DNA shuffling method based on type IIs restriction enzymes. PLoS ONE 4, e5553.
(53) Shiu, S.-H.; Shih, M.-C.; Li, W.-H. (2005) Transcription factor families have much higher expansion rates in plants than in animals. Plant Physiol. 139, 18-26.
(54) Gigolashvili, T.; Berger, B.; Mock, H.-P.; Müller, C.; Weisshaar, B.; Flügge, U.-I. (2007) The transcription factor HIG1/MYB51 regulates indolic glucosinolate biosynthesis in
Arabidopsis thaliana. Plant J. 50, 886-901.
(55) Tran, L.-S. P.; Nakashima, K.; Sakuma, Y.; Simpson, S. D.; Fujita, Y.; Maruyama, K.; Fujita, M.; Seki, M.; Shinozaki, K.; Yamaguchi-Shinozaki, K. (2004) Isolation and functional analysis of Arabidopsis stress-inducible NAC transcription factors that bind to a drought-responsive cis-element in the early responsive to dehydration stress 1 promoter. Plant Cell 16, 2481-2498.
(56) Alonso, J. M.; Stepanova, A. N.; Leisse, T. J.; Kim, C. J.; Chen, H.; Shinn, P.; Stevenson, D. K.; Zimmerman, J.; Barajas, P.; Cheuk, R.; Gadrinab, C.; Heller, C.; Jeske, A.; Koesema, E.; Meyers, C. C.; Parker, H.; Prednis, L.; Ansari, Y.; Choy, N.; Deen, H.; Geralt, M.; Hazari, N.; Hom, E.; Karnes, M.; Mulholland, C.; Ndubaku, R.; Schmidt, I.; Guzman, P.; Aguilar-Henonin, L.; Schmid, M.; Weigel, D.; Carter, D. E.; Marchand, T.; Risseeuw, E.; Brogden, D.; Zeko, A.; Crosby, W. L.; Berry, C. C.; Ecker, J. R. (2003) Genome-wide insertional mutagenesis of Arabidopsis thaliana. Science 301, 653-657.
(57) Karimi, M.; Inzé, D.; Depicker, A. (2002) GATEWAY™ vectors for Agrobacterium-mediated plant transformation. Trends Plant Sci. 7, 193-195.
(58) Denby, K. J.; Kumar, P.; Kliebenstein, D. J. (2004) Identification of Botrytis cinerea
susceptibility loci in Arabidopsis thaliana. Plant J. 38, 473-486.
(60) Guo, A.; He, K.; Liu, D.; Bai, S.; Gu, X.; Wei, L.; Luo, J. (2005) DATF: a database of Arabidopsis transcription factors. Bioinformatics 21, 2568-2569.
(61) Pruneda-Paz, Jose L.; Breton, G.; Nagel, Dawn H.; Kang, S. E.; Bonaldi, K.; Doherty, Colleen J.; Ravelo, S.; Galli, M.; Ecker, Joseph R.; Kay, Steve A. (2014) A genome-scale resource for the functional characterization of Arabidopsis transcription factors. Cell Rep. 8, 622-632.
(62) Vidyasagar, M. (1998) Statistical learning theory and randomized algorithms for control.
IEEE Control Syst. 18, 69-85.
(63) Menon, P. P.; Postlethwaite, I.; Bennani, S.; Marcos, A.; Bates, D. G. (2009) Robustness analysis of a reusable launch vehicle flight control law. Control Eng. Pract. 17, 751-765.
Figure 1. Expression and role of CHE during infection with B. cinerea. (a) Expression of the TF CHE is downregulated during B. cinerea infection of Arabidopsis leaves. Leaves were drop-inoculated with B. cinerea spores or mock-inoculated, and genome-wide gene expression determined every 2 hours for both mock treatment (blue) and B. cinerea infection (red). Open circles are the average of four biological repeats with bars representing standard deviation. This data is extracted from Windram et al.10. (b) CHE is a positive regulator of defence against B. cinerea. Lesion size of Arabidopsis leaves (n = 17) drop-inoculated with
B. cinerea spores were measured 36 and 72 hours post infection. che-1 is an Arabidopsis
mutant with significantly reduced CHE expression. WT is the wildtype Col-0 Arabidopsis accession. Error bars represent standard deviation, ** represents p ≤ 0.01 and *** represents p ≤ 0.001.
Figure 2. Network model of gene regulatory events mediating transcriptional response to
Botrytis cinerea. The nine-gene network (9GRN) is a sub-network of the initial network model inferred from time series transcriptome data. The direction of regulation is indicated by the arrow. Red stars represent unmodeled regulation (e.g. direct regulation from B. cinerea, noise and other unidentified regulation, see also Section S5 of the Supporting Information). The yellow circle represents circadian regulation. Green edges represent interactions that are supported by experimental data. The regulation types (arrow-head and bar-head) in 9GRN are identified through system identification.
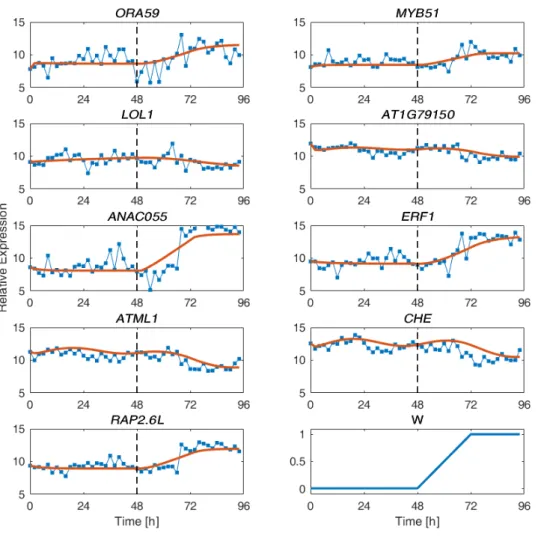
post-infection, with B. cinerea infection starting at time 48 hours. There are four sets of such joined time-series data; we used the average of the first three data sets for parameter estimation (see Figure S3), leaving the fourth data set for model validation shown above. We have also included the unmodeled regulation, W described by Equation S5.1. Line with dots: Experiment data, Solid line: Linear model.
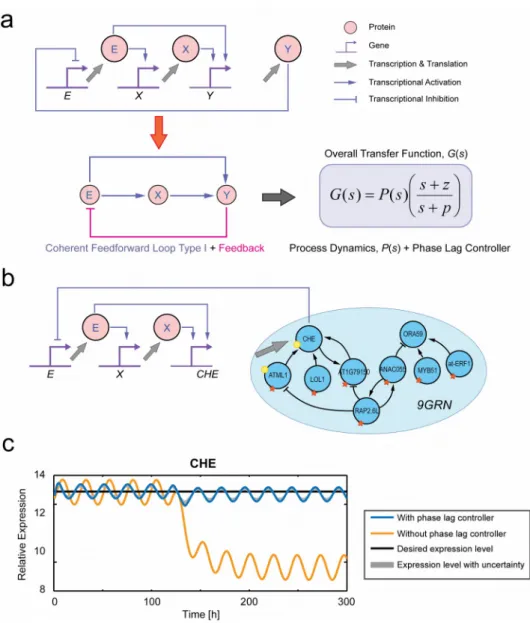
Figure 4. Perturbation mitigation using a genetic phase lag controller. (a) Genetic circuit of the proposed controller. X is the output of the controller, Y is the output of the process and E computes the error signal. This genetic circuit is equivalent to a coherent feedforward loop type-I with feedback network motif that yields the transfer function of a phase lag controller plus process dynamics. (b) Implementation of the phase lag controller motif for perturbation mitigation in the 9GRN. (c) Simulation results of phase lag controller in mitigating perturbation in the 9GRN. The solid black line is the desired average expression of CHE, the solid yellow line is the expression of CHE during infection with B. cinerea without any control action, and the solid blue lines represent gene expression during infection with B. cinerea
with control action. The gray shaded regions represent the expression level with uncertainty obtained through Monte Carlo simulation. In our simulations, the parameter values for the phase lag controller are αX,E = 3.00, αY,X = 5.00, αY,E = 5.00, βX = 0.026, while the parameter
values for the error computation are bS,E = 6.21 and γ = βE = 0.50. For more details on the
choice of these values, see Figures S6 to S8.
Figure 5. Simulation results for genes in the 9GRN with proposed network rewiring. Black line: reference value, Blue line: gene expression level in response to B. cinerea infection after rewiring. Yellow line: gene expression level in response to B. cinerea infection without network rewiring. Perturbation (inoculation) is given at time 120 hours. (a) Rewiring a controller by adding activation of CHE by MYB51 and ORA59 and inhibition of MYB51
Figure 1. Expression and role of CHE during infection with B. cinerea (a) Expression of the TF CHE is downregulated during B. cinerea infection of Arabidopsis leaves. Leaves were drop-inoculated with B. cinerea spores or mock-inoculated, and genome-wide gene expression determined every 2 hours for both mock treatment (blue) and B. cinerea infection (red). Open circles are the average of four biological repeats with bars representing standard deviation. This data is extracted from Windram et al.10 (b) CHE is a positive regulator of defence against B. cinerea. Lesion size of Arabidopsis leaves (n = 17) drop-inoculated with
mutant with significantly reduced CHE expression. WT is the wildtype Col-0 Arabidopsis accession. Error bars represent standard deviation, ** represents p ≤ 0.01 and *** represents p ≤ 0.001.
Figure 2. Network model of gene regulatory events mediating transcriptional response to
Figure 4. Perturbation mitigation using a genetic phase lag controller. (a) Genetic circuit of the proposed controller. X is the output of the controller, Y is the output of the process and E computes the error signal. This genetic circuit is equivalent to a coherent feedforward loop type-I with feedback network motif that yields the transfer function of a phase lag controller plus process dynamics. (b) Implementation of the phase lag controller motif for perturbation mitigation in the 9GRN. (c) Simulation results of phase lag controller in mitigating perturbation in the 9GRN. The solid black line is the desired average expression of CHE, the solid yellow line is the expression of CHE during infection with B. cinerea without any control action, and the solid blue lines represent gene expression during infection with B. cinerea
with control action. The gray shaded regions represent the expression level with uncertainty obtained through Monte Carlo simulation. In our simulations, the parameter values for the phase lag controller are αX,E = 3.00, αY,X = 5.00, αY,E = 5.00, βX = 0.026, while the parameter
values for the error computation are bS,E = 6.21 and γ = βE = 0.50. For more details on the
Figure 5. Simulation results for genes in the 9GRN with proposed network rewiring. Black line: reference value, Blue line: gene expression level in response to B. cinerea infection after rewiring. Yellow line: gene expression level in response to B. cinerea infection without network rewiring. Perturbation (inoculation) is given at time 120 hours. (a) Rewiring a controller by adding activation of CHE by MYB51 and ORA59 and inhibition of MYB51