IJEDR1404059
International Journal of Engineering Development and Research (www.ijedr.org)3742
Modelling and Simulation of Photovoltaic Array
Using Matlab/Simulink
Kamal Keshavani
1, Jigar Joshi
2, Vishrut Trivedi
3, Mitesh Bhavsar
4Students, L.D.R.P-ITR (Elect. Department), KH-5, Sector-15, Gandhinagar, India
________________________________________________________________________________________________________
Abstract - Photovoltaic power supplied to the utility grid is gaining more and more visibility while the world’s powers demand increases. In this paper we are defining a circuit-based simulation model for a PV cell in order to estimate the electrical behavior of the cell with respect to changes in environmental parameters such as temperature and irradiance. The PV system requires many special design considerations due to varying nature of the solar power generated resulting from unpredictable and sudden changes in weather conditions which change the solar irradiation level as well as the cell operating temperature of PV arrays. PV cell is the most basic element of photovoltaic generation units, which converts the solar energy into electrical energy. This paper focuses on a MATLAB/Simulink model of a photovoltaic cell. This model is based on mathematical equations and is described through an equivalent circuit including a photocurrent source, a diode and a series resistor. The developed model allows the prediction of PV cell behavior under different physical and environmental parameters. In addition, this paper outlines the working principle of PV module as well as PV array. So this completed model accepts irradiance and temperature as variable parameters and outputs the I-V as well as P-V characteristic. In order to validate the developed model, the simulation results are compared with the standard results and characteristic curves provided by the PV array manufacturer and they show excellent resemblance.
Key words - PV cell characteristics, modeling of PV module, validation.
________________________________________________________________________________________________________
I.INTRODUCTION
The development of new energy sources is continuously enhanced because of the critical situation of the chemical industrial fuels such as oil, gas and others. Thus, the renewable energy sources have become a more important contributor to the total energy consumed in the world. Among the renewable energy resources, the energy through the photovoltaic (PV) effect can be considered the most essential resource. In spite of the irregularity of sunlight, solar energy is widely available and completely free of cost.
The focus of this paper is on solar cell modeling. This paper carried out a MATLAB/Simulink model of PV cell behavior under different varying parameters such as solar radiation, ambient temperature, series resistor, shunt resistor, etc. Then the simulation results obtained are also compared with the standard results provided by the manufacturer. This model can be used to get characteristic curves of any type of PV array under different environmental conditions.
II.CHARACTERISTICS OF PVCELL
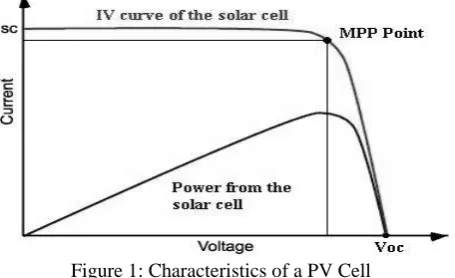
The electrical characteristic of the PV cell is generally represented by the current versus voltage (I-V) curve. Figure 1 shows the I-V characteristic of a PV module.
The top left of the I-V curve at zero voltage is called the short-circuit current. This current is measured with the output terminals shorted (zero voltage). The bottom right of the curve at zero current is called the open-circuit voltage. This voltage is measured with the output terminals open (zero current).
Figure 1: Characteristics of a PV Cell
IJEDR1404059
International Journal of Engineering Development and Research (www.ijedr.org)3743
III. MATHEMATICAL MODEL OF PVCELLThe equivalent electrical circuit shown in figure 2 can represent the complex physics of the PV cell.
Figure 2: Equivalent Electrical Circuit of a PV Cell The circuit parameters are as follows.
The output-terminal current I is equal to the light-generated current IL, less the diode-current Id and the shunt-leakage current Ish.
The series resistance Rs represents the internal resistance to the current flow, and depends on the p-n junction depth, the impurities and the contact resistance.
The shunt resistance Rsh is inversely related with leakage current to the ground.
In an ideal PV cell, Rs = 0 (no series loss), and Rsh = ∞ (no leakage to ground). In a typical high quality one square inch silicon cell, Rs = 0.05 to 0.10 ohm and Rsh = 200 to 300 ohms. The PV conversion efficiency is sensitive to small variations in Rs, but is insensitive to variations in Rsh. Therefore, we can ignore Rsh from the equivalent electrical circuit for our modelling.
In the equivalent circuit, the current delivered to the external load equals the current IL generated by the illumination, less the diode current Id.
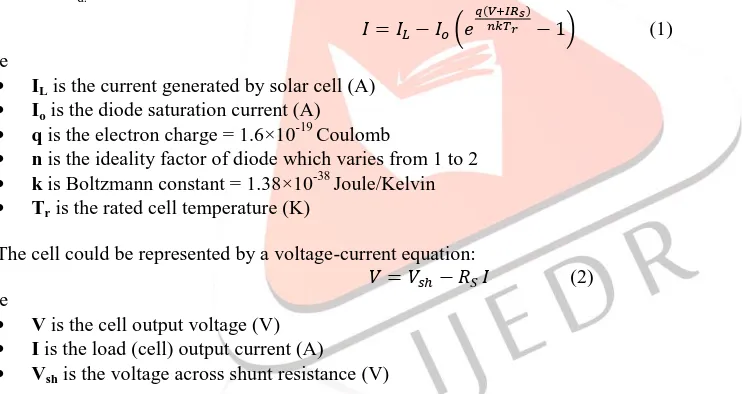
( ( ) ) (1) where
ILis the current generated by solar cell (A)
Io is the diode saturation current (A)
q is the electron charge = 1.6×10⁻¹⁹ Coulomb
n is the ideality factor of diode which varies from 1 to 2
k is Boltzmann constant = 1.38×10-38 Joule/Kelvin
Tr is the rated cell temperature (K)
The cell could be represented by a voltage-current equation:
(2) where
V is the cell output voltage (V)
I is the load (cell) output current (A)
Vsh is the voltage across shunt resistance (V)
IJEDR1404059
International Journal of Engineering Development and Research (www.ijedr.org)3744
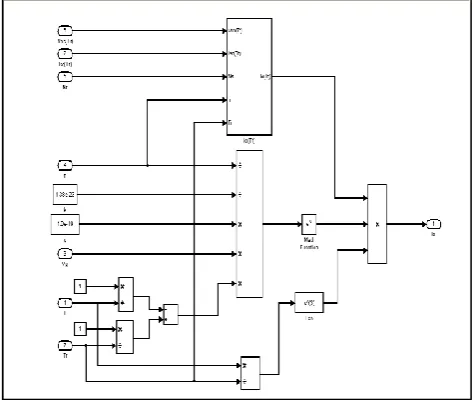
Figure 3: PV Cell MATLAB/Simulink ModelIV.EFFECT OF SOLAR RADIATION VARIATION
The model shown in fig. 3 consists of two subsystems, one of them is photocurrent. The photocurrent depends on the radiation and the temperature according to equation (3).
( )( ( )) (3)
Where
αIsc is the short circuit temperature coefficient (A/°C)
G is operating solar radiation level (W/m2)
Gris rated solar radiation level (W/m2)
Based on the equation (3), the subsystem of Fig. 4 is obtained.
Figure 4: Subsystem of Photocurrent V.EFFECT OF VARIATION IN CELL TEMPERATURE
The diode reverse saturation current IO in equation (1) varies as a cubic function of the temperature and it can be expressed as:
( ) ( )
( )(4)
( ) ( )
( ( ) )
IJEDR1404059
International Journal of Engineering Development and Research (www.ijedr.org)3745
Isc(Tr) is the short circuit current of the cell at rated temperature (A)
Vg is the band gap voltage (V)
Voc(Tr) is the open circuit voltage of the cell at rated temperature (V)
T is operating temperature of the cell(K)
The other subsystem of the model shown in fig. 3 is Diode current, which contains a subsystem of diode reverse saturation current as shown in fig. 5.
Figure 5: Subsystem of Reverse Saturation Current
VI.MATHEMATICAL MODEL OF PVARRAY
Since a typical PV cell produces less than 2W at 0.5V approximately, the cells must be connected in series-parallel configuration on a module to produce enough high power. A PV array is a group of several PV modules, which are electrically connected in series and parallel circuits to generate the required current and voltage. The equivalent circuit for the solar module arranged in NP parallel and NS series is shown in Fig. 6.
Figure 6: Equivalent Electrical Circuit of PV Array
Therefore, for the PV array, as shown in fig. 6, we can write output current equation as given below: (6)
Now for an array containing NS cells in series and such NP strings in parallel as shown in fig. 6, we can modify the diode current equations of the cell as presented below:
( ( ) ) (7)
( ) ( )
( ) (8)
( ) ( )
( ( ) )
(9)
VII. SIMULATION MODEL OF PVARRAY
IJEDR1404059
International Journal of Engineering Development and Research (www.ijedr.org)3746
A Solarex MSX PV type is chosen for PV array modelling. This type is well suited for virtually all applications where PV System are feasible energy source, including pumping and irrigation, aids to navigation. The MSX60 module has 60W of rated power and 36 series connected polycrystalline silicon cells. The performance of typical MSX60 module is described by the electrical characteristics parameters given in below table 1.The MATLAB/Simulink model is developed for a general PV array based on manufacturer data and from the mathematical equations, the output presents the PV array operating current.
After including all the equation explained above, we have a model that has a subsystem of PV array and inputs of environmental factors. Here, we have applied a ramp input for PV output voltage to produce the complete I-V and P-V graph.
Table 1: Key Specifications of the Solarex MSX60 PV Module
Description Value
Peak Power (W) 60
Open circuit-VOC (V) 21.10
Short-circuit current-ISC (A) 3.8
Reference Irradiance-Gr (W/m2) 1000
Reference Temperature-Tr (K) 298
Number of cell in series-NS 36
Number of cell in parallel-NP 1
Series resistance (Ω) 0.17
Ideality factor-n 1.35
Short circuit temperature coefficient-Kisc (A/K) 0.003
Bandgap Energy-Vg (eV) 1.1
Now we can get different output characteristics at different temperature and radiation levels by just changing the value of input parameters T and G.
Figure 7: Simulink model of PV array VIII. VALIDATION OF PROPOSED MODEL
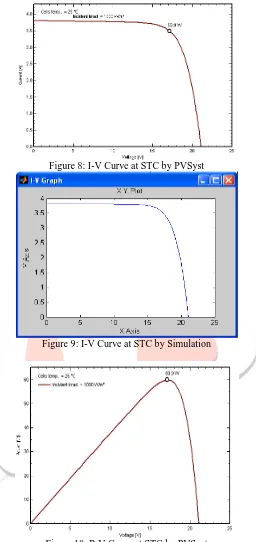
The proposed model can provide calculated current, voltage and power relationships for different environmental conditions of solar radiations and ambient temperatures. These I-V and P-V characteristics are produced by the proposed model for chosen PV array type through MATLAB/Simulink environment .The validation of results are done in three steps:
IJEDR1404059
International Journal of Engineering Development and Research (www.ijedr.org)3747
Figure 8: I-V Curve at STC by PVSystFigure 9: I-V Curve at STC by Simulation
IJEDR1404059
International Journal of Engineering Development and Research (www.ijedr.org)3748
Figure 11: P-V Curve at STC by Simulation Validation under different temperature levels - To assure the flexibility and accuracy of the developed Simulink model, the model is tested under different temperature levels. These I-V and P-V characteristics are developed at 1000W/m2 and 313 K from the manufacturer’s datasheet in PVSyst software and the proposed Simulink model.
Figure 12: I-V Curve at 313K by PVSyst
IJEDR1404059
International Journal of Engineering Development and Research (www.ijedr.org)3749
Figure 14: P-V Curve at 313K by PVSystFigure 15: P-V Curve at 313K by Simulation
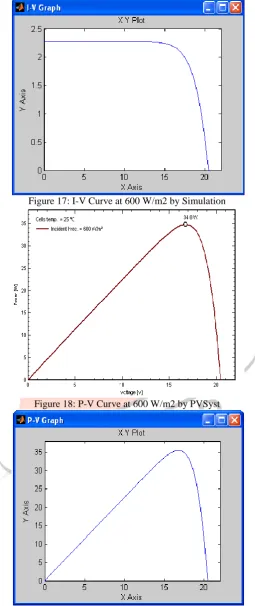
Validation under different solar radiation levels - To further show capability of developed Simulink model to operate, not only at different temperatures, but also for different solar radiation levels, the model is simulated under different radiation level and results are compared to assure the accuracy. The simulations results using the developed Simulink model for radiation level 600 W/m2 are compared with PVSyst results.
IJEDR1404059
International Journal of Engineering Development and Research (www.ijedr.org)3750
Figure 17: I-V Curve at 600 W/m2 by SimulationFigure 18: P-V Curve at 600 W/m2 by PVSyst
Figure 19: P-V Curve at 600 W/m2 by Simulation
IX.CONCLUSION
IJEDR1404059
International Journal of Engineering Development and Research (www.ijedr.org)3751
REFERENCES
[1] Didier Thevenard (2005), “Review and Recommendations for Improving the Modelling of Building Integrated Photovoltaic Systems”, Ninth International IBPSA Conference, Montréal, Canada.
[2] Govinda R. Timilsina, Lado Kurdgelashvili and Patrick A. Narbel, “A Review of Solar Energy Markets, Economics and Policies”
[3] J. Surya Kumari and Ch. Sai Babu (2012), “Mathematical Modeling and Simulation of Photovoltaic Cell using Matlab-Simulink Environment”, International Journal of Electrical and Computer Engineering (IJECE), Vol. 2, No. 1, pp. 26~34 [4] M. R. Patel (1999), “Wind ans Solar Power Systems”, CRC Press
[5] Magdi M. El-Saadawi, Ahmed E. Hassan, Khaled M. Abo-Al-Ez and Mahmoud S. Kandil (2011), “A Proposed framework for dynamic modelling of photovoltaic systems for DG applications”, International Journal of Ambient Energy.
[6] Renée M. Nault, “Basic Research needs for Solar Energy Utilization”, Argonne National Laboratory. [7] Solarex datasheet, available from: http://www.solarex.com
[8] S. Rustemli and F. Dincer, “Modeling of Photovoltaic Panel and Examining Effects of Temperature in Matlab/Simulink” [9] Tarak Salmi, Mounir Bouzguenda, Adel Gastli and Ahmed Masmoudi, “MATLAB/Simulink Based Modelling of Solar