Business Intelligence for Social Networks
Using Data Mining Techniques
P.Lissy, P.Sudha
M.Phil Research Scholar, Department of Computer Science, Sree Saraswathi Thyagaraja College,
Pollachi, Tamil Nadu, India
Assistant Professor, PG Department of Computer Applications, Sree Saraswathi Thyagaraja College,
Pollachi, Tamil Nadu, India
ABSTRACT: In the modern world people are changing to all day to life events in modernization. In particularly people are mostly communication and relationship build for online forum for expressing opinions through, like face book, Twitter, Google++, Linked In. Data mining is applied various platforms. One of the major trends data mining is applied business intelligence for social networks. This study provides to business intelligence interaction through online product to buying customer satisfaction interaction. A social network is the main role for sharing review the information for customer satisfaction, opinion, expectation and quality analysis commands sharing to business
organization. Further this works analysis with various performance measures to different data mining techniques is
used to gain business intelligence for automatics finding hidden relationship and predicting future events from vast amounts of data in business attributes. This knowledge helps in gather complete advantages of better customer’s relationships, and even electronic business. And also improves to customer reviews, loyalty, and complaint.
KEYWORDS
:
Business Intelligence, Social Networks, Classification, Expectation Maximization, K Means, Apriori Algorithm.I.INTRODUCTION
Data mining is the process of examine data from various view and summarizing into useful info. This information allows to user from different viewpoints in attributes, categorizes, summarizes and angles to identify relationship [1]. Data Mining is the non-trivial process of identifying valid, novel and useful information patterns in data. Data mining is also known as knowledge discovery in data base process (KDD).And is merging ideas of statistics, machine learning, database and parallel computing. In the digital world data mining is apply various platform.
Social networks are providing in accessible platform for user to share information about all sectors in society as the result to use huge amount of social data. Mining social media has done the data extract actionable patterns, to behave E business organization. Different data mining techniques and software tools used to achieve business intelligence are automated finding hidden relations, and predicting future events from vast amounts of data in business attributes. This knowledge helps in gather complete advantages of better customer’s relationships, and even electronic business. And also improves to customer reviews, loyalty, and complaint. Social media direct customer interaction is effective and inexpensive and effectively. Different mining tools and techniques can be used to achieve better decision making in the field of Electronic Business Intelligence. But this research work suggests the online business intelligence for social network interaction between customers to business organization. Data collected in social networks for business related data or dimension.
Different data mining techniques and tools are applying and preprocess through trained data [2]. The classification, clustering algorithm will applied to generate different classes and group of customer. Association is help us to business organizations find patterns in better decision making and improve customer satisfaction and relationships
such as social media. Many companies are performing new kinds of analytics, such as sentiment analysis to better and
more quickly understand and respond to what customers are saying about them and their products in online marketing.
The data mining technologies processes through a finding hidden information for electronic business in social
networks. The data mining techniques successful with advanced analyticsin predictive and descriptive. This technique
analytics compete in the marketing for social networks buying customer infrastructure attributes in data, tools, technology, people, processes, etc. This is the most interesting target. It occurs online marketing company either sees an opportunity or faces a problem that requires a new business update for social networks. So we need to best analytical tool. It should also explore, preparing, and combining data is required prior to running a predictive analytics algorithm and the tools should support customer credit [11].
A. THE AIM OF THIS STUDY IS COVERED:
1) Overview of existing techniques can be used for extracting of useful information from databases. 2) A feature data mining technique identifies important prospect to study knowledge discovery.
3) Enquire existing information discovery and data mining software tools using the proposed characteristics classification, clustering and associations strategy.
II.RELATED WORK
In [4] this author discusses business intelligence in advance exploiting an adaptive approach. And also show the idea of business strategy once new negotiation model rise in the e-market. It is used open source software and that apply a fully distributed open environs for business intelligence for social media. The author [5] have studied early business in social media comprises in retail and finance. Also they have discusses retail companies use social media to rule their brand awareness, product/customer service development, publicizing/marketing import, network structure analysis, news propagation and even fraud detection. In finance, social media is used for measuring market sentiment and news data is used for trading, measured sentiment of random sample of Twitter data. This author [6] explained business intelligence infrastructures and should be decided the decision-making processes for executed in real time. And also show the flexibility rate at which the business can grow. Businesses grow but the key drivers can remain the same. It analyzes the elements required for an optimal deployment of smart decision architectures. In [8] the author says a Face book is a primary data source and consideration to use different data mining techniques, and analyze to social networking site and K-nearest neighbor (K-NN).In [7] the author has studied the issues related to analysis of social networks using web based problems and use data mining techniques. Apart from this the application of web mining methods and a general operation for social networks analysis, finding communities and in social networks and analyzing Systematical data mining approach to mine intellectual knowledge from social overlapping patterns communities .The author [10] has studied data mining tool predict in future behaviours, and also explained in organization to make a knowledge driven decision, helping for data mining. In [9] the author explained data mining techniques in knowledge discovery in data base. And also defined how to data extraction associated with in database. In [3] this author has studied the business model innovation focusing in company to customer relationship. And also an analysis to enterprise related operates in largest industry .This author explained in association techniques. Also discussed about association is a pattern discovered based relationship of a particular item on other items in the same transaction [12]. Generally association rule is working on the large amount of data. For example, the association technique is used in market basket analysis to identify what products that customers frequently purchase together. Based on this information businesses have comparable marketing campaign to sell more products to make more.
III. EXISTING SYSTEM
The existing system focused on applications of data mining in business intelligence for social media. Business
organization is analysis of customer behavior, opinion, complaint and loyalty using classification.
Existing studies have applied text mining to various purposes of customer complaint management classify large volumes of inbound emails to distinguish complaints from non-complaints through emails, discussion forums, and customer review for useful knowledge to generated texts, extract business intelligence, and support decision making to all products.
Data mining techniques have been used on traditional data customer’s regression analysis, Naïve Bayes (NB), and
Decision tree.
IV.PROPOSED SYSTEM
Focused dynamic data sets and improve new algorithms and technologies to handle this vast data. It involves preprocessing, classifying, clustering, associative, attribute selection and finally visualization. In classification techniques applying Zero R methods for classifying business parameters such as buying, maintains, persons, delivery, safety and lug boot. In clustering algorithms applying Expectation Maximization (EM) and K-means clustering to group the overall business attributes like online purchasing products in social media, and these values finalize don centroid. Association algorithm is used to analyzing data for frequent if/then patterns and using the criteria support and confidence to identify the most important relationships in attributes. Finally the results show over all achieve better decision making in online business organization to improve customer satisfaction view point like effective and quality
A. ADVANTAGES:
The most popular approach is Business Intelligence System.
Discuss and implementation of business Intelligence using theoretic, method, model, and tools to give a
solution for decision making support.
Business intelligence in advance exploiting an adaptive approach. The idea is to learn business strategy once
new negotiation model rise in the e-market in social networks.
Focusing particularly on the relationship between a company and customers.
B. STEPS INVOLVED IN PROPOSED SYSTEM:
Following steps shows preprocess between the classification, clustering and Associate to attribute data set for online business.
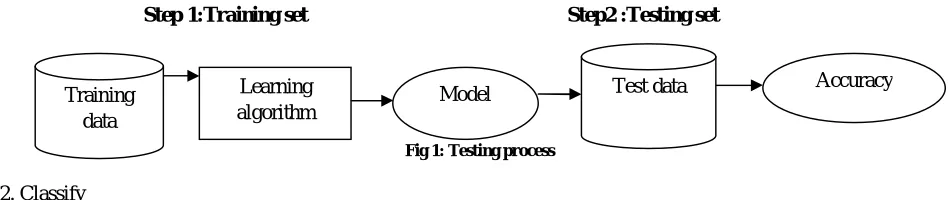
1. Preprocess
Importing data from a database for comma-separated values file.
After preprocessing this data using filtering algorithm and used to transform the data for training and testing on the
same data set.
Weka to hold data set use it instead as a test set. To save part of the data set for testing run the Classifier
Step 1:Training set Step2 :Testing set
Fig 1: Testing process
2. Classify
To apply the classification algorithms for resulting dataset and to visualize import attributes. Training
data
Learning
algorithm Model
3. Cluster
To apply clustering techniques.
Implementation mixture of simple k-means algorithm and expectation maximization for normal distributions.
4. Associate
To association rule learners that attempt to identify all important interrelationships between attributes in the
data. 5. Select attributes
This algorithm identifying the most predictive attributes in a dataset.
6. Visualize
To visualization from the Classifier, Cluster and Associate Attribute Selection.
V.ALGORITHM IMPLEMENTATION
Social media profiles will be collected and available number of dimensions or characteristics. After preprocessing training data will be applied to various classes or groups of customers. A comparative study of classification, clustering and association algorithms will be observed based on datasets using weka software will be tested for its accuracy. This is help us to business administration find useful patterns in better decision making and better customer satisfaction and relationships. However sampling was done during the TVS motor Vehicle data set collect social networks likes.
1. Business data-(business data.cvs->”test”.arff). 2. All preprocessing has been performed on CVS.
3. To take 518 attributes instance described 6 attributes names. This index classified as attributes following classes Buying, Maintained, Doors (Delivery), Persons, Laugboots (machinery parts) Safety.
4. Loading the file and analyzing the data
A. PREPROCESS FOR CLASSIFICATION: ZERO R
To process of this rules in follow steps
Step 1: Click the Explorer button to Weka Explorer.
Step 2: Click the Open file button to open a data set and double click on the data directory. And Select the test.arff file to load the dataset.
Click the Classify tab. To select Zero R algorithm is selected by default. Step 4: Result is displayed.
B. PREPROCESS FOR CLUSTERING:
A. Expectation Maximization (EM)
Expectation Maximization is grouped the overall attributes. Then, K-means Algorithm is grouped the attributes based on centroid. There are two steps in this EM Algorithm process:
1. The EM iteration alternates between performing an Expectation (E) step.
2. A maximization (M) step, which computes parameters maximizing the expected log likelihood found on
the E step.
There are two step mainly involved in EM Algorithm process:
Step 1:
Expectation iteration creates a function for the log-likelihood evaluated using the current estimate for the parameters. Then, calculate the expected value of the log likelihood function.
Q ( Ө | Ө (t) ) = E z | x ,Ө (t) [Log L 9 (Ө; X , Z ) ]
Here, Z = Sequence of values or Sum Log L = Log likelihood
Ө = Unknown Parameters
X = Observed Data (Ө (t))
Step 2:
Maximization is computes parameters maximizing, the expected log-likelihood found on the E-step. These parameters estimate to determine the distribution of the latent variables in the next E step. Find the parameters that maximize this quantity:
Ө(t + 1) = arg max Q ( Ө | Ө (t) )
By applying these two steps for finding maximization values of business attributes like overall attribute finding results decision making results
Step 1: The number of clusters is set to 1.
Step 2:The training set is split randomly into 10 folds.
Step 3: EM is performed 10 times using the 10 folds. Step 4: The log likelihood is averaged over all 10 results.
Step 5: If log likelihood has increased the number of clusters is increased by 1 and the program continues at step 2.
B.K Means
Simple K-means and Expectation Maximization clustering based concept of predicting business intelligence conditions. It’s used to find business data conditions like best result give a purchasing through online product very good, good, and medium and low. After applying Expectation Maximization is grouped the overall attributes. Then, K-means Algorithm is grouped the attributes based on centroid. Online purchasing is one of the most scientifically and technologically challenging problems around the world. Predicting the online purchasing is essential to help preparing for the accuracy and unaccuracy. By applying these techniques produced accurate result compare than existing system and improve the business product through online business to make efficiency. To analyzed the customer view and opinion finding in accuracy. The simple k-means algorithm is also implementation of the expectation maximization (EM) algorithm for learning a mixture of distributions. To perform clustering algorithm
Step 1: Initialization step: initialize K centroids Do
Assignment step: assign each data point to its centroid Re-estimation step: Re compute cendroid (cluster centers) While (there are still changes in the cendroid)
Step 2:
For each data point calculate the Euclidean distance from the data point to each cluster. The Euclidean distance is the straight-line distance between two pixels,
=√ ( 1− 2) 2 + ( 1− 2)2
Where ( 1, 1) & ( 2, 2)) are two data points. Step 3:
Repeat the above step until a complete pass through all the data points moving from one cluster to another and the clustering process ends.
Step 4:
Repeat this converged and square error criterion for clustering, in terms of inter-cluster and intra-cluster distances and cohesion. The process of result will be displayed
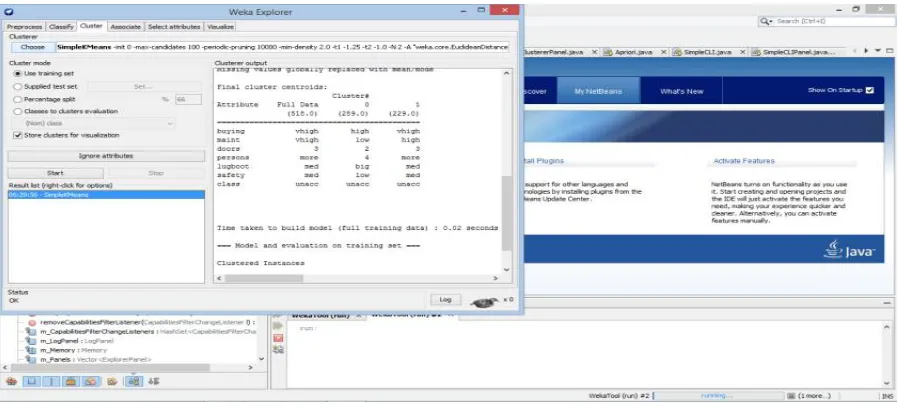
Step 1: Select the "Cluster" tab in the Explorer. Step 2: Click on the “Choose” Button.
Step 3: Select drop down list of available clustering algorithms, and select "Simple K means”.
Step 4: Next, click on the text box to the right of the "Choose" button to get the pop-up window clustering parameter.
Fig 3: Process of Simple k means
C. Process of Association: A.Apriori Algorithm
The dataset has been created in the file form of ARFF and examine using the Apriori algorithm in WEKA software tool. Association rules are if/then statements and help to uncover relationships between unmistakable unrelated data in a relational database.
Step 1: Open the Explorer application of the WEKA tool. Step 2: Choose preprocess tab.
Step 3: Now click on open file button to choose test.arff file which have to be implemented. Step 4: After open the Associate tab of the Explorer window.
Step 5: Click on the choose button to select the algorithm to implement Apriori Algorithm.
VI. RESULT ANALYSIS
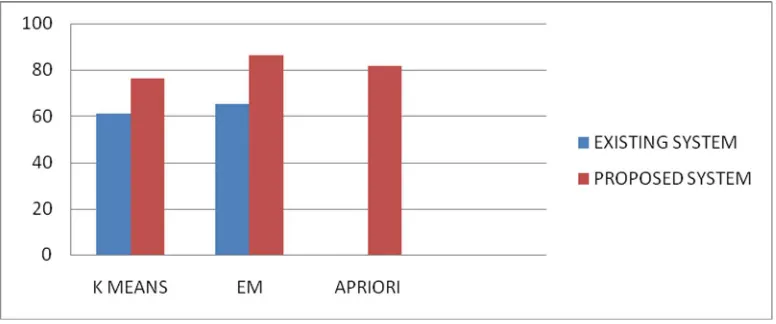
The following table is view both comparisons of existing and proposed system using data mining techniques. This result produced K means algorithm using proposed 89.23%, and Expectation maximization give a overall result in 86.32 and Apriori Produced 81.32% result on exist to proposed (Table 1).
Algorithm Existing System Proposed System
K-Means 70.00% 89.23%
EM 0% 86.32%
Apriori 69.94% 81.66%
Table 1: Comparison Table for Existing to Proposed System Using DM Techniques
The Following graph explains the analysis of existing and proposed system result analysis for using Data mining techniques (Figure 4).
VII.CONCLUSION AND FUTURE ENHANCEMENT
In this research work based business intelligence for social networks. They have various data mining techniques using classification, clustering and association. By applied Weka tool with Zero R for classifying business product purchasing online and Expectation Maximization algorithm for finding Maximum values of given business attribute. After clustering techniques applied and using k-mean clustering algorithm, for finding maximum and minimum customer or buyer details on the dataset social media, using association (Apriori) algorithms for to find out relationship between attributes. Scatter plot matrix is used to display the overall result like Buying, Maintained, Doors, Safety, Lug boots and Person details. In this proposed system very useful to us and its accuracy is good compare than existing system.
facts analysis and comparative study of classification with clustering algorithms will be observed based on datasets using R software. This tool will be tested for its accuracy. These results give a business organization to make find useful patterns to better decision making and improve customer satisfaction and relationships.
REFERENCES
1. Agarwal.R , Imielinski.T and Swami. “A Mining association between set of item in massive data base”. 2.Arun k pujari, “data mining techniques”, Nancy universities press, 2001.
3. Aciar, S. 2009. “Adaptive business intelligence for an open negotiation environment Digital Ecosystems and Technologies”, 2009. DEST '09. 3rd IEEE International Conference on Digital Object Identifier. Page(s): 517 – 522 IEEE Conferences.
4. Bollen J, Mao H, Zeng X (2011) “Twitter mood predicts the stock market”. 2(3):1-8.
5. Kalyani M Raval,”Data Mining Techniques” ISSN: 2277 128X, Ijarcsse, Volume 2, Issue 10, October 2012.
6. Larose, D. T., “Discovering Knowledge in Data: An Introduction to Data Mining”, ISBN 0-471-66657-2, ohn Wiley & Sons, Inc, 2005.
7. Morris, Langdon. 2009. “Business Model Innovation the Strategy of Business Breakthroughs”. International Journal of Innovation Science. Vol. 1 Issue 4. p191-204.14p.
8. Neelamadhab Padhy, Dr. ragnyaban Mishra and Rasmita Panigrahi, “The Survey of Data Mining Applications And Feature Scope”, International Journal of Computer Science, Engineering and Information Technology (IJCSEIT), Vol.2, No.3, June 2012.
9. Raju, E., &Sravanthi, K, “Analysis of Social Networks Using the Techniques of Web Mining”, International Journal, 2012. 10. Rahman, M. M, “Mining Social Data to Extract Intellectual Knowledge”, arXiv preprint/ arXiv:1209.5345, 2012. 11.Wikipedia.