ABSTRACT
ZHANG, YUAN. Every Moment Counts: Deep Variability Reasoning in EHR Data. (Under the direction of Min Chi).
Large-scale and systematic patient information documentation enables understating the medi-cal history of patients, identifying interesting cohorts, predicting risks and evaluating interventions.
Electronic Health Records (EHRs), one success of such effort, facilitate a systematic collection
of temporal patient data and have provided unprecedented opportunities for exploratory anal-ysis. However, such data collection also poses numerous challenges for traditional data-driven
approaches due to the involved complex variabilities. In real-world EHR datasets, these variabilities
mainly include unreliable ground-truth, irregular time series, heterogeneous patient groups, and highly frequent missing values.
Deep reasoning beyond these variabilities is the key to understand, study and improve the
outcomes of a disease, and hence serves a better medical care delivery to public health. In this dissertation, we design a general framework to address the variabilities in multi-variate EHR data,
which consequently assists a better clinical decision making. In particular, we apply the framework
to predict septic shock, which is a life-threatening organ dysfunction and has an extremely high mortality rate.
Deep learning techniques have shown tremendous success for a wide scope of real-world tasks.
In this work, we adopt a recurrent neural network (RNN) model, which is a widely used sequential deep learning model, to capture long-term temporal dependencies and underlying progressing
patterns in septic shock. Our proposed framework is comprised of four thrusts described as follows:
Thrust 1: Multi-scale label learning.The learning performance of the conventional RNN model can be degraded given the difficulty in collecting reliable ground-truth labels in health-care domains.
To this end, we design a learning process by jointly leveraging the imperfect labels from different
resources (ICD-9 codes vs. clinical criteria) and at different scales (visit vs. event) to improve the prediction accuracy.
Thrust 2: Time-aware attention networks.In practice, clinicians refer to the records of several previous events to diagnose the medical condition of a patient. In some cases, the disease progression at a certain event may not rely on most recent events, but are more relevant to other events at
earlier time steps. On the other hand, the time interval between two consecutive events is irregular, which impacts the dependency between consecutive events. To mimic the process of doctors
reading records, we integrate attention mechanism with consideration of time irregularity to the
conventional RNN model, to interpret the prediction results and identify the contributions of the historical events to the current event.
groups (domains), i.e. race, age and gender. This leads to discriminative distributions in the nature
of EHR data. The learning model for one specific domain cannot directly apply to another domain. Hence, we utilize domain adaptation techniques to learn the correspondence among different
patient groups. We propose a domain adaptation (DA) method, combining two temporal
RNN-based recurrent components, to extract an invariant feature representation across different patient groups (domains) through an adversarial learning process. While learning the temporal developing
patterns of the disease, the method also identifies the temporal changes of feature distributions
across patient groups. Consequently, we aim to provide a more specific diagnosis.
Thrust 4: Variational RNN for missing data generation.Highly frequent missing values in EHR data can impact the decision-making process, which cannot be handled by most existing machine
learning approaches. We propose to impute missing values using a temporal generative model (Vari-ational Recurrent Neural Networks, VRNN). The generation of missing data enables the modeling of
a complete disease progression, which consequently contributes to a better classification.
In this dissertation, we first validate each thrust separately and then evaluate the whole
work using a real-world EHR dataset on septic shock. Results demonstrate that the proposed
frame-work achieved great success for identifying high-risk patients at an early stage. Through the deep reasoning in the variabilities of EHR data, the framework learns a more reasonable, realistic and
informative representation of patients’ health status, and hence sheds some lights on better
© Copyright 2019 by Yuan Zhang
Every Moment Counts: Deep Variability Reasoning in EHR Data
by Yuan Zhang
A dissertation submitted to the Graduate Faculty of North Carolina State University
in partial fulfillment of the requirements for the Degree of
Doctor of Philosophy
Computer Science
Raleigh, North Carolina
2019
APPROVED BY:
Xipeng Shen Ranga Raju Vatsavai
Julie Ivy Min Chi
DEDICATION
BIOGRAPHY
Yuan Zhang was born in Jinan, China. She obtained her bachelor’s degree from Beijing University of Technology. She studied Law during her first college year and then transferred to the Department
of Electronic Engineering. In the 4th year, she was awarded Outstanding Graduate and was
rec-ommended for graduate admission to Beijing University of Technology. In 2013, she obtained her master’s degree in Electronic Engineering. During the period she was pursuing her master’s degree,
she worked as a research assistant in Digital Multimedia Information Processing and Communica-tion Technology Laboratory (MIP&CT) and had been working on video-based automatic detecCommunica-tion
and prediction of the real-time traffic states. She developed her interests in challenging problems of
algorithms, machine learning, data analysis, computer vision, etc.
After graduating from Beijing University of Technology, Yuan joined a start-up game company
and contributed to developing the first 3D First Person Shoot web-page game in China. She made
great progress in programming, system design and team communication. In 2014, she started pursuing her Ph.D. degree in Computer Science at North Carolina State University. She obtained a
4.0 cumulative GPA in her academic records and has been working as a research assistant under
Dr. Min Chi at the Center for Educational Informatics (CEI). Most of Yuan’s work was devoted to the fields of education and healthcare. The first project she was involved is Automatic Short
Answer Grading (ASAG). Yuan applied natural language processing techniques to assess short
student-authored answers and explored incorporating additional relevant information to improve the performance of conventional ASAG methods. Second, Yuan has also actively participated in
an interdisciplinary research project, Sepsis Early Prediction Support Implementation System
(S.E.P.S.I.S). She collaborated with students and faculties from Industrial Engineering, and clinicians and statisticians from Mayo Hospital and Christian Care Health System. By researching on specific
challenges associated with EHR data and septic shock, she developed a deep neural network-based
framework to provide realistic and reasonable prediction for the task.
Besides her academic life in school, Yuan has gained industrial experience from several
in-ternships, including eBay, Mayo Clinic and Apple, which gave her great opportunities to apply the
ACKNOWLEDGEMENTS
I would like to sincerely thank my academic advisor, Dr. Min Chi, for her support, patience, and encouragement over the past four years. Her extensive knowledge and insightful advice have
sub-stantially broadened my views to the domains of education and healthcare. I am always inspired
by her enthusiasm, perseverance and conscientiousness for research. Interactions with her were highly motivating and confidence boosting, especially during tough phases of my research. Besides,
she is kind, caring and sweet, she is someone I will instantly love and forever be thankful to. I would like to thank Dr. Xipeng Shen, Dr. Raju Vatsavai and Dr. Julie Ivy for kindly serving on
my thesis committee. They provided instrumental suggestions regarding research organization,
experimental design, statistical analysis and system implementation, which enable me to thoroughly investigate on my work and get further improvement.
I would like to thank all the faculties, Dr. Julie Ivy, Dr. Maria Mayorg, Dr. Min Chi and Dr. Osman
Ozaltin, and the students from the Department of Industrial Engineering, Joseph Agor, Kendall McKenzie, and Nisha Nataraj, etc, involved in S.E.P.S.I.S project. Their hard work and excellent
management keep our project proceeding smoothly and being productive. I would like to thank our
collaborators, Dr. Muge Capan, Dr. Jeanne Huddleston, Dr. Santiago Romero Brufau and Dr. Ryan Arnold. They provided us with clinical insights and invaluable feedback whenever we encountered
challenges and confusions from the data and from medical science.
I would like to thank my great lab mates as well as dearest friends Chen Lin, Xi Yang, Song Ju, Guojing Zhou, Yeojim Kim, and Farzaneh Khoshnevisan in CEI. It has been fortunate to work with
them and I was always motivated from our discussions. I very much appreciate their kindnesses,
support and encouragement for my personal life. I would like to thank my friends Jiyu Wang, Shuchi Liu, Yang Lei, Chi Zhang, Xinyu Liang, who have made my graduate life full of excitement and fun.
We spent countless wonderful time together in Raleigh and I am always grateful for their friendship
and support.
I would like to thank my parents and parents-in-law for their constant understanding and
uncon-ditional love. My husband, Xiaowei Jia, receive my deepest gratitude and love for his dedication to
my work and life. He prepared me for major courses of computer science. He imparted rudimentary machine learning knowledge to me when I was a beginner. He set a good example for me by his
passionate and serious attitude for research. He always enlightened and encouraged me whenever I was depressed or stressful. He is a good husband, as well as a good friend and teacher. Finally, I
sincerely thank my dearest unborn son, Sinuo, who has brought enormous amount of motivation
TABLE OF CONTENTS
LIST OF TABLES . . . .viii
LIST OF FIGURES. . . ix
Chapter 1 INTRODUCTION . . . 1
1.1 Research Overview . . . 1
1.2 Thesis Statement And Hypotheses . . . 3
1.3 Contribution . . . 6
1.4 Organization . . . 6
Chapter 2 Background . . . 7
2.1 Machine Learning for EHR . . . 7
2.2 Recurrent Neural Networks . . . 9
2.3 Sepsis/Septic Shock Prediction . . . 10
Chapter 3 DATASETS . . . 13
3.1 Data Description . . . 13
3.2 Data Preprocessing . . . 14
3.2.1 Tagging . . . 15
3.2.2 Sampling . . . 17
3.2.3 Data Selection . . . 18
3.2.4 Feature Extraction . . . 19
3.2.5 Data Aggregation . . . 19
3.3 Data Split . . . 20
Chapter 4 Thrust 1: Learning from Multi-scale Labels . . . 22
4.1 Overview . . . 22
4.2 Related Work . . . 24
4.3 Method . . . 25
4.3.1 Problem Definition . . . 25
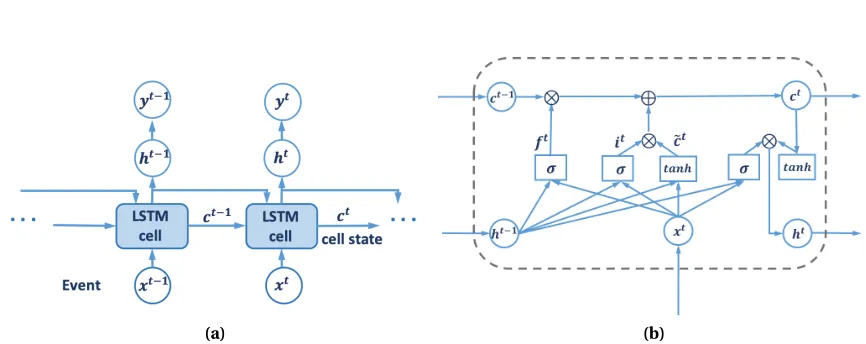
4.3.2 LSTM for Sequential Classification . . . 25
4.3.3 Learning from Multi-scale Labels . . . 27
4.4 Experiments . . . 28
4.4.1 Approaches . . . 28
4.4.2 Experimental Setup . . . 29
4.4.3 Evaluation and Setting . . . 30
4.5 Results . . . 30
4.5.1 Overall Validation of Multi-scale Label Learning . . . 30
4.5.2 Validation on various machine learning classifiers . . . 32
4.5.3 Validation Using Different Ground-truth Labels . . . 32
4.5.4 Early Prediction . . . 34
Chapter 5 Thrust 2: Time-aware Attention Networks. . . 36
5.1 Overview . . . 36
5.2 Related Work . . . 37
5.3 Method . . . 38
5.3.1 Three Attention Mechanisms. . . 39
5.3.2 Time-aware Decay Function . . . 40
5.4 Experiments . . . 41
5.4.1 Approaches . . . 41
5.4.2 Experimental Setup . . . 42
5.5 Results . . . 42
5.5.1 Results of Overall Prediction . . . 42
5.5.2 Results of Early Prediction . . . 44
5.5.3 Case Study . . . 45
5.6 Summary . . . 46
Chapter 6 Thrust 3: Deep Domain Adaptation. . . 47
6.1 Overview . . . 47
6.2 Related Work . . . 48
6.3 Method . . . 49
6.3.1 Domain Adaptation with Adversarial Learning . . . 49
6.3.2 Temporal Adversarial Networks . . . 51
6.4 Experiments . . . 53
6.4.1 Data Grouping . . . 53
6.4.2 Approaches . . . 54
6.4.3 Experimental Setup . . . 55
6.5 Results . . . 56
6.5.1 Domain Adaptation Using Single-factor . . . 56
6.5.2 Domain Adaptation Using Two Factors . . . 61
6.6 Summary . . . 63
Chapter 7 Thrust 4: Variational Recurrent Neural Networks . . . 64
7.1 Overview . . . 64
7.2 Related Work . . . 65
7.3 Method . . . 65
7.3.1 Variational Autoencoders . . . 65
7.3.2 Variational Recurrent Neural Networks . . . 66
7.4 Experiments . . . 68
7.4.1 Missing Data Analysis . . . 68
7.4.2 Approaches . . . 69
7.4.3 Experimental Setup . . . 69
7.5 Results . . . 69
7.5.1 Results of Overall Prediction . . . 69
7.5.2 Results of Early Prediction . . . 71
Chapter 8 Conclusion and Future Work . . . 73
BIBLIOGRAPHY . . . 77
APPENDIX . . . 89
Appendix A Results Integrating Thrust 1 to Thrust 4 . . . 90
A.1 Overview . . . 90
A.2 Experiments . . . 91
A.2.1 Experimental Setup . . . 91
A.2.2 Evaluation and Setting . . . 91
A.3 Results . . . 91
A.3.1 Results of Overall Prediction . . . 91
A.3.2 Results of Early Prediction . . . 93
LIST OF TABLES
Table 3.1 Data distribution of CCHS according to the consistency between visit-level and event-level labels. . . 18 Table 3.2 After sampling: data distribution of CCHS according to the consistency
be-tween visit-level and event-level labels. . . 18 Table 3.3 After selection: data distribution of CCHS according to the consistency
be-tween visit-level and event-level labels. The number of events is in bold and the number of visits is in parenthesis. . . 19 Table 3.4 After aggregation: data distribution of CCHS according to the consistency
between visit-level and event-level labels. The number of events is in bold and the number of visits is in parenthesis. . . 20 Table 3.5 Data distribution of training and testing sets from one sampling. The number
of visits is fixed and the number of events might change from different samplings. 20
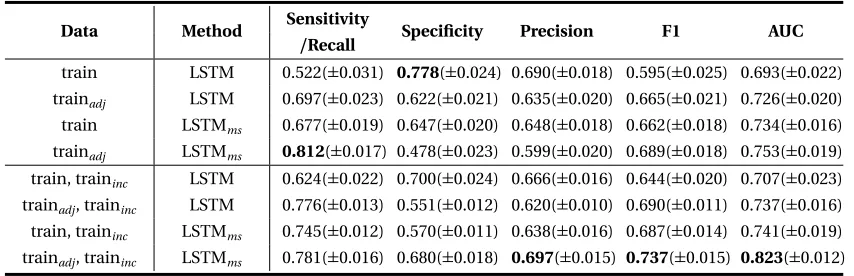
Table 4.1 Performance (±standard deviation) LSTM with or without the multi-scale label learning on different training sets. . . 31 Table 4.2 Performance (±standard deviation) of multiple machine learning baselines
with multi-scale label learning. . . 33 Table 4.3 Performance (±standard deviation) of the framework on testing data with
different ground-truth labels. . . 33
Table 5.1 Performance (±standard deviation) of baselines and our approaches on septic shock overall prediction. . . 43
Table 6.1 Distribution of consistent and inconsistent positive visits according to race and gender across the four age groups. . . 54 Table 6.2 Performance (±std) of models with and without domain adaptation within
race groups. . . 57 Table 6.3 Performance (±std) of models with and without domain adaptation within
age groups. . . 57 Table 6.4 Performance (±std) of models with and without domain adaptation within
gender groups. . . 58 Table 6.5 Performance (±std) of models with and without domain adaptation within
across different groupings. . . 62
Table 7.1 Missing rates of 19 features from CCHS dataset. The first 9 features are vital signs, and the last 10 features are lab results. . . 68 Table 7.2 Performance (±standard deviation) LSTM and VRNN with different imputation
methods. . . 70
LIST OF FIGURES
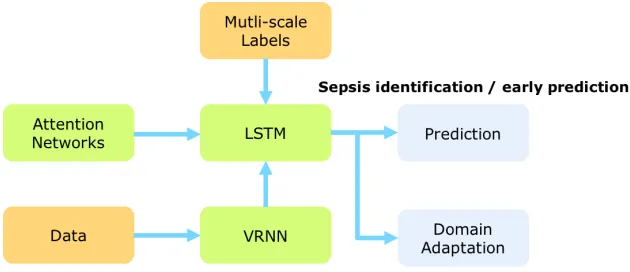
Figure 1.1 The overall framework: originally data have a very high missing rate, we would like to fill up the missing values and then input them to the LSTM. In the learning process, we capture the informative previous events by time-aware attention networks and provide reliable ground-truth by jointly using two levels of labels. Then what have learned is used for prediction and other domains learning. The components in the graph are totally orthogonal. . . 3
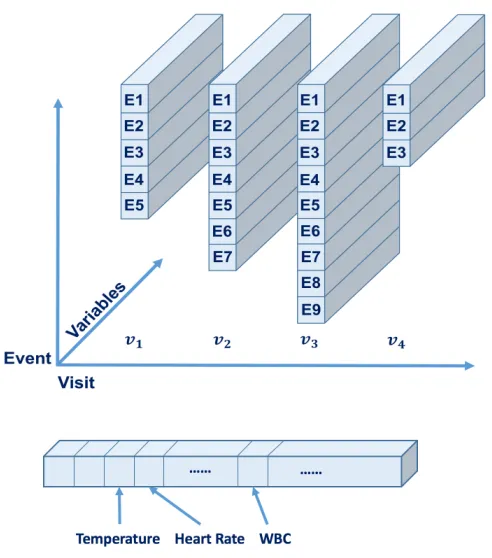
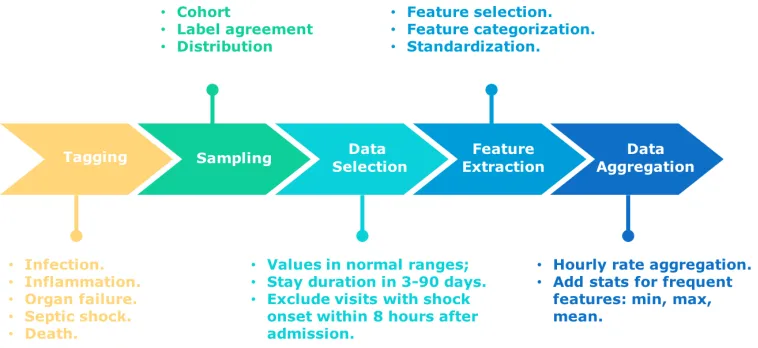
Figure 3.1 The structure of EHRs: each block represents a visit and each bar represents an event. A visit consists of several events. At each event, the patient takes many measurements, such as vital signs of temperature and heart rate, and lab values of white cell count (WBC). . . 14 Figure 3.2 Pipeline of EHR data preprocessing. . . 15
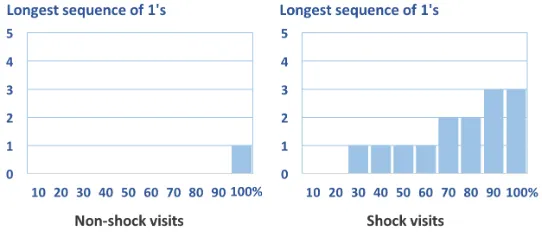
Figure 4.1 (a) The structure of LSTM for sequential classification. (b) The internal struc-ture of a LSTM cell. . . 26 Figure 4.2 The distribution of consecutive ones in non-shock and shock visits. . . 29 Figure 4.3 (a) The Original structure of LSTM. (b) The revised structure of LSTM for early
prediction. . . 34 Figure 4.4 (a) AUC of the two models with shifting labels. (b) F1 of the two models with
shifting labels. . . 35
Figure 5.1 Illustration of proposed ATTAIN model. ATTAIN accumulates the cell states from all the previous events and regularize the old memories through two sources of weights generated from attention mechanism (α) and time inter-vals (∆). . . 39 Figure 5.2 AUC and F1 score of LSTMl when: (a)mis taken from[1, 199]with interval
10. (b)m∈[20, 40]. . . 42 Figure 5.3 (a) AUC of the early prediction on five models. (b) F1-score of the early
pre-diction on five models. . . 44 Figure 5.4 Attention weights for the 11th and 12th events achieved from (a) RETAIN; (b)
LSTMl; (c) ATTAINl. . . 45
Figure 6.1 Temporal Adversarial Networks. . . 51 Figure 6.2 Race and age distribution in positive septic shock visits. . . 54 Figure 6.3 Sensitivity of the domain adaptation process on the amount of unlabeled
target domain data. . . 59 Figure 6.4 Unsupervised vs. supervised processes on male data. . . 60 Figure 6.5 AUC and F1-score of early prediction in: (a) Race: WA-AA; (b) Age: Sr-MID; (c)
Gender: M-F. . . 61
Figure 7.2 Variational Recurrent Neural Networks: the blue line indicates the recurrent process, the yellow line stands for inference process and the green line stands for the generation process. . . 67 Figure 7.3 (a) AUC of early prediction on five models. (b) F1-score of early prediction on
five models. . . 71
CHAPTER
1
INTRODUCTION
1.1
Research Overview
Large scale and systematic patient information documentation enables understating medical history
of patients, identifying interesting cohorts, predicting risks and evaluating interventions. Electronic Health Records (EHRs), one success of such effort, facilitates a systematic collection of temporal
patient data and has provided unprecedented opportunities for exploratory analysis. However, EHRs also pose numerous challenges for traditional data-driven approaches due to the involved complex
variabilities. In real-world EHR datasets, these variabilities mainly includeunreliable ground-truth,
irregular time series,heterogeneous patient groups, andhighly frequent missing values.
Deep reasoning beyond these variabilities is the key to understand, study and improve the
outcomes of a disease, and hence serves a better medical care delivery to public health. In this
dissertation, we design a general framework to address the variabilities in multi-variate EHR data. In particular, we focus on the task ofDisease Progression Modeling(DPM), which monitors the disease
developing process and predicts future risks based on patients’ historical information, and we focus
on a specific disease septic shock, which is life-threatening organ dysfunction and has an extremely high mortality rate.
DPM is crucial for making clinical decisions and providing prompt medications. Given its
is one of the most widely used deep neural networks to handle the sequential EHR data. As an
extension of RNN, the Long-Short Term Memory (LSTM) is specifically designed to capture long-term patterns that commonly exist over a long period of patients’ records[Sun12]. LSTM-based approaches have found a huge success in a variety of tasks involving sequential data, such as video
processing, climate changes detecting, traffic monitoring, and EHRs representation learning[Lip15; Jia17b; Jia17a; Est16; Zha17].
Despite its extensive use, significant barriers remain when applying the standard LSTM for
modeling EHRs. The major research goal of this dissertation is to build a framework that further improves the performance of LSTM and hence better tackle the aforementioned variabilities in EHR
data. Our proposed framework (Figure 1.1) is comprised of four trusts, which can be summarized in
four research questions:
1. Given the multi-scale imperfect labels (from visit levels and event levels), how to learn dis-criminative non-specific septic shock patterns in a long period?
LSTM is used to capture long-term temporal dependencies and underlying progressing
pat-terns in septic shock. However, the performance of standard LSTM would degenerate due to the difficulty in collecting reliable ground-truth labels in health-care domains. To this end, we
design a learning process by jointly leveraging the imperfect labels from different resources
(ICD-9 codes vs. clinical criteria) and at different scales (visit vs. event).
Solution:LSTM with Multi-scale Labels Learning.
2. How to mimic the process of doctors reading records to capture informative historical mo-ments?
In practice, clinicians refer to the records of several previous events to diagnose the medical
condition of a patient. In some cases, the disease progression at a certain event may not rely on most recent events but are more relevant to another events at earlier time steps.
On the other hand, the time interval between two consecutive events is irregular, which
impacts the dependency between consecutive events. We integrate attention mechanism with consideration of time irregularity to the conventional RNN model, to interpret the prediction
results and identify the contributions of the historical events to the current event.
Solution:Time-aware Attention Networks.
3. How to provide specific diagnosis considering heterogenous patient groups?
There exists heterogeneity among different patient groups (domains), i.e. race, age and gender. This leads to discriminative distributions in the nature of EHR data. The learning model for one
specific domain cannot directly apply to other domain. Hence, we utilize domain adaptation
adaptation (DA) method, combining two temporal RNN-based recurrent components, to
extract an invariant feature representation across different patient groups (domains) through an adversarial learning process. While learning the temporal developing patterns of the disease,
the method also identifies the temporal changes of feature distributions across patient groups.
Consequently, we aim to provide a more specific diagnosis.
Solution:Temporal domain adaptation.
4. How to handle frequent missing values in EHR data?
We propose to impute missing values using a generative process (Variational Recurrent Neural Networks, VRNN). The generation of missing data enables the modeling of a complete disease
progression, which consequently contributes to a better classification.
Solution:Variational Recurrent Neural Networks (VRNN).
Figure 1.1The overall framework: originally data have a very high missing rate, we would like to fill up the missing values and then input them to the LSTM. In the learning process, we capture the informative previous events by time-aware attention networks and provide reliable ground-truth by jointly using two levels of labels. Then what have learned is used for prediction and other domains learning. The compo-nents in the graph are totally orthogonal.
1.2
Thesis Statement And Hypotheses
In this work, we design a general framework to address the variabilities in multi-variate EHR data and specifically we will focus on prediction tasks for a specific type of disease, septic shock.
Our proposed framework is comprised of four thrusts, which correspond to the four research
lever-aging the imperfect labels from different resources (ICD-9 codes vs. clinical criteria) and at different
scales (visit vs. event). Together with Long Short Term Memory (LSTM) networks, this method could reliably learn discriminative and non-specific septic shock patterns in a long period. Initially, the
data are labeled at both visit level (ICD-9) and at event level (criteria defined by clinicians). In the
training process, the framework first carries out a standard supervised learning cycle by training a LSTM model with event-level labels. Then we apply the learned LSTM model on the training data to
calculate the probabilities that a patient is in the shock state at any given time point (event level).
With the event-level output, we check the consistency between the event-level and the visit-level information (ICD-9), and revise the training objectives based on conditions. Then the trained LSTM
model is updated using the training data with revised labels. The procedure is iteratively conducted
until the model converges and no changes happen for the labels of training data. By utilizing this iterative training process, we expect the proposed framework to explore latent true labels of septic
shock from combining two levels of noisy labels. In this way, the proposed framework can make
accurate predictions to reflect real disease conditions.
Second, we propose time-aware attention LSTM networks to model the variabilities in EHR
data over time dimension. In particular, the original LSTM pays attention to only one previous
event when generating cell states. In time-aware attention networks, we accumulate all the cell states of previous events to get the historical information and scale each of them by assigning an
attention weight. Attention weights are used to evaluate how important that event to the current event. Meanwhile, the time intervals are transformed to weights through a decay function so that
the outdated events are more likely to play a less important role than recent events for predicting
the outcome of the current event.
Third, there exists a shift between the distributions of different patient groups. We use domain
adaptation techniques to learn an invariant feature representation across the patient groups
(do-mains). Specifically, we investigate the effect of domain adaptation across different races, age levels and gender groups in our EHRs. In the feature learning process, we simultaneously optimize two
discriminative classifiers, the label predictor to predicts class labels and the domain classifier to
discriminate between different domains. In each iteration, the label predictor is optimized so as to extract a hidden representation which maximizes the classification performance while adversely
degrading the domain classifier. In this way, the hidden representation is discriminative and also
invariant across domains.
The last research question is regarding how to handle frequent missing values in EHR data. We
propose to introduce the use of high-level latent random variables to model the variability observed
in data. In the context of standard neural network models for non-sequential data, the variational autoencoder (VAE) offers an interesting combination of non-linear mapping between the latent
random variables and the output and effective approximate inference. VRNN extends the VAE into
are recurrent process, inference process and generation process respectively. The inference process
learns about what latent variables have most likely produced the input data, and then encodes the input to latent variables. The generation process will generate new data from the latent variables,
using the learned distribution from the inference process. The recurrent process is responsible for
modelling the transitions between time steps and is embedded into the other two processes. The methods described in this work are applied to one real-world EHR dataset: the repository of
Christiana Care Health System (CCHS). The raw data are under a complete preprocessing procedure
and are transformed into a format suitable for machine learning systems and the analysis of current research, while minimizing the loss of information due to these transformations.
In the framework, all the thrusts are totally orthogonal. Each thrust is evaluated separately and
compared to multiple strong baselines including the state of the arts. Finally, we combine them together and give an overall evaluation about the contribution of the whole framework.
The evaluation metrics include sensitivity/recall, specificity/true negative rate (TPR), preci-sion/positive predictive value (PPV), F1 score, and area under the ROC (receiver operator charac-teristic) curve (AUC)[NH12]. Precision, recall, F1-score and AUC are widely used to measure the prediction performance for machine learning approaches. In medical science domain, researchers
commonly refer to sensitivity (i.e. recall), specificity (i.e. TPR) and PPV for the annotation perfor-mance. Therefore in our tests, we include the metrics for both machine learning and medical science
domains.
To summarize, this proposal proposes a general framework to solve the challenges from multiple
aspects of variabilies in EHR data. The following hypotheses will be investigated in this proposal:
• Hypothesis 1: There exists vague and non-specific septic shock patterns at an early stage of
the disease that can be captured by LSTM.
• Hypothesis 2: Either visit-level label and event-level labels are imperfect yet informative. The
performance of the machine learning models will greatly be improved when combining them together to make use of good information from both of them.
• Hypothesis 3: The records of a patient in the current moment in not necessarily impacted by the most recent moment. Also, if the period between two successive moments is too long, the
previous moment should not play an active role for the current moment.
• Hypothesis 4: There exists a shift in the distributions of the features collected from differ-ent groups (domains) of patidiffer-ents. The shift will degrade the performance of the traditional
classification models.
• Hypothesis 5: The missing data would provide the incomplete information and would impact
the conclusions from the data. Hence, we expect the generated missing data would be more
1.3
Contribution
The contributions of this dissertation are manifold. It investigates several aspects of variabilities, or
non-deterministic factors, of EHR data and innovative integrate state of the art data mining and
deep learning techniques to provide practical and efficient solutions.
First, the combination of multi-scale labels opens the way of learning from uncertainty. This is
extremely useful since it is very difficult to collect ground-truth in the real world under tremendous
applications. However, we may collect different sources of labels, learn informative information from each of them and make inaccurate information being corrected internally.
Second, the introduction of the attention mechanism with consideration to irregular time
inter-vals and the domain adaptation among heterogeneous patient groups provide a more naturalistic hence more cogent way for clinicians to trust machine learning approaches. In practice, clinicians
believe more in their experience and knowledge than in the conclusions draw from a black box.
The attention networks are mimicking the process doctors look backwards at the records, and help clinicians target at the important moments quickly. Learning from different domains is helpful for
cohort identification and give more specific diagnosis and treatment to different groups of patients. Third, a lot of efforts have been spent on imputing missing data and hence get a better
un-derstanding of patient trajectories. However, the inherent disadvantage of deterministic methods
would only generate the ’averaged’ data. The averaged data may improve the performance of the models more or less, but it is meaningless in the real world. We set our foot on the solid foundations
by applying generative models when generating data. Only striving for generating realistic data, we
are approaching to deeply understand the disease progression with respect to each specific patient. Last and equally important, we apply the whole framework on an extremely challenging disease,
septic shock. Sepsis is a leading cause of all the world and takes a huge part of total hospital cost.
The annualized incidence is still keeps rising. The proposed framework will help doctors identify the patients who are developing sepsis/septic shock and give immediate care for them, which would be a huge social good. On the other hand, the framework can be easily generalized to other types of
disease and contribute to a better medical care delivery the public health.
1.4
Organization
The organization of this dissertation is as follows: Chapter 2 introduces the machine learning approaches that have been applied to EHRs, Recurrent Neural Networks and the background of
sepsis/septic shock. Chapter 3 describes the dataset used in this dissertation and the data prepro-cessing procedure. Chapters 4-7 present a detailed description of the four research thrusts. For each thrust, the literature review, proposed framework, experimental design, and results are presented.
CHAPTER
2
BACKGROUND
In this section, we first briefly review the common machine learning approaches that have been
applied to EHR data, and specially introduce the Recurrent Neural Networks, which is a basic model used in this dissertation. Next, we present an overview of the task of Disease Progression Modeling
and sepsis/septic shock, the specific type of disease this dissertation focuses on.
2.1
Machine Learning for EHR
Electronic Health Records (EHRs) have reduced clinical errors[Sin12; Abr11; SG10], improved chronic illness care[Dor07; Sho09; Cro07]and improved the completeness, accuracy and timeliness of medical care to public health. On the other hand, EHRs also pose numerous challenges, such
as they are sparse, noisy, heterogeneous, incomplete, high dimensional and systematic biased
[Mio16]. Since EHR systems provide detailed care information of large patient populations with long follow-up times, these challenges have been addressed in machine learning community through
data-driven healthcare research and advanced analytics.
Basically, machine learning approaches for healthcare can be broadly categorized as supervised or unsupervised: supervised methods take labels or outcomes as a learning guidance, while
unsuper-vised methods simply learn the patterns from data. The temporal nature of EHR also suggests that
Unsupervised methods have been widely used for identifying clusters of patients that have
similar characteristics (e.g. demographics, medications, diagnosis codes, laboratory test results) and for finding associations between clinical concepts (e.g. medications, diagnosis codes and
demographic attributes). For example, patient are stratified using hierarchical clustering, where the
distance between patient records was computed by the cosine similarity of diagnosis codes[Roq11], or using medical concepts ((medication information, diagnosis codes, procedure codes), where the
Jaccard index was used as the similarity measure[BM13]. Association rule mining is used to identify co-morbidities (e.g. non-insulin dependent diabetes mellitus (NIDDM) and cerebral infarction) which are strongly associated with hypertension[Shi10]and to detect transitive associations between laboratory test results and diagnosis codes[Wri10]. In addition, significant improvements have been achieved when temporal nature of EHRs is taken into account in these unsupervised methods. The temporal Hidden Markov Model (HMM) is used to cluster patient medical trajectories[Gha14]. The temporal abstraction framework has been frequently used to prepare patterns of from EHR
data. Patterns can be fist abstracted using state representations (e.g. high, medium or low) or trend representations(e.g. increasing, decreasing, constant)[Sha97], and then be used to generate temporal association rules[Ver07; Hri15].
Generally, supervised methods aim to investigate the associations between risk factors and the outcome of interest. In non-temporal supervised methods, they usually transform time-dependent
predictors to non-temporal predictors through temporal abstraction or summary statistics (e.g., mean, standard deviation), and then employ traditional predictive modeling techniques, such as
decision trees[Man14] [Sar10], ensemble techniques (e.g. bagging, boosting, random forests)[Man14; Cho12; Kaw12; Kar12], logistic regression[Hua14; Cho12]and support vector machines[Man14]to predict a specific outcome. For example, these methods are widely used in predicting neonatal sepsis
[Man14], potentially preventable events[SS13], risk of depression using diagnosis codes[Hua14], breast cancer survivability[Sar10], post-hospitalization VTE risk[Kaw12], atrial fibrillation[Kar12], mortality prediction in ICU[Her13]and so on. All of these non-temporal supervised methods rule out longitudinal analysis and do not adequately capture temporal relationships among medical
events that are inherently existed in EHRs. On the other hand, these methods usually depend on feature engineering which is time-consuming and heavily based on clinical expertise.
Temporal supervised approaches have been extensively explored to learn the underlying
tempo-ral dynamics in EHRs.Survival Modelinghave been used widely in the past to analyze the expected duration of time until one or more events happen (e.g. time until death in biological organisms). Cox
regression[VR13]is one of the most commonly used survival regression models. Its semi-parametric nature with the mild assumption of the proportionality of hazards makes it fit to many fields includ-ing healthcare[Ike91] [Lum02]. For example, a stabilized sparse Cox model is proposed to estimate the feature graph derived from the temporal structure of the disease and intervention recurrences,
susceptible to overfitting as most other regression models, standard regularization techniques are
applied, such as Lasso[Tib97]and elastic-net regularization[Sim11].Dynamic Bayes Networksis another type of models that has been widely used to incorporate temporal relationships among
EHRs. For example, DBN is applied to model temporal relationships between insulin and glucose
homeostasis[Nac10]. DBN is used to assist physicians in monitoring the weight of patients suffering from chronic renal failure[Ros05], to model heart failure[Gat12]and model organ failure[Pee10]. These markovian models assumes that the patient’s current medical state only depends on the
his/her state on one previous visit/event, without considering the complexity of physiological pro-cesses in a long period and the nonlinear developing patterns among medical events.Sequential Pattern Mininghas been recently implemented for monitoring and event detection problems in patients suffering from Type 2 diabetes mellitus (T2DM) through extending the temporal abstraction framework[Bat12]. Similar techniques are also used for detecting sequential rules associated with the early identification of brain tumors[SN13].
2.2
Recurrent Neural Networks
Deep Learning(DL) techniques have become exceptionally popular in healthcare domain since they can assist in mitigating the impact of noise and in learning complex relationships among medical events. Lots of prior works employ deep neural networks to map EHRs to clinical outputs in
the tasks of phenotype learning[Las13; Mio16; Che15; Ham15]or representation learning[Cho16c; Mio16]. However, these deep neural networks do not fully address the temporal nature of EHRs and hence not capture the progressing patterns of patent’s health status. To this end, Recurrent Neural
Networks (RNN)[Elm90]that generates the outputs depending on not the current information but previous information is developed. Besides, the shared parameters over time enables the flexibility of dealing with sequences at varying length. Overviews of RNN for sequential learning and the broad
applications are thoroughly described in multiple survey literature[Gra; DM15].
However, by the early 1990s, the vanishing gradient problem emerged as a major obstacle to RNN in long sequences[Pas12]. To tackle this problem, researchers have designed several effective variants of RNN, such as Long Short Term Memory (LSTM) networks[HS97]. LSTM is capable of memorizing temporal dependencies over a long period[Sun12]and have found a huge success in a variety of tasks involving sequential data, such as video processing, climate changes detecting,
traffic monitoring, EHRs representation learning[Lip15; Jia17b; Jia17a; Est16; Zha17], etc. The ability of LSTM to recognize patterns in multivariate sequential EHRs has been validated on multi-label classification of diagnoses[Lip15].
Many efforts have been made, allowing RNN and LSTM to be better fit for EHRs applications. For example, the missing patterns led by irregularly spaced measurements in EHRs are investigated
[Lip16]. Some studies focus on addressing the episodic and irregular recording of EHRs. DeepCare
[Pha16]introduces time parameterizations to enable irregular timing by moderating the forgetting dynamics in LSTM. GRU-D[Che16]achieves better prediction results on both synthetic and real-world healthcare datasets by incorporating informative missing patterns represented by masking and
time intervals. The short-term memory is separated from the long-term memory at each time step of LSTM[Bay17]. Then the short-term memory is discounted according to the time spans between two consecutive moments while the global profile of the patient remains the same. Furthermore, it
has shown to be effective that combining static information, such as demographics, and dynamic information, such as vital signs, of EHRs for clinical event prediction.
There have been active research in modifying the structure of RNN/LSTM and combining them with other efficient deep learning architectures, such as fully connected neural networks[Est], Con-volutional Neural Networks (CNN)[Lai17], etc. RNN or LSTM with attention networks are widely developed to generate interpretations for EHRs[Cho16b; Ma17; SW17]. As frontier work, RETAIN
[Cho16b]applied a two-level attention networks to identify meaningful visits and specific features that contribute to the prediction. Also, the performance of standard RNN/LSTM can be severely impacted due to the inherent heterogeneity among patient groups in EHRs[Nor17]. Domain adapta-tion, learning the common predictive patterns that help infer and transfer knowledge across different patient groups[Gan16], has become a natural solution to tackle such problems in healthcare field
[HY09; Soc11; Pur16; Che18]. Generative models with recurrent structure, such as Variational Re-current Neural Networks enables better modeling of variability in temporal progression, which
has shown success in speech modeling, handwriting generation, and recommend systems[Chu15; Chr17]. VRADA, Variational Recurrent Adversarial Deep Domain Adaptation, combines the compo-nents of RNN, generative process and domain adaptation together and is the first work to empirically
demonstrate that transferring the complex temporal latent dependencies between domains can
help improve the model prediction for multivariate healthcare time-series data[Pur16].
2.3
Sepsis
/
Septic Shock Prediction
Disease Progression Modeling(DPM) monitors the disease developing process and predicts future risks based on patients’ historical information. DPM is crucial for making clinical decisions and providing prompt medications. There have been many studies that focus on modeling the temporal
pulmonary disease (COPD) and its co-morbid diseases[Wan14].
In this dissertation, we validate the proposed framework on modeling the progression of a spe-cific disease, septic shock. Sepsis is a life-threatening organ dysfunction caused by a dysregulated
host response to infection[Sin16]. Sepsis is characterized with several negative factors including longer and larger number of hospitalizations, greater medical costs, and increased risk of death. As a leading cause of death in the United States, sepsis accounts for nearly $24 billion (6.2%) of
total hospital costs in 2013[TA16]. Each year 1.6 million people are diagnosed with sepsis, more than prostate cancer, breast cancer and AIDS combined[Eli11; HS17]. Septic shock is defined as a subset of sepsis in which particularly profound circulatory, cellular, and metabolic abnormalities
are associated with a greater risk of mortality than with sepsis alone[Sin16]. As the most severe com-plication of sepsis, septic shock reaches a mortality rate as high as 50%[Mar03]and the annualized incidence keeps rising[DL08].
There exist plenty of general-purpose illness severity scoring systems to access health status
of sepsis/septic shock patients[BL95; GZ11]. They include: Sequential Organ Failure Assessment (SOFA) Score[Vin96], Mortality in Emergency Department Sepsis (MEDS)[Sha03], Acute Physiology and Chronic Health Evaluation (APACHE II)[Boh88], Predisposition Insult Response and Organ failure (PIRO)[Rel09], Modified Early Warning Score (MEWS)[Sub01], Rapid Emergency Medicine Score (REMS)[Ols04], Simple Clinical Score (SCS)[Sub10], Simplified Acute Physiology Score (SAPS II)[LG93]. Even though these scores are useful for general deterioration and mortality, they typically cannot distinguish patients who are developing an acute condition (e.g. septic shock) with high
sensitivity and specificity[Hen15]. For example, the AUC of SCS and REMS, which are concluded as the most appropriate clinical scores to predict the mortality of patients with sepsis[GZ11], are 0.76-0.79 and 0.74-0.79 respectively.
The broad adoption of EHRs in medical systems has promoted the development automating
tools that identify patients with sepsis/septic shock and hence provide prompt treatment, e.g. early warning systems, track and trigger initiatives, sniffers and listening applications[Her11; NM14; Ums15; Nel11]. However, these tools can only detect patients currently experiencing sepsis/septic shock and cannot detect patients who are at great risk of developing sepsis/septic shock.
Prior studies have demonstrated that early diagnosis and treatment of septic shock can decrease
patients’ mortality and length of stay significantly[RM06; Kum06; CW11; Hen15]. As many as 80% of sepsis deaths could be prevented with rapid diagnosis and treatment[Kum06]. Conversely, every hour of delay in antibiotic treatment leads to an 8% increase in mortality for septic shock
patients[Kum06]. Therefore, most recent studies have focused on early prediction of sepsis/septic shock[Giu07; Thi10; Hen14]. Given the rich clinical information (e.g., demographics, vitals, labs, treatment,etc) in EHRs, machine learning techniques are widely applied to construct predictive
and achieves the AUC of 0.940, the sensitivity of 0.85 and the PPV of 0.70[Sha07]. A targeted real-time early warning score (TREWScore) is fit in a Cox proportional hazards model and reports the AUC of 0.83, the specificity of 0.85 and the sensitivity of 0.74[Hen15]. A dynamic Bayesian network, modeling the progression of organ failure, reaches the AUC of 0.911 using 24-hour training data
after admission and 0.944 using 3-hour training data after admission[Pee10]. SVM has also proven to be effective at sepsis-related classification tasks[Wan10; TM10]. Additionally, neural networks have been applied to medical problems for more than 20 years[Bax95; Bra02; Xun16]. In particular, temporal or sequential neural networks, e.g. RNN/LSTM, has been applied to prediction problems in genomics[Xu07], general diagnosis termed as phenotyping[Lip15; Est], etc, but not specifically implemented on the task of sepsis/septic shock prediction (to our best knowledge).
Nevertheless, several challenges remain to prevent early diagnosis and treatment for patients at risk of sepsis/septic shock. First, sepsis includes multiple subtypes and patients in different subtype might express drastically different symptoms[Rel09]. These symptoms at the early stage of sepsis/septic shock are often subtle and non-specific. Therefore, it is difficult for most sequential models to timely capture the discriminative patterns in sepsis/septic shock progression, especially when patient’s stay spans over a long time. Second, there is continued disagreement between
govern-ment agencies on the definition of sepsis and septic shock (e.g., Center for Medicare and Medicate, professional societies, and Third International Consensus Definitions for Sepsis and Septic Shock)
[Sey16]. This leads to that different research institutes may adopt various biomarkers/indicators to identify sepsis-related population and use relatively small and carefully curated datasets with limited
CHAPTER
3
DATASETS
The framework described in this dissertation is applied to one real-world EHR dataset: the repository
of Christiana Care Health System (CCHS). In this chapter, we briefly describe the details of the data. In addition, we perform a rigorous preprocessing procedure to transform and abstract the raw
data into a format suitable for machine learning systems while keeping the loss of information
minimized. Finally, we split the data into training and testing sets for future experiments of each thrust and the whole framework.
3.1
Data Description
We use retrospective EHRs collected from Christiana Care Health System (CCHS) as part of our
col-laborative National Science Foundation supported grant entitled S.E.P.S.I.S.: Sepsis Early Prediction
Support Implementation System. CCHS is a none-profit healthcare system with over 53,000 hospital admissions per year and 1,100 hospital beds. The CCHS dataset consists of EHRs of hospitalized
adult patients (i.e. age≥18) within CCHS from July 2013 to December 2015. In total there are 119,968
unique patients and 210,289 hospitalizations/visits. The length of hospital stays ranges from 30 min-utes up to three years. Emergency department (ED) visits without subsequent hospital admission
and visits with any surgical hospitalization are excluded and all the data are anonymized.
clin-ical measurements such as temperature, heart rate, etc. The measurements might leave blank if
pa-tients are not taken at the moment. The structure of our EHRs is shown in Fig. 3.1. Different visit may have various number (ranging from 1-3,464) of events, but the measurements/attributes/variables at each event are structured. In total, we have 10,412,729 medical events in 210,289 visits.
Figure 3.1The structure of EHRs: each block represents a visit and each bar represents an event. A visit consists of several events. At each event, the patient takes many measurements, such as vital signs of temperature and heart rate, and lab values of white cell count (WBC).
3.2
Data Preprocessing
The raw EHRs are distributed in different tables in the system and have various formats. We perform
a rigorous data preprocessing, determined by the leading clinicians with extensive experience on
this subject from CCHS and Mayo Clinic, to prepare the data and narrow down the study population for our machine learning framework. The schematic of the overall process is shown in Fig. 3.2 and
Figure 3.2Pipeline of EHR data preprocessing.
3.2.1 Tagging
International Classification of Diseases, Ninth Revision (ICD-9) are widely used for clinical labeling (i.e., sepsis/septic shock or not). However, as visit-level labels, ICD-9 codes cannot tell when septic shock occurs at event level, and as administrative codes, they have been in doubt regarding the ability to establish gold standards for clinical conditions[Ho14a].. Therefore based on Third International Consensus Definitions[Sin16],at each event, our clinicians defined four stages of sepsis ordered by increasing severity: Infection, Inflammation, Organ Failure, and Septic Shock as follows:
• Infection: administration of a single dose of any infective (antibiotic, antiviral, or anti-fungal) or any positive PCR test result.
Rationale:our clinicians aim to include all the patients withsuspected infection, or sepsis-related population, by setting a relatively low criteria. We define this population as our study
population and narrow down to a dataset with 52,919 visits and 4,224,567 medical events from the original dataset with 10,412,729 medical events in 210,289 visits.
• Inflammation: the presence of an abnormality within any of the inflammatory criteria defines a positive inflammatory state, with each abnormality being summative representing the
inflammatory burden:
– Cellular Response:
White blood cell>12,000 cells; Bandemia of white blood cells>10%;
C-Reactive Protein (CRP)>8 mg/L; Procalcitonin>0.15 ng/mL. – Physiologic Response:
Heart rate>=90 beats/minute;
Respiratory rate>=20 breaths/minute; Shock Index>1.0;
Temperature>=38oC (100.4oF); Temperature<36oC (96.8oF).
Rationale: inflammation exists on a broad spectrum that can be identified by different
biomark-ers. Expanding the inflammatory criteria can be useful for the risk stratification of sepsis. Its inclusion is mainly intended for investigation purpose.
• Organ Failure: the presence of an abnormality within any of the specified organ systems criteria defines a positive organ failure state. Each dysfunction is summative representing an
organ failure burden:
– Cardiovascular:
Systolic blood pressure<90 mmHg; Mean arterial pressure<65 mmHg;
Decrease in systolic blood pressure>40 mmHg within an 8-hour window.
– Metabolic:
Lactate>2.0 mmol/L. – Renal:
Creatinine>1.2 mg/dL;
Creatinine increase>50% from initial creatinine; Urine output<500mL over 24 hours;
BUN>20 mg/dL. – Respiratory:
New oxygen requirement;
Mechanical ventilation requirement;
Pulse Oxygen OR SpO2<90%; Fio2>21%;
– Nervous:
Glasgow Comma Score (GCS)<14; Verbal GCS<5.
– Gastrointestinal
Bilirubin>2 mg/dL.
Rationale:the criteria of the presence of organ failure with an active infection is widely used
by previous works and scoring systems to identify patients with sepsis. However, the
condi-tions defined in this criteria are not clearly explained and are practiced in different ways by different hospitals. Here our clinicians include such definition for future incorporation of
novel predictive tools and re-design of EHRs.
• Septic Shock: the presence of an abnormality within any of the specified septic shock criteria defines a positive septic shock state:
– Persistent hypotension as shown through two consecutive readings (>=30 minutes apart) for more than one hour;
Systolic Blood Pressure<90 mmHg; Mean arterial pressure<65 mmHg. – Any vasopressor administration.
Rationale:Traditional definition of septic shock usually presumes an Intensive Care Unit (ICU)
admission. The definition here relies on patient-centered physiological criteria, i.e. having
received vasopressor(s) or having had persistent hypotension, and is also able to identify non-ICU population. In this dissertation we use this definition to obtain event-level labels of
septic shock.
3.2.2 Sampling
We cannot solely depend on either visit-level label, i.e. ICD9 codes, or event-level label, i.e. clinical
criteria (described in Chapter 3.2.1), as ground truth of septic shock (described in Chapter 4.1). Here
we define the consistency between visit-level label and event-level label to separateconsistentdata with more reliable labels andinconsistent data with less reliable labels as follows. The two-level
labels are consistent (in blue) if: 1) for positive samples, ICD-9 indicates a septic shock visit and there
exists at least one event in this visit meeting the shock criteria (i.e. with positive event-level label); and 2) for negative samples, ICD-9 shows no indication of septic shock and all events in this visit
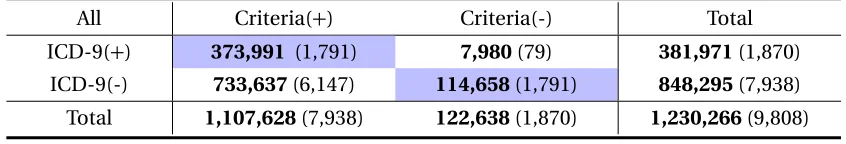
Table 3.1 shows the distribution of visits regarding the consistency between the two levels of
labels in CCHS. When applying both ICD-9 codes and our clinical criteria, we identify 1,869 shock positive visits and 23,901 negative visits, referred to asconsistentvisits. Given the imbalanced ratio
of positive and negative visits, we further conduct stratified random sampling on the 23,901 negative
visits while keeping their underlying distribution of age, gender, ethnicity and length of stay the same as positive visits, and then get 1,869 consistent negative visits. Additionally, we keep 86inconsistent
visits (ICD-9(+) & Criteria(-)), and sample 6,147inconsistentvisits (ICD-9(-) & Criteria(+)). The data distribution after sampling is shown in Table 3.2.
Table 3.1Data distribution of CCHS according to the consistency between visit-level and event-level la-bels.
All Criteria(+) Criteria(-) Total
ICD-9(+) 1,869 86 1,955
ICD-9(-) 27,063 23,901 50,964
Total 28,932 23,987 52,919
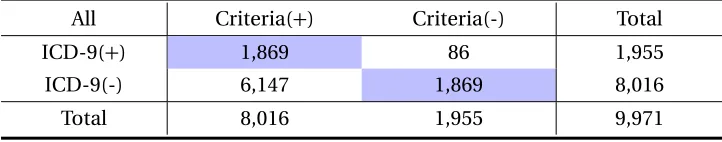
Table 3.2After sampling: data distribution of CCHS according to the consistency between visit-level and event-level labels.
All Criteria(+) Criteria(-) Total
ICD-9(+) 1,869 86 1,955
ICD-9(-) 6,147 1,869 8,016
Total 8,016 1,955 9,971
3.2.3 Data Selection
EHRs contains errors and noise. We exclude the measurements in clinically unreasonable ranges.
And we only include visits with stay duration from 3 days to 90 days since short visits do not hold sufficient information for analysis and long visits introduce data sparsity. More importantly, we
exclude the visits that developed septic shock within 8 hours after admission to hospital, because
to accurately predict septic shock after 8-hour admission. The data distribution, the number of
events (in bold) and the number of visits (in parenthesis) after data selection is shown in Table 3.3. Note that we keep the number of consistent negative visits as the same as the number of consistent
positive visits.
Table 3.3After selection: data distribution of CCHS according to the consistency between visit-level and event-level labels. The number of events is in bold and the number of visits is in parenthesis.
All Criteria(+) Criteria(-) Total
ICD-9(+) 373,991 (1,791) 7,980(79) 381,971(1,870) ICD-9(-) 733,637(6,147) 114,658(1,791) 848,295(7,938) Total 1,107,628(7,938) 122,638(1,870) 1,230,266(9,808)
3.2.4 Feature Extraction
We include all the features shown in our tagging criteria as described in Chapter 3.2.1. We exclude
features with a missing rate more than 90% to reduce the sparsity of the data. In our raw EHRs,
cate-gorical features are input from drop-down lists or in forms of free text. We first unify the categories with each categorical feature through natural language processing techniques and transform them
into one-hot vectors. All the numeric features are standardized.
In brief, other than the patient information, such as gender, age, ethnicity, etc., each event at one visit consists of attributes/features of four categories: 1) vital signs: heart rate, temperature, etc.; 2) lab results: BUN, creatinine, white blood cell count (WBC), 18 culture tests, etc.; 3) interventions:
FIO2, oxygen flow, etc.; 4) locations (e.g., emergency or nurse), descriptions, identifiers.
3.2.5 Data Aggregation
In the collecting process of EHRs, an event is created whenever a measurement/feature is taken. For example, one event is created when the patient’s temperature and heart rate are measured, and a new event is created when the patient’s blood pressure is measured a few minutes later. Since events are
structured with a fixed number of features, the first event would have only two non-empty features
and have the missing values for all other features. Similarly, the second event would be almost blank. To mitigate such data sparsity, we aggregate the events recorded within one-hour window to one
event and take the mean value of each feature as values for the new generated event. For frequently
and the missing rate of the whole dataset from∼80% to∼60%. We will investigate different data
imputation methods in Chapter 7. In other experiments we adopt the baseline mean-imputation methods, which fills all the missing values with the mean value of the corresponding features.
Table 3.4After aggregation: data distribution of CCHS according to the consistency between visit-level and event-level labels. The number of events is in bold and the number of visits is in parenthesis.
All Criteria(+) Criteria(-) Total
ICD-9(+) 151,037 (1,791) 4,190(79) 155,227(1,870) ICD-9(-) 368,913(6,147) 66,729(1,791) 435,642(7,938) Total 519,950(7,938) 70,919(1,870) 590,869(9,808)
3.3
Data Split
We always validate our framework on the data with more reliable ground-truth, i.e.consistentvisits.
To do so, we include∼80% of the positive consistent visits (ICD-9(+) & Criteria(+): 1791) in the training set, and the remaining∼20% of them in the testing set. Even in these positive consistent visits, the negative events are dominant and their ratio accounts for 87% of total number of events (131,056
out of 151,037). Since we perform evaluation at event-level and negative visits only contribute
negative events, we only sample a few number of consistent negative visits (ICD-9(-) & Criteria(-): 1791) in training and testing set, and the ratio of positive events falls in the range of 10%∼15%.
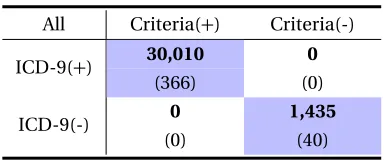
Table 3.5Data distribution of training and testing sets from one sampling. The number of visits is fixed and the number of events might change from different samplings.
(a)Training Set.
All Criteria(+) Criteria(-)
ICD-9(+) 121,027 4,190
(1,425) (79)
ICD-9(-) 90,525 5,399
(1,425) (150)
(b)Testing Set.
All Criteria(+) Criteria(-)
ICD-9(+) 30,010 0
(366) (0)
ICD-9(-) 0 1,435
(0) (40)
include inconsistent data in the training data. In specific, we keep all the 79 visits with labels
CHAPTER
4
THRUST 1: LEARNING FROM
MULTI-SCALE LABELS
4.1
Overview
This thrust investigates two major challenges associated with sepsis/septic shock prediction: the first one is the subtle progression of sepsis/septic shock in a long period and the second one is the lack of well-established definition for labeling sepsis/septic shock. Correspondingly, we provide a solution of learning from multi-scale labels.
As for the first challenge, the clinical signs and symptoms at the early stage of sepsis/septic shock are often subtle and non-specific. For example, only minor changes are reflected on white cell count and body temperature at the early stage of sepsis. Moreover, infection, a hallmark of sepsis, is
highly likely to progress to other disease and hence not a specific symptom for sepsis. Therefore, it is critical to learn about the discriminative patterns of sepsis/septic shock and capture the informative progression during a patient’s stay. It becomes especially challenging when the whole stay spans
over a long time since it is difficult for most of the sequential models to memorize so many details and persistently connect previous information to the present without much loss.
To overcome this challenge, we model the septic shock progression using a variant of Long-Short
Jia17b; Jia17a; Est]. Compared with other sequential models like Recurrent Neural Networks (RNN), LSTM is capable of memorizing temporal dependencies over a long period[Sun12]. On the other hand, the electronic health records (EHRs) is a popular research platform with increasing availability
to develop predictive models for acute medical conditions such as septic shock. However, EHR data
also poses numerous challenges, such as they are noisy, fragmental and high dimensional. To this end the incorporation of temporal dependencies can assist in mitigating the impact of noise and in
learning complex relationships among features.
The second challenge stems from no gold-standard definition or criteria of labeling sepsis/septic shock at any given time point. Due to varying purposes and expertise levels on the disease, different
decision-making systems have certainbiaseson labelling sepsis/septic shock. During each hospital visit, a patient usually takes multiple tests and gets measurements at different time points. The assessment for the entire visit provides avisit-levellabel while the assessment for each time point
provides anevent-levellabel. We argue that though informative, both levels of labels are imperfect
and they do not even agree for many cases.
At the visit level, septic shock patients are identified through the so-called International
Classi-fication of Diseases, Ninth Revision (ICD-9) code (“785.52") for billing purpose. As billing codes,
ICD-9 is only coded for limited number of complications and dramatically different diseases can often share the same billing code as long as they have the same cost. Hence, ICD-9 may report false
positives of septic shock and cannot fully represent the real medical states of patients. Indeed it has been widely argued that ICD-9 codes cannot be used for establishing reliable gold standards for
various clinical conditions[Ho14b; Giu07].
At the event level, septic shock is usually determined by clinical criteria which is generally set based on current vital signs and lab tests, such as “hypotension" or “ongoing vasopressor therapy".
The event-level labels are often noisy since the attributes/features involved in the criteria are not always observable and updated at each time point. For example, white cell count is only tested every 24 hours. Generally in this situation the unavailable values are filled with the ones from
previous moments, which may lead to out-of-state evaluation for patients’ states. Moreover, the
values of some attributes return to normal after patients receive a treatment, such as vasopressor administration, resulting in a negative event-level label even though the patient is still in septic
shock. Finally and most importantly, there exists no well-established clinical criteria on whether a
patient is in septic shock state at each time point.
To summarize, although visit-level labels and event-level labels allow us to grasp certain useful
information of the disease, we cannot directly utilize them as ground truth of septic shock. Therefore,
we propose a framework to learn the sequential patterns of septic shock by jointly leveraging both levels of imperfect yet informative labels. Initially, the data are labeled at both visit level (ICD-9
codes) and at event level (criteria defined by clinicians in Chapter 3.2.1). In the training process,
with event-level labels. Then we apply the learned LSTM model on the training data to calculate
the probabilities that a patient is in the shock state at any given time point (event level). With the event-level output, we check the agreement between the event-level and the visit-level information
(ICD-9) and revise the training objectives based on conditions. Then the trained LSTM model is
updated using the training data with revised labels. The procedure is iteratively conducted until the model converges and no changes happen for the labels of training data. By utilizing this iterative
training process, we expect the proposed framework to explore latent true labels of septic shock
from combining two levels of noisy labels. In this way, the proposed framework can make accurate predictions to reflect real disease conditions.
We validate the proposed method on real-world EHRs (CCHS dataset described in Chapter 3)
and compared it with multiple strong baselines. In practice there are various ways to manually adjust the data labels to approach ground truth, so we test the robustness of the framework by
comparing its prediction results against three sets of ground-truth labels. Finally, we demonstrate
that the proposed framework is also effective for early prediction of septic shock.
4.2
Related Work
Machine learning techniques have achieved considerable success in predicting sepsis/septic shock by using visit-level or event-level labelsbut not both. At visit level, most prior work used ICD-9 code
as ground truth and considered the whole visit as one sample. For example, Brauseet al.[Bra02]used neural networks to predict the critical states of sepsis; support vector machines (SVM) was proved to be effective at sepsis-related classification tasks[Wan10; TM10]. To truly grasp the temporal dependencies and capture the subtle progression of septic shock, it is important to predict at event
level. Peelenet al.[Pee10]developed a dynamic Bayesian network (DBN) to model the progression of organ failure, a severe state developing into septic shock. Generally speaking, compared to works
done at visit level, relatively less work was done at the event level for predicting septic shock, due to
the fact that there is no well-established criteria on labelling septic shock at any time point. Some work relied on the labels manually annotated by clinicians[NH12], but such labeling process is often too expensive to be feasible for large volume of data.
There have been some studies take the intersection of ICD-9 code and event-level criteria to select positive and negative cases, e.g., septic shock patients are identified by ICD-9 code and the