DOI: https://doi.org/10.30880/ijie.2018.10.01.006
*Corresponding author: [email protected]
2018 UTHM Publisher. All right reserved. penerbit.uthm.edu.my/ojs/index.php/ijie
35
Non-Destructive Oil Palm Fresh Fruit Bunch (FFB) Grading
Technique Using Optical Sensor
Sebastian Liban Utom
1, Elmy Johana Mohamad
1,*, Hanis Liyana Mohmad
Ameran
1, Herdawatie Abdul Kadir
1, Siti Zarina Mohd Muji
2, Ruzairi Abdul
Rahim
1, Jaysuman Pusppanathan
31Department of Mechatronic & Robotic Engineering 2Department of Computer Engineering
Faculty of Electrical & Electronic Engineering, Universiti Tun Hussein Onn Malaysia, 86400 Batu Pahat, MALAYSIA
3Faculty of Biosciences & Medical Engineering
Universiti Teknologi Malaysia, 81310 Skudai, MALAYSIA
Received 2 October 2017; Accepted 1 March 2017, Available online 30 April 2018
1. Introduction
Generally, the most important factor for agricultural and food produce is the quality. High quality produce is significant for success in current market which is highly competitive. In term of agricultural application, the quality of produce, especially fruits, is often classified by their texture, shape and color [1]. Usually, most of agricultural produce is being divided into several grades where most of the time, they are being graded manually by human eyes and observation [2]. However, this manual grading method is tedious and not reliable [3]. Hence, it is necessary that another technique of grading need to be developed using sensor-based technology such as optical sensors.
One of the major agricultural produce in Malaysia is oil palm. Oil palm ripeness can be categorized into three critical categories which is under-ripe, ripe and over-ripe. Oil palm fruit color varies from very dark purple to orange depending on its gene and ripeness. Currently, the method used to determine the ripeness of the FFB is by observing
the existence of loose oil palm fruits on the ground around the tree before the FFB is cut down (no loose fruits if the FFB is under-ripe, few loose fruits if it is ripe and many loose fruits if it is over-ripe). Another method is by counting the number of loose fruit sockets on the bunch [4]. The observation of loose fruits for ripeness prediction of oil palm FFB on tall trees has been practiced until today. However, this method may be inaccurate because loose fruits might fall under a different tree and can be stuck in the fronds, washed away by heavy rain or taken by animals in the estate [4].
2. Methodology
2.1 Non-destructive oil palm FFB grading
technique using optical sensor
Figure 1a shows the completed non-destructive oil palm FFB grading system using optical sensor which is portable and user friendly. It consists of several components that were combined inside a 3D printed
Abstract: This research discovers the uniqueness of physical and optical characteristics of the oil palm Fresh Fruit
Bunches (FFB). The goal is to determine the level of ripeness of the oil palm FFB by creating a non-destructive and real-time oil palm FFB grading system. This grading system is a solution to automate the current grading process in order to provide more accurate and reliable results. Apart from that, the costs, labor and time consume will also be reduced. In Malaysia, the grading of oil palm FFB is still performed manually by observing the surface color as the main quality attribute. This project explores the chlorophyll content in oil palm and uses its characteristic as a level selector to classify the degree of oil palm FFB ripeness. In this case, the level of ripeness are divided into three categories which are unripe, ripe and over-ripe. There are several phases involve in the non-destructive oil palm FFB grading system using optical sensor. First phase is the determination of reflectance data for all three classes of the oil palm FFB. This will be determined by using a light source with 670 nm wavelength. The light sources will emit a projection of light that will illuminate the skin of the oil palm FFB. The reflected light will be received by the optical sensor and the reflectance value are obtained. Last phase is the analysis of the data obtained by using statistical analysis. The expected outcome of this project is to study and understand the process of using LED and optical sensor as the data collecting method to determine the level of ripeness of the oil palm FFB.
36
hardware body. The components involved are Arduino Mega 2560, ultrasonic sensor HC-SR04, phototransistor, Light Emitting Diode (LED), and Liquid Crystal Display (LCD). The whole system draws power from a 9 volt rechargeable battery. The hardware can be divided into 3 important parts namely the front, top and inside of the hardware. The front side consists of the sensor part where it holds the ultrasonic HC-SR04 and the optical sensor phototransistor. The inside consists of the Arduino Mega 2560 which acts as the microcontroller. Lastly the top part is the display part where it displays user instructions as well as the results of each readings (Figure 1b).
(a)
(b)
Figure 1: Non-Destructive Oil Palm Fresh Fruit Bunch Grading Technique System with parts description (a) and when the system is measuring and displaying the readings
of a palm oil fruit (b)
2.2 Operation of the system
Basically, the hardware of the project operates in systematic order. First, the microcontroller Arduino Mega 2560 will be programmed to ensure the sensor and the output display can be integrated. Then, at the beginning of the startup of the hardware, the LCD will display a message indicating the device is ready to be used. Then the user must point the front part of the hardware to the sample, which is oil palm FFB. The ultrasonic sensor HC-SR04 will determine the distance of the sample from the hardware. If the sample is in suitable distance, the
phototransistor will measure the amount of light reflected onto the surface of the oil palm. There should be a difference in reading between three levels of ripeness of the oil palm. Hence, the ripeness level for the sample will be displayed on the LCD.
2.3 Block diagram of the system
The block diagram of the system is shown in Figure 2. A 9 V power supply was used to power up the microcontroller. Then, the sensor system that consist of 670 nm wavelength of Light Emitting Diode (LED) and a reflectance sensing elements will communicate with the Arduino Mega 2560 to collect data. The data then was interpreted and the output will be displayed. For this research, the early stage output are in analytical form. Hence, a graph will be produced by using Microsoft Excel.
Figure 2: Block diagram of the developed system
2.4. Reflectance sensor circuit
Figure 3 shows the schematic diagram for the reflectance sensor. Basically, the reflectance sensor acts as a receiver in this project. A 5V supply voltage will be provided by the Arduino Mega 2560 into the circuit. The light reflected will enter the base region of the phototransistor and will control the value of the signal out. The signal out will be interfaced with the analog input of the Arduino Mega 2560. The type of connection used for the sensor are common-emitter amplifier. This circuit generates an output which transitions from a low state to a high state when light is detected by the phototransistor.
37
The output is created by connecting a resistor between the emitter pin of the component and ground. The output is read at the emitter terminal. The circuit also can be used in two modes, an active mode and switch mode. Operating in active mode means that the phototransistor generates response proportional to the light received. When the amount of light received surpass that level, the phototransistor become saturated and the output will not increases even as the light level increases. Whereas operating in switch mode means that the phototransistor will either off or on in response of light.
2.5 Working principle of ripeness grading
There are a lot of molecules that can be found in plants. Each of this molecule has its own identity and characteristic. Since this project involve the study or classification level of maturity of oil palm FFB, it is essential to dig valuable information in term of biological content in oil palm FFB. Technically, chlorophyll is a molecule that presents in plants that serve a purpose of absorbing sunlight and converts its energy to synthesize carbohydrates [5]. The basic structure of chlorophyll is shown in Figure 4. This process is better known as photosynthesis. Chlorophyll also can be refer as photoreceptor since it has the properties of absorbing sunlight. It is a very capable photoreceptors and have high absorption bands in the visible regions which is in 400 to 700 nm range of wavelength of light [5].
This is the property that will be explored more upon to determine the level of maturity of oil palm FFB. It was suggested that oil palm fruit pigments such as chlorophyll ratio affect the color of the oil palm [6]. These change can be analyzed by using the techniques suggested, which is by measuring the reflectance data of the oil palm FFB.
Therefore, in this project, the chlorophyll content will be selected as a determining factor that will classify the maturity of the oil palm FFB. The characteristic of the chlorophyll can be utilize by using the four-band sensor system.
Figure 4: Structure of Chlorophyll [5]
3.
Experimental setup, results and discussion
The sample size of each fruit category (under-ripe, ripe and over ripe) is 50 fruits thus, in total, 150 fruit samples were tested. For each fruit, 3 measurements were taken and then recorded, and the average value of these three measurements is calculated.
3.1 Over-ripe category
The first, second, third and average measurement for each fruit in over-ripe category is shown in Figure 5. Most of the average value of the sample is above 2 V. This indicated that the chlorophyll, which have the characteristic of absorbing visible light (especially around 670 nm wavelength) is small in number compared to the other two categories of oil palm ripeness. When there are less chlorophyll content inside the oil palm fruit, the amount of light absorbed also lessen. Hence, the light reflected back to the sensor are also high, resulting in the value.
Figure 5: Voltage measurements for over-ripe category
3.2 Ripe category
The first, second, third and average measurement for each fruit in ripe category is shown in Figure 6. The average voltage readings for ripe category are less than over-ripe where most of the value are less than 2 V. This indicates that there are more amount of chlorophyll in ripe category compared to the over-ripe category. This is proven when the value of the voltage are smaller than the over-ripe category.
In other words, some of the light projected are being absorbed by the oil palm and the light reflected are weaker and allowing only a medium amount of voltage passing through the sensor.
38
3.3 Under-ripe category
The first, second, third and average measurement for each fruit in under-ripe category is shown in Figure 7. The average value of voltage for under-ripe are highly different from the previous two categories as most of the value are below 1 V. The reason for this value are the high concentration of chlorophyll in the under-ripe category. This means that more light is being absorbed. Thus less light is being reflected resulting in low amount of voltage from the sensor.
Figure 7: Voltage measurements for under-ripe category
3.4 Measurement difference of the three
category of ripeness
Figure 8 below shows the difference of 3 categories of the oil palm fresh fruit bunch. Next step were to evaluate each of the result for each categories.
Figure 8: Measurements of three category of ripeness
As all of the three ripeness categories of the oil palm fresh fruit bunch were taken, all of the average voltage value for all sample are combined. After converting the result into a graph as shown in Figure 8, the difference for each categories can be seen clearly. For the over-ripe, most of the voltage value are in between 2 V until 2.7 V. For ripe, the value are in between 1 V until 1.8 V and for under-ripe, the value are below 1 V.
Basically, the purpose of taking all of the readings for each categories is to determine the range of voltage value. This is necessary to produce a condition that can be included in the programming of the device. This is only possible if the value of each categories are different where in this case, it is indeed different from each other.
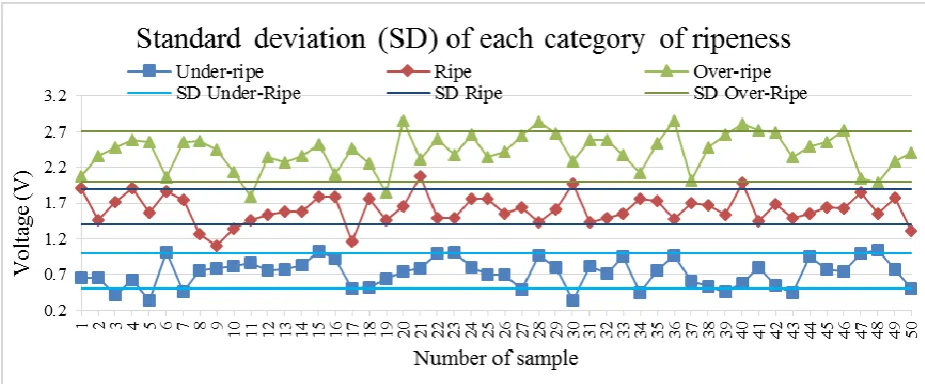
Next step is to find the appropriate range of value for all three categories First is the calculation for mean for each categories. Then the value of variance are also identified. Lastly, the standard deviation for each categories.
The important factor that needed to be determined are the standard deviation. This value will be used in the coding of the device to classify the ripeness of the oil palm fresh fruit bunch.
After identifying all the parameter that needed to be calculated, the calculation was produced by using the Microsoft Excel software. The value for each categories are then recorded. Table 1 showing the result of statistical calculation of the average voltage of the three ripeness categories of oil palm fresh fruit bunch.
After the value of standard deviation has been calculated, only then the normal range of value for all of the ripeness categories can be clearly identified as can be seen in Figure 9. With the lower and upper value, we can identified which value are normal and which value are extra large or small. For over-ripe, there are around 8 readings that are more or less than normal. For ripe, there are 7 readings that are more or less than normal and for under-ripe, there are 10 readings. With this value, it is much easier to set the value in the programming. Hence, this value was then set to determine ripeness categories.
Table 1: Statistical results Parameter Categories
Under-Ripe
Ripe Over-Ripe
Mean 0.725 1.616 2.420 Variance 0.038 0.042 0.066 Standard
Deviation
0.196 0.204 0.258
0.0 0.5 1.0 1.5 2.0 2.5 3.0
0 10 20 30 40 50
V
ol
ta
ge
(V
)
Number of Readings
Average Voltage of fruit samples in all category of ripeness
39
4.
Conclusion
For the final part of the project, it can be concluded that the project was successful. The study of this project evaluated the ability of a portable sensor system for determining oil palm fresh fruit bunch (FFB) maturity under field conditions.
Firstly, the device enable to differentiate the average voltage reading for each categories which is under-ripe, ripe and over-ripe. This is only possible with the understanding of the characteristic of chlorophyll. With its ability to absorb a certain wavelength of light (670 nm), the output voltage for each categories can be obtained. The objective was to classify each ripeness category differently and from the result, this is a success.
Theoretically, a chlorophyll content inside oil palm will decrease as it ripens. With this statement, it can be state that the under-ripe category has the highest amount of chlorophyll whereas the over-ripe has the lowest. This will put the ripe category in the middle. Hence, the under-ripe oil palm FFB will absorb more light resulting in less light reflected to the sensor producing low voltage reading. Compared to the over-ripe, the light are less absorbed since the little amount of chlorophyll and the reflected light are higher than under-ripe.
Furthermore, a statistical analysis that has been conducted also tells that each categories has its own range of value. With this range of normal value, a set of rules can be implemented in the programming. Any reading taken by the device will be categorized as either under-ripe, ripe or over-ripe depending on the pre-determined range of reading values of each category. Although this is programmed, there are also possibility that several reading that has been taken by the device producing an inconsistent result. For example, even though the bunch are ripe, but there may be some area of the bunch that are still not ripe, producing the inconsistency. Apart from that, there are also an issue regarding the oil palm surface. A good surface that can reflect the light into the sensor need to be chosen.
Acknowledgment
The authors are grateful for the financial support from Universiti Tun Hussein Onn Malaysia’s TIER 1 Grant Scheme (U853 and U864).
References
[1] Malaysian Palm Oil Board. Oil Palm grading manual. Ministry of Primary Industries, Malaysia, (August 2003).
[2] Roseleena, J., Nursuriati, J., Ahmed, J. and Low, C.Y. Assessment of palm oil fresh fruit bunches using photogrammetric grading system. International Food Research Journal, Volume 18(3), (2011).
[3] Mohd Hazir, M.H., Mohamed Shariff, A.R. and Amiruddin, M.D. Determination of oil palm fresh fruit bunch ripeness based on flavonoids and anthocyanin content. Industrial Crops and Products, Volume 36(1), (2012), pp. 466-475.
[4] Abdullah, M.Z., Fathinul Syahir, A.S. and Mohd Azemi B.M.N. Automated inspection system for color and shape grading of starfruit using machine vision sensor. Transactions of the Institute of Measurement and Control, Volume 27(2), (2005), pp. 65-87. [5] May, P. Chlorophyll. School of Chemistry, University
of Bristol, Retrieved on April 8, (2017), from http://www.chm.bris.ac.uk/motm/chlorophyll/chloro phyll_h.htm.
[6] Ben Saaed, O.M., Sankaran, S., Mohamed Shariff, A.R., Ehsani, R., Alfatni, M.S. and Mohd Hazir, M.H. Classification of Oil Palm fresh fruit bunches based on their maturity using portable four-band sensor system.
Computers and Electronics in Agriculture, Volume 82, (2012), pp. 55-60.